Nacho the Kat Bullish Falling Wedge Pattern Signals PotentialChart Overview
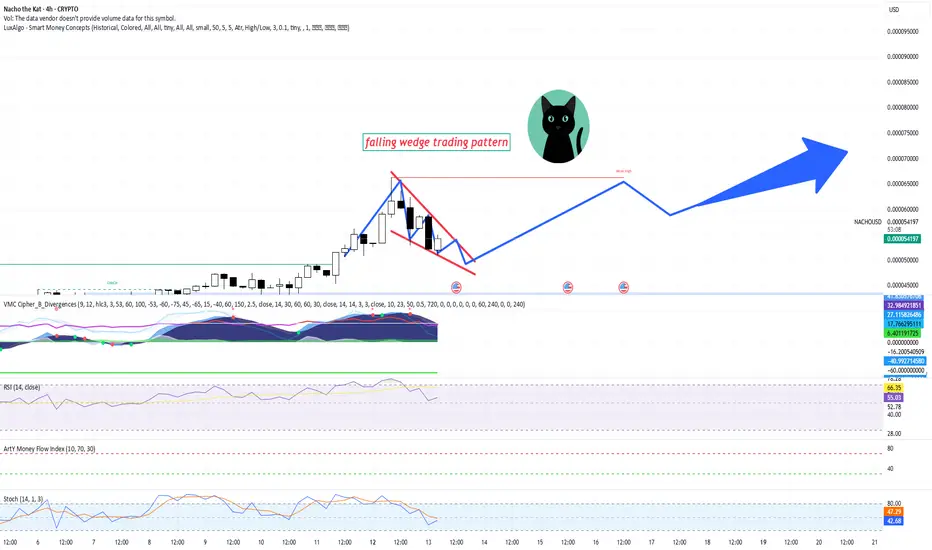
The chart shows a falling wedge pattern forming on a 4-hour timeframe for "Nacho the Kat" (NACHO/USD). This is a bullish pattern often indicating a potential price breakout to the upside, particularly after a period of consolidation within the wedge.
Price Action Analysis
Current Price: The price is approaching a potential breakout point, with the trend following the pattern outlined in the chart.
Falling Wedge:
The pattern suggests the price has been consolidating within lower highs and higher lows, creating a narrowing range. Historically, the breakout from a falling wedge tends to be upward, especially when volume and momentum indicators align with the trend.
Volume and Momentum Indicators
VMC (Volume Momentum Cipher): Shows divergence (highlighted by green and red dots). The momentum is slowing but still supports the possibility of an upward move once the price breaks above the resistance level.
RSI (Relative Strength Index): RSI is at 55.03, indicating neutral market conditions. There is room for upward momentum before reaching overbought conditions, which further supports the possibility of an upside breakout.
ArtY Money Flow Index: It is currently above 40, showing positive money flow, indicating that buying pressure is still relatively strong.
Stochastic Oscillator: The Stochastic is at 47.29, which is within a neutral range. However, it could suggest potential upward movement, especially if the oscillator crosses above 50.
Support and Resistance Levels
Support: The support level is represented by the strong low section of the falling wedge. A breakdown below this level could invalidate the pattern.
Resistance: The resistance lies at the upper edge of the falling wedge. Once the price breaks this level, it could indicate the start of a bullish move.
Trading Plan
Entry Point:
Wait for a confirmed breakout above the upper resistance of the wedge. A break above this level will provide a clearer confirmation of upward movement.
Consider entering the position at or above 0.0000057 USD.
Stop-Loss:
Place the stop-loss below the lower trendline of the wedge to limit potential losses in case the breakout fails. A reasonable stop-loss could be around 0.0000045 USD.
Take-Profit Targets:
Short-Term Target: After a breakout, aim for a conservative target around the next resistance at 0.0000065 USD.
Long-Term Target: If momentum continues to build, the next potential resistance levels may be around 0.0000075 USD.
Risk Management:
As with any trade, ensure to use proper risk management by not risking more than 1-2% of your total capital per trade.
Keep an eye on the volume and momentum indicators. If they show signs of weakening before the breakout, consider reducing position size or waiting for more confirmation.
Final Thoughts
The falling wedge pattern suggests that "Nacho the Kat" cryptocurrency may be preparing for a bullish breakout, but it's essential to monitor price action carefully. A strong breakout with increasing volume will likely signal further gains, while a failure to break the wedge resistance could lead to further consolidation or downside risks.
Nacho
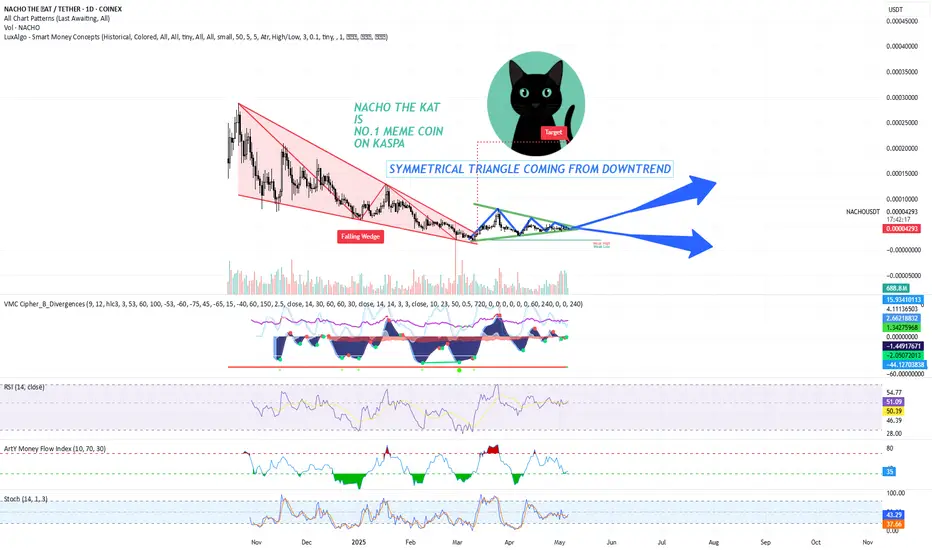
NO.1 MEME COIN ON KASPA IS NACHO THE KAT - DYORThe chart shows a symmetrical triangle pattern forming after a falling wedge. A falling wedge is typically seen as a bullish reversal pattern, indicating that the price may break out to the upside after the convergence of the trendlines. The symmetrical triangle, which is forming after the falling wedge, suggests consolidation before the breakout, likely pointing towards higher price action.
Key Points
Price Action and Trend:
NACHO has been in a downtrend, creating a falling wedge. The falling wedge has converging trendlines, which is a common setup for a bullish breakout.
Currently, the price is consolidating within a symmetrical triangle pattern, with lower highs and higher lows, indicating indecision in the market. The breakout from this triangle is likely to be significant, either continuing the previous downtrend or initiating a bullish reversal.
Volume Analysis:
The volume profile at the bottom shows an increase in volume as the price approaches the apex of the symmetrical triangle, suggesting potential strength behind the breakout.
It's important to monitor if volume increases further upon breakout to confirm the strength of the move.
Key Indicators:
RSI (Relative Strength Index): The RSI is currently around 50.39, suggesting a neutral market sentiment. The RSI has been ranging between oversold and overbought territories, which indicates that NACHO has not yet entered a strong trend but may be preparing for one.
Stochastic RSI: The Stochastic RSI is hovering around 37.57, showing a neutral stance, but it is closer to the oversold region, which could indicate that NACHO is near a potential reversal.
Money Flow Index (MFI): The MFI is at 35, indicating that the market is not yet in a strong buying or selling pressure zone. This shows that there is room for price movement based on volume.
VMC Cipher B Divergences: Positive divergence could suggest bullish momentum emerging, even if the price remains in consolidation.
Target and Resistance Levels:
If NACHO breaks out to the upside from the symmetrical triangle, the target is likely near the upper trendline of the wedge, which aligns with previous highs, possibly reaching the 0.00004500-0.00005000 USDT range.
Immediate resistance is near the 0.00004300 price level.
Support levels to watch are 0.00003000 and 0.00002000, which are key levels from previous price action.
Trading Plan
Entry Strategy:
Breakout Strategy: A strong breakout above the upper trendline of the symmetrical triangle would be a potential buy signal. If the price breaks and closes above 0.00004200, consider entering a long position with a target at 0.00004500-0.00005000.
Volume Confirmation: Ensure that the breakout is accompanied by an increase in volume. A low-volume breakout could be a false signal.
Stop-Loss Strategy:
Initial Stop-Loss: Place a stop-loss just below the symmetrical triangle's lower trendline or 0.00003000. This provides a reasonable distance to avoid being stopped out on small fluctuations.
Trailing Stop: As the price moves up towards your target, consider adjusting your stop-loss to lock in profits, especially if the price exceeds the 0.00004300 resistance level.
Take-Profit Strategy:
First Profit Target: Set a take-profit order around 0.00004500, the first resistance level. This is a key point based on the historical price action and previous swing highs.
Secondary Target: If the price breaks past 0.00004500, adjust the target to 0.00005000, which is the next logical resistance zone.
Risk Management:
Position Sizing: Risk no more than 1-2% of your total capital on this trade. For example, if your trading account is $5,000, you should risk no more than $100-$150 per trade.
Risk-Reward Ratio: Aim for a minimum 2:1 risk-to-reward ratio. For example, if you risk $150 on a trade, aim for a potential reward of $300 or more.
Additional Considerations:
Market Sentiment: As NACHO is a meme coin, market sentiment plays a huge role. Watch for social media trends and any news related to meme coins or Kaspa-based coins that could drive the price action.
Macro Conditions: Stay updated on the general market conditions for cryptocurrencies, as a broader downtrend in the market could limit the upside potential, even if technicals suggest a breakout.
NACHO THE KAT presents a technical setup with the potential for an upward move following a breakout from the symmetrical triangle. A close watch on volume and key price levels will be critical for confirming the breakout and determining the right moment for entry.