Here’s a fresh Nasdaq100 analysis I’ve put together for you.Hey Guys,
Here’s a fresh Nasdaq100 analysis I’ve put together for you.
I’ve marked the buy zone between 23,252 and 23,240. If price dips into that range, I’m anticipating a potential move upward toward 23,294.
Your likes and support are my biggest source of motivation to keep sharing these insights.
Huge thanks to everyone backing me with a thumbs-up!
NASDAQ 100 CFD

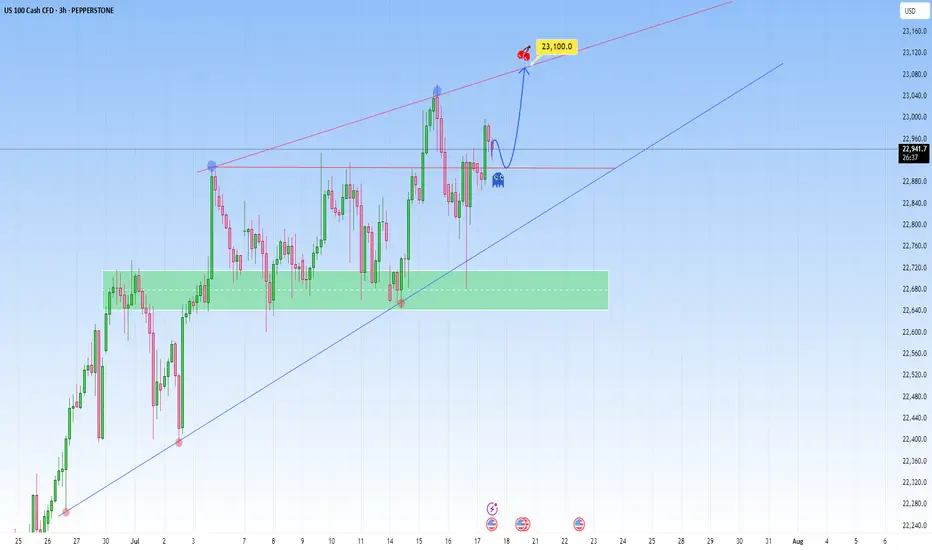
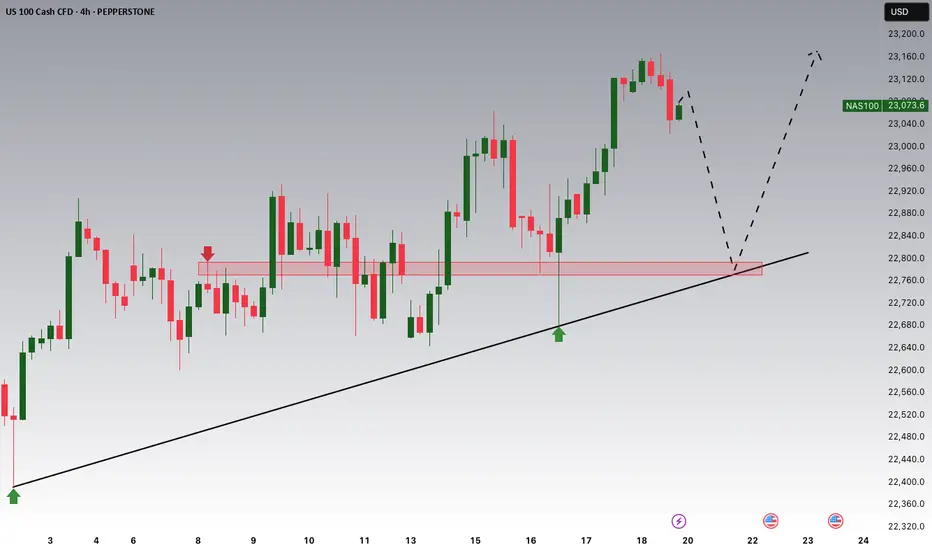
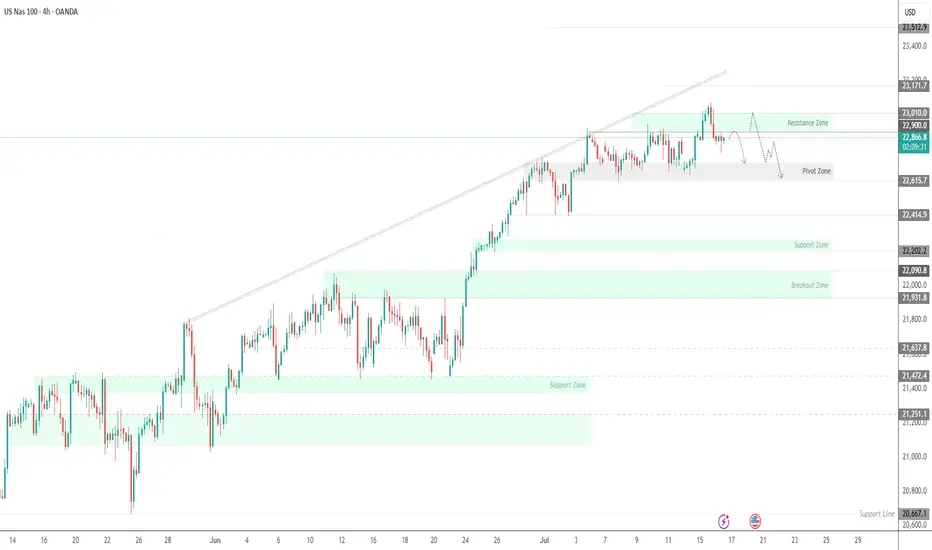
NAS100 Bigger Picture. Uptrend to be resumedLooking at the current structure through the lens of a trend trading approach, what we saw on NAS100 is more than a simple price bounce, it’s a trend continuation trading within a high-volatility environment. As price is approaching a key resistance level, how price is behaving around this dynamic trendline will be key.
This recent retracement and rejection happening near what we can call a demand zone cluster, was confirmed by a beautiful bounce off the support range. And right now price is respecting the upper and lower bounds nicely.
What happens next? Price is showing signs of bullish exhaustion, but the higher-timeframe structure supports a continuation.
My projected target is towards the upper resistance line, that’s my 23,100 zone as shown.
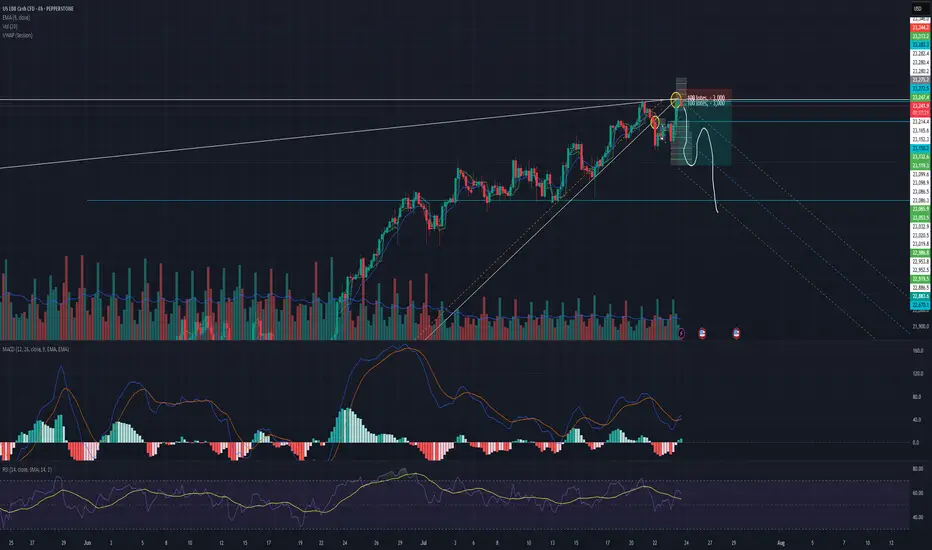
Nasdaq Ascending Trend has been broken.Good night traders.
With Tuesday & today's move. NQ has broken the ascending trend, and retested the highs.
A total of 107 daily candles, 7,000pips move.
Reasons for taking this trade:
Current monthly candle has 2.9m volume, compared to a 6m & 7million from last 2 months. With only 8 days missing to end the month, how to fill all that pending volume?
Ascending trend has been broken and retested.
Expect a deep correction, around 2000-2400-2600 pips. There is correlation between 38.2 Fibo level.
Last week there was a manipulation with Powell dismiss rumor on Wednesday, next day on Thursday NQ rallied to the upside. Today being also Wednesday we saw a huge rejection to the upside, but there is no continuation.
DXY reaching bottom, + has a deeper short trend initiation, starting on January 13.
Trade will be validated if NQ creates a LL followed by a LH within the next 2 days.
What do you think of this analysis?
Thank you.
Enjoy
NASDAQ (CASH100) SHORT - Head and shoulders H1Risk/reward = 3.8
Entry price = 23 167.9
Stop loss price = 23 232.8
Take profit level 1 (50%) = 22 943
Take profit level 2 (50%) = 22 878
Still waiting on confirmation on some variables in checklist

USNAS100 Eyes 23350 Ahead of Powell & Earnings StormUSNAS100
The price maintains bullish momentum, as outlined in the previous idea, with a clean rejection from the 23280 zone. Today, volatility is expected to increase ahead of Jerome Powell’s speech and a wave of key earnings reports.
As long as price holds above 23140, the outlook remains bullish toward 23230 and 23350.
A short-term correction toward 23045 is possible if we get a 1H close below 23140.
Resistance: 23230 · 23350 · 23510
Support: 23045 · 22920
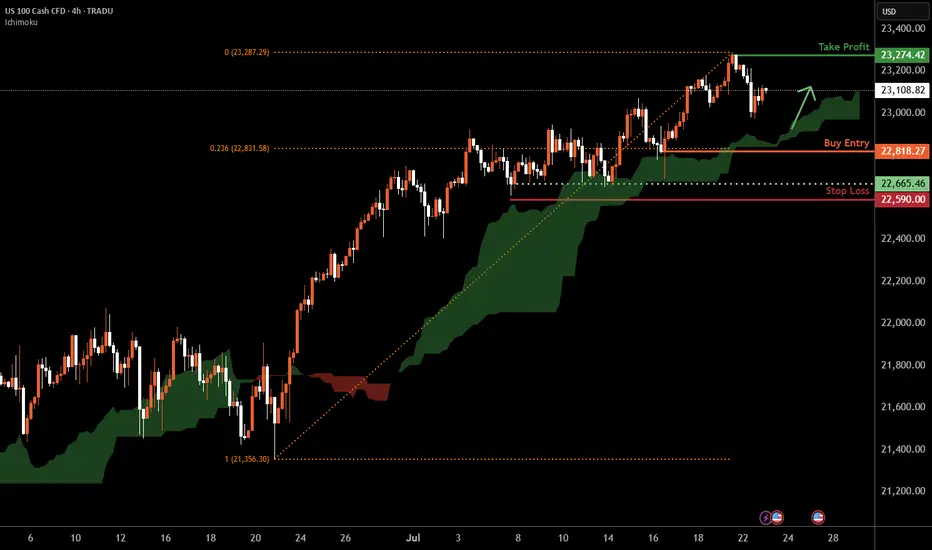
Nasdaq-100 H4 | Bullish uptrend to extend higher?The Nasdaq-100 (NAS100) is falling towards a swing-low support and could potentially bounce off this level to climb higher.
Buy entry is at 22,818.27 which is a swing-low support that aligns with the 23.6% Fibonacci retracement.
Stop loss is at 22,590.00 which is a level that lies underneath a multi-swing-low support.
Take profit is at 23,274.42 which is a swing-high resistance.
High Risk Investment Warning
Trading Forex/CFDs on margin carries a high level of risk and may not be suitable for all investors. Leverage can work against you.
Stratos Markets Limited (tradu.com ):
CFDs are complex instruments and come with a high risk of losing money rapidly due to leverage. 66% of retail investor accounts lose money when trading CFDs with this provider. You should consider whether you understand how CFDs work and whether you can afford to take the high risk of losing your money.
Stratos Europe Ltd (tradu.com ):
CFDs are complex instruments and come with a high risk of losing money rapidly due to leverage. 66% of retail investor accounts lose money when trading CFDs with this provider. You should consider whether you understand how CFDs work and whether you can afford to take the high risk of losing your money.
Stratos Global LLC (tradu.com ):
Losses can exceed deposits.
Please be advised that the information presented on TradingView is provided to Tradu (‘Company’, ‘we’) by a third-party provider (‘TFA Global Pte Ltd’). Please be reminded that you are solely responsible for the trading decisions on your account. There is a very high degree of risk involved in trading. Any information and/or content is intended entirely for research, educational and informational purposes only and does not constitute investment or consultation advice or investment strategy. The information is not tailored to the investment needs of any specific person and therefore does not involve a consideration of any of the investment objectives, financial situation or needs of any viewer that may receive it. Kindly also note that past performance is not a reliable indicator of future results. Actual results may differ materially from those anticipated in forward-looking or past performance statements. We assume no liability as to the accuracy or completeness of any of the information and/or content provided herein and the Company cannot be held responsible for any omission, mistake nor for any loss or damage including without limitation to any loss of profit which may arise from reliance on any information supplied by TFA Global Pte Ltd.
The speaker(s) is neither an employee, agent nor representative of Tradu and is therefore acting independently. The opinions given are their own, constitute general market commentary, and do not constitute the opinion or advice of Tradu or any form of personal or investment advice. Tradu neither endorses nor guarantees offerings of third-party speakers, nor is Tradu responsible for the content, veracity or opinions of third-party speakers, presenters or participants.
NAS100 Bullish Setup: Clean Structure & Entry Zone Pending📊 NASDAQ 100 (NAS100) remains bullish, showing a clean, well-structured uptrend—higher highs and higher lows 🔼📈.
Price has now pulled back into my optimal entry zone 🎯. At this stage, I’m waiting for a bullish break in market structure before considering an entry 🟢🔓.
Patience is key—let the structure confirm first.
Not financial advice ❌💼

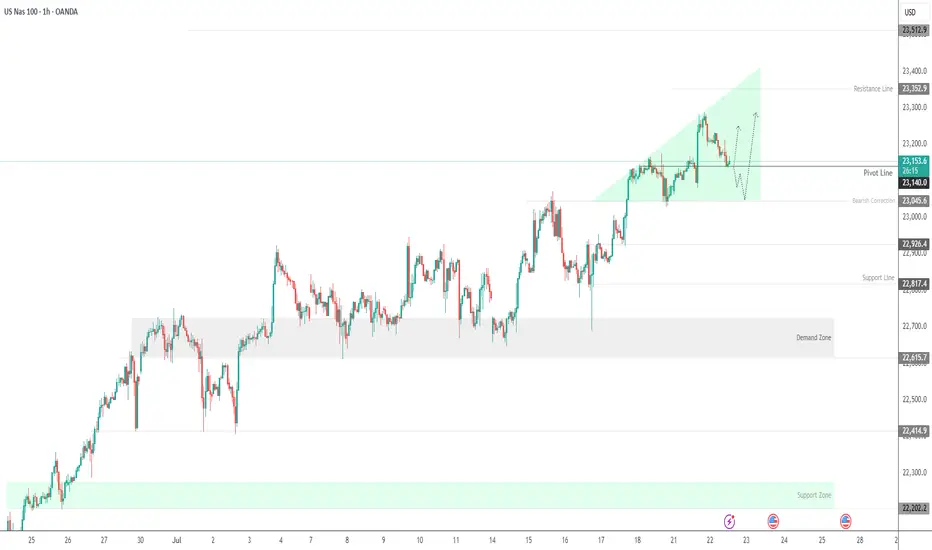
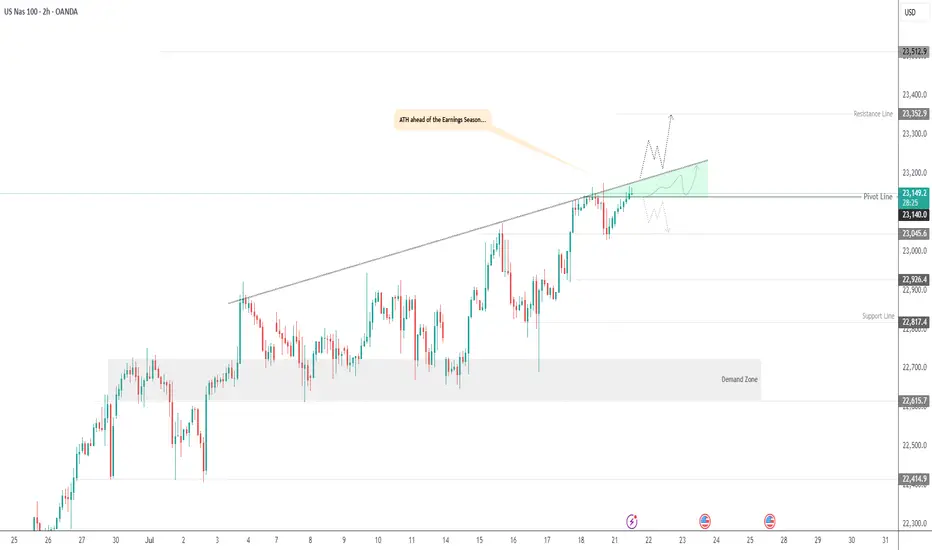
USNAS100 | Bullish Setup Ahead of Tech Earnings & Trade RiskUSNAS100 | Bullish Setup Ahead of Tech Earnings & Trade Risk
U.S. equity markets are entering a pivotal week with big-tech earnings and renewed focus on Trump’s proposed trade tariffs. Both the S&P 500 and Nasdaq are hovering near record highs, but new catalysts are required for continuation.
Technical Outlook:
The price has stabilized above 23140, breaking the pivot and confirming bullish momentum. As long as the price holds above this level, the trend remains bullish, especially if it breaks the green triangle resistance structure.
A sustained move above 23140 opens the path toward 23250 and 23350, with further extension possible to 23510.
However, a 4H close below 23140 may activate a bearish correction toward 23045, and possibly deeper toward 22920 and 22820.
Resistance Levels: 23250 · 23350 · 23510
Support Levels: 23045 · 22920 · 22820
Bias: Bullish above 23140
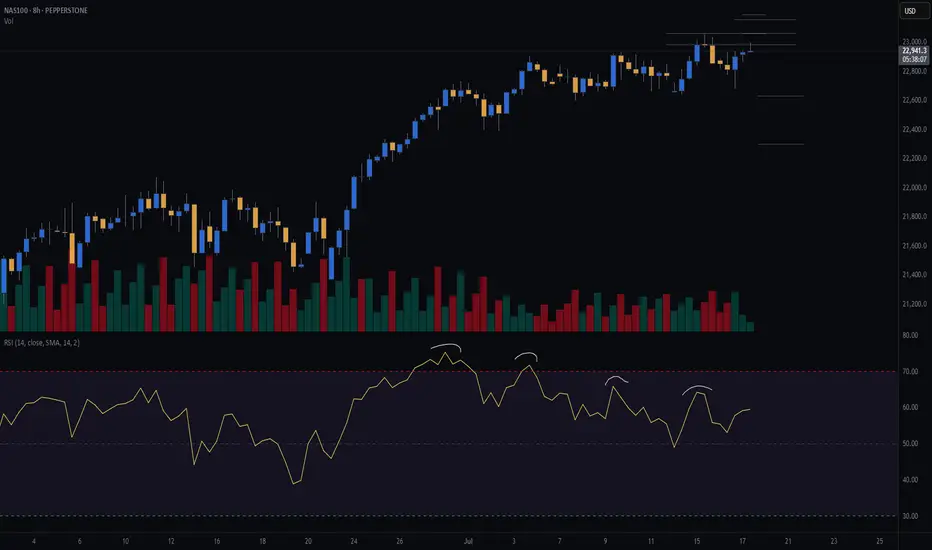
Nasdaq 100: Market Optimism Builds Ahead of Big Tech EarningsNasdaq 100: Market Optimism Builds Ahead of Big Tech Earnings
The earnings season is gaining momentum. This week, major technology companies such as Alphabet (GOOGL) and Tesla (TSLA) are scheduled to release their quarterly results.
Given that 85% of the 53 S&P 500 companies that have already reported have exceeded analysts’ expectations, it is reasonable to assume that market participants are also anticipating strong results from the big tech names. The Nasdaq 100 index (US Tech 100 mini on FXOpen) set an all-time high last week — a level that may be surpassed (potentially more than once) before the end of August.
Technical Analysis of the Nasdaq 100 Chart
Price movements have formed an upward channel (marked in blue), with the following dynamics observed:
→ The bearish signals we highlighted on 7 July did not result in any significant correction. This may be interpreted as a sign of a strong market, as bearish momentum failed to materialise despite favourable technical conditions.
→ Buyers have shown initiative by gaining control at higher price levels (as indicated by the arrows): the resistance at 22,900 has been invalidated, while the 23,050 level has flipped to become support.
→ A long lower shadow near the bottom boundary of the channel (circled on the chart) underscores aggressive buying activity.
Should the earnings and forward guidance from major tech firms also come in strong, this could further reinforce the sustainable bullish trend in the US equity market.
This article represents the opinion of the Companies operating under the FXOpen brand only. It is not to be construed as an offer, solicitation, or recommendation with respect to products and services provided by the Companies operating under the FXOpen brand, nor is it to be considered financial advice.

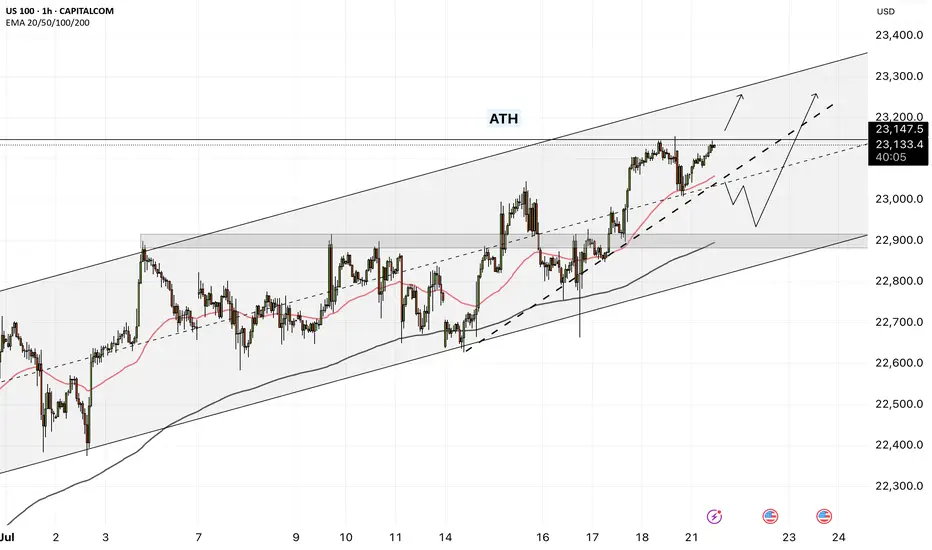
NAS100 - Stock Market Awaits Tariffs!The index is trading above the EMA200 and EMA50 on the 1-hour timeframe and is trading in its ascending channel. The target for this move will be the channel ceiling, but if it corrects towards the indicated support area, it is possible to buy Nasdaq with better reward to risk.
In a week once again clouded by trade tariff threats, the stock market reacted cautiously at times. However, what truly captured investors’ attention was growing concern over potential political interference in Federal Reserve policymaking—a development that influenced market sentiment and shifted the focus away from geopolitical tensions.
Despite political headwinds, U.S. economic data continued to show signs of resilience. Investors this week were more focused on corporate earnings and inflation data than on trade war rhetoric or speculation about Jerome Powell’s possible dismissal. While betting markets such as Polymarket raised the odds of Powell being removed to 40%, legally, the president cannot dismiss the Fed Chair without a valid cause—and allegations like “lying to Congress” lack legal standing.
Still, the greater danger lies not in Powell’s dismissal itself but in the potential erosion of the Federal Reserve’s independence—something that could unsettle investors in stocks, bonds, and currencies alike. Analysts expect Trump may soon appoint an ally as an informal or “shadow” Fed Chair, a move that would elevate political risk in financial markets.
Nevertheless, markets are continuing to operate along familiar lines: equities focus on corporate profits, the bond market on inflation and growth, and the currency market on relative returns. For now, the takeaway is clear: Trump is winning—but perhaps only temporarily.
Rick Rieder, Chief Investment Officer at BlackRock, noted that despite trade tensions and inflation concerns, tariffs have had limited impact so far. Following the June CPI report, he pointed out that inflation ticked up slightly—core CPI rose by 0.23% monthly and 2.93% annually, while headline inflation was up 0.29% monthly and 2.67% annually—but the broader trend still reflects easing price pressures.
Rieder attributed this to companies acting preemptively, managing inventory and adjusting supply chains to avoid passing on costs to consumers. He also cited easing wage pressures and a weakening labor market as factors contributing to the decline in inflation.
As such, Rieder believes the Federal Reserve might lower interest rates in September, though a cut in July is less likely, as the central bank would prefer to assess the impact of tariffs first.
According to the Wall Street Journal, Treasury Secretary Scott Besant privately urged Trump not to remove Jerome Powell. Besant warned that such an action could cause unnecessary turbulence in financial markets and the broader economy, and would also face legal and political hurdles. He emphasized that the Fed is already signaling potential rate cuts later this year, and confronting Powell now would be unwarranted.
A source noted that Besant reminded Trump the economy is performing well, and markets have responded positively to administration policies—another reason to avoid drastic moves.
On another front, rising long-term bond yields have become a concern for Besant, as they increase the government’s borrowing costs.He has been working to keep yields in check and believes firing Powell could further escalate them—hence his conversation with Trump aimed at dissuasion.
The coming week will begin with market attention on the European Central Bank’s rate decision, which could set the tone for Eurozone monetary policy in the second half of the year. Meanwhile, a series of key U.S. economic data will be released, providing a clearer view of conditions in employment, production, and housing.
On Tuesday, Jerome Powell will deliver an opening speech at an official event in Washington. While he is unlikely to directly address Trump’s recent verbal attacks, investors will be listening closely for any subtle references to Fed independence or interest rate direction.
On Wednesday, the June existing home sales report will be released, which could indicate whether housing demand remains steady or is weakening.
Thursday will be a packed day on the economic calendar. The ECB’s rate decision will be announced—an event under heavy scrutiny amid Eurozone stagnation. In the U.S., preliminary PMI data from S&P, weekly jobless claims, and new home sales will also be published.
Finally, the week will wrap up on Friday with the release of U.S. durable goods orders—an important gauge of capital investment in the manufacturing sector.
US100 (NASDAQ 100) 24-Hour Technical Analysis ForecastCurrent Price: 23,076.60 (Close: Friday, July 18th, 2025)
Analysis Period: Next 24 Hours (July 19-20, 2025)
Market Status: Weekend - Preparing for Monday Open
---------------------------------------------------------------------------------------------
EXECUTIVE SUMMARY - 24H OUTLOOK
Primary Bias: Neutral to Bullish (Short-term consolidation expected)
Key Resistance: 23,150 - 23,250
Critical Support: 22,850 - 22,950
Expected Range: 22,900 - 23,200
Volatility Level: Moderate (Tech earnings season approach)
---------------------------------------------------------------------------------------------
1. CANDLESTICK PATTERN ANALYSIS
Friday's Close Formation
---------------------------------------------------------------------------------------------
Pattern: Small-bodied candle with upper shadow at 23,076
Significance: Indecision after testing resistance near 23,150
Volume: Above-average volume suggesting institutional activity
Context: Failed to break cleanly above psychological 23,100 level
---------------------------------------------------------------------------------------------
Expected 24H Patterns
---------------------------------------------------------------------------------------------
Monday Gap: Potential small gap up to 23,100-23,120 area
Continuation Pattern: Bullish flag/pennant formation developing
Key Reversal: Watch for hammer formation at 22,950 support if decline occurs
---------------------------------------------------------------------------------------------
Pattern Probability Assessment
---------------------------------------------------------------------------------------------
Doji/Spinning Top: 40% probability (continued indecision)
Bullish Engulfing: 35% probability (if gap up occurs)
Bearish Reversal: 25% probability (if resistance holds)
---------------------------------------------------------------------------------------------
2. HARMONIC PATTERN ANALYSIS
Current Harmonic Setup
---------------------------------------------------------------------------------------------
Primary Pattern: Bullish Cypher Pattern in Development
---------------------------------------------------------------------------------------------
X: 22,400 (previous major low)
A: 23,250 (recent swing high)
B: 22,800 (61.8% retracement)
C: 23,150 (127.2% extension - current test area)
D (Completion): 22,650-22,750 (78.6% retracement zone)
---------------------------------------------------------------------------------------------
Alternative Pattern: Bull Flag
---------------------------------------------------------------------------------------------
Pole: 22,400 → 23,250 (850-point move)
Flag: Current consolidation 22,950-23,150
Target: 23,250 + 850 = 24,100 (extended projection)
---------------------------------------------------------------------------------------------
Fibonacci Levels (24H Focus)
---------------------------------------------------------------------------------------------
Golden Ratio Support: 22,950 (61.8% of recent swing)
38.2% Retracement: 23,025
23.6% Retracement: 23,050
Extension Target: 23,375 (161.8% projection)
---------------------------------------------------------------------------------------------
3. ELLIOTT WAVE THEORY - 24H COUNT
Primary Wave Count (Bullish Scenario)
---------------------------------------------------------------------------------------------
Macro Structure: Wave 5 of larger degree impulse in progress
Current Position: Wave 4 correction completing
Mini-wave Count: Flat correction pattern (A-B-C structure)
---------------------------------------------------------------------------------------------
24-Hour Wave Projection
---------------------------------------------------------------------------------------------
Wave A: 23,250 → 22,800 (Completed)
Wave B: 22,800 → 23,150 (Completed - 70% retrace)
Wave C: 23,150 → 22,950 (In Progress - Equal to A)
Wave 5 Target: 24,000-24,200 (1.618 extension)
---------------------------------------------------------------------------------------------
Alternative Count (Corrective Scenario)
---------------------------------------------------------------------------------------------
Structure: Double zigzag correction
Current Phase: Second zigzag development
Target: 22,750-22,850 (Wave Y completion)
---------------------------------------------------------------------------------------------
Critical Elliott Levels
---------------------------------------------------------------------------------------------
Wave 4 Low: 22,750 (must hold for bullish count)
Invalidation: Below 22,400 (Wave 1 high)
Confirmation: Break above 23,250 (Wave 3 high)
---------------------------------------------------------------------------------------------
4. WYCKOFF THEORY - 24H PHASE
Current Market Phase Assessment
---------------------------------------------------------------------------------------------
Primary Phase: Reaccumulation (Phase B-C transition)
Composite Operator Action: Testing supply at 23,150 area
Volume Analysis: Absorption of selling pressure evident
Smart Money Activity: Institutional buying on dips below 23,000
---------------------------------------------------------------------------------------------
Expected 24H Wyckoff Dynamics
---------------------------------------------------------------------------------------------
Phase Progression: Moving toward Phase D (Sign of Strength)
Testing Action: Final test of support at 22,950-23,000
Volume Expectation: Declining volume on any weakness
Breakout Setup: Spring action possible below 22,950
---------------------------------------------------------------------------------------------
Key Wyckoff Signals (24H Watch List)
---------------------------------------------------------------------------------------------
Sign of Strength (SOS): Break above 23,150 with volume
Last Point of Support (LPS): 22,950 area test
No Supply: Expected on rallies to 23,100-23,150
Backup to Edge of Creek: Potential dip to 22,850
---------------------------------------------------------------------------------------------
5. W.D. GANN THEORY - 24H ANALYSIS
Square of Nine Analysis
---------------------------------------------------------------------------------------------
Current Position: 23,076° on Gann wheel
Next Cardinal Point: 23,100° (significant psychological resistance)
Natural Support: 23,000° (perfect square - strong magnetic level)
Critical Angle: 22,900° (45-degree angle support from recent low)
---------------------------------------------------------------------------------------------
Time Theory - 24H Cycle
---------------------------------------------------------------------------------------------
Natural Time Cycle: 24-hour cycle from Friday's close
Critical Time Windows:
---------------------------------------------------------------------------------------------
6 hours: 02:00 UTC Monday (potential turn time)
18 hours: 14:00 UTC Monday (major turn potential)
24 hours: 20:00 UTC Monday (cycle completion)
---------------------------------------------------------------------------------------------
Angle Theory Application
---------------------------------------------------------------------------------------------
Rising 45° Line: Currently at 22,950 (critical support)
Rising 63.75° Line: 23,100 (steep resistance angle)
Declining 26.25° Line: 23,150 (gentle resistance)
---------------------------------------------------------------------------------------------
Gann Price Forecasting
---------------------------------------------------------------------------------------------
Square Root Method:
---------------------------------------------------------------------------------------------
Current: √23,076 ≈ 151.9
Next resistance: 152² = 23,104
Major resistance: 153² = 23,409
---------------------------------------------------------------------------------------------
Primary Target: 23,104 (natural Gann resistance)
Extended Target: 23,409 (next perfect square)
---------------------------------------------------------------------------------------------
Time-Price Harmony
---------------------------------------------------------------------------------------------
Harmonic Time: 144 hours from last major low
Price Harmony: 23,076 in harmony with 22,500 base
Next Harmony Level: 23,400 (Fibonacci price relationship)
---------------------------------------------------------------------------------------------
6. MULTI-TIMEFRAME INTRADAY ANALYSIS
5-Minute Chart Analysis
---------------------------------------------------------------------------------------------
Micro Trend: Consolidating triangle pattern
Support: 23,050-23,060 (recent lows)
Resistance: 23,090-23,100 (intraday highs)
Volume Profile: Balanced - no clear direction
RSI (5M): 48-52 range (neutral)
Pattern: Symmetrical triangle (breakout pending)
---------------------------------------------------------------------------------------------
15-Minute Chart Analysis
---------------------------------------------------------------------------------------------
Structure: Bull flag formation
Flag Boundaries: 23,040-23,120
Breakout Level: Above 23,120 (bullish)
Breakdown Level: Below 23,040 (bearish)
Moving Averages: EMA20 at 23,065 (support)
MACD: Consolidating above zero line
---------------------------------------------------------------------------------------------
30-Minute Chart Analysis
---------------------------------------------------------------------------------------------
Primary Pattern: Ascending triangle
Horizontal Resistance: 23,150 (multiple tests)
Rising Support Line: From 22,950 to current levels
Breakout Target: 23,350 (triangle height projection)
Volume: Decreasing (typical triangle behavior)
Bollinger Bands: Contracting (low volatility)
---------------------------------------------------------------------------------------------
1-Hour Chart Analysis
---------------------------------------------------------------------------------------------
Major Structure: Bullish continuation pattern
Cup and Handle: Handle formation in progress
Handle Depth: 7% correction (healthy)
Breakout Level: 23,175 (handle resistance)
Target: 24,000 (cup depth projection)
RSI (1H): 55 (bullish but not overbought)
---------------------------------------------------------------------------------------------
4-Hour Chart Analysis
---------------------------------------------------------------------------------------------
Macro Trend: Strong uptrend intact
Correction Type: Shallow pullback (wave 4 character)
Support Cluster: 22,900-23,000 (multiple confluences)
Resistance Zone: 23,150-23,250
Ichimoku Cloud: Price above cloud (bullish)
Volume Trend: Higher lows pattern (accumulation)
---------------------------------------------------------------------------------------------
7. TECHNICAL INDICATORS MATRIX
Momentum Indicators
---------------------------------------------------------------------------------------------
RSI (4H): 58 (Bullish momentum, room for upside)
RSI (1H): 55 (Neutral-bullish)
Stochastic %K: 62 (Above %D line - bullish)
Williams %R: -35 (Not oversold, upside potential)
---------------------------------------------------------------------------------------------
Trend Indicators
---------------------------------------------------------------------------------------------
MACD (4H): Above signal line, histogram positive
ADX: 35 (Strong trend strength)
Parabolic SAR: 22,950 (supportive)
Supertrend: 22,850 (strong support)
---------------------------------------------------------------------------------------------
Volume Indicators
---------------------------------------------------------------------------------------------
OBV: Rising trend (accumulation pattern)
Volume Rate of Change: Positive
Chaikin Money Flow: +0.15 (buying pressure)
Accumulation/Distribution: Uptrend
---------------------------------------------------------------------------------------------
8. KEY SUPPORT & RESISTANCE LEVELS (24H)
Critical Resistance Levels
---------------------------------------------------------------------------------------------
R1: 23,100 (Psychological + Gann)
R2: 23,150 (Technical resistance + harmonic)
R3: 23,200 (Minor resistance)
R4: 23,250 (Major swing high)
R5: 23,350 (Extended target)
---------------------------------------------------------------------------------------------
Vital Support Levels
---------------------------------------------------------------------------------------------
S1: 23,040 (Immediate support)
S2: 23,000 (Psychological + Gann)
S3: 22,950 (Critical support cluster)
S4: 22,900 (Strong technical support)
S5: 22,850 (Major support zone)
---------------------------------------------------------------------------------------------
9. 24-HOUR TRADING SCENARIOS
Scenario 1: Bullish Breakout (50% Probability)
---------------------------------------------------------------------------------------------
Trigger: Break above 23,120 with volume expansion
Initial Target: 23,180-23,200
Extended Target: 23,300-23,350
Stop Loss (Longs): Below 22,990
Expected Timeline: 12-18 hours from breakout
---------------------------------------------------------------------------------------------
Scenario 2: Continued Consolidation (35% Probability)
---------------------------------------------------------------------------------------------
Range: 23,000-23,150
Trading Strategy: Range-bound scalping
Buy Zone: 23,020-23,040
Sell Zone: 23,120-23,140
Duration: Full 24-hour period
---------------------------------------------------------------------------------------------
Scenario 3: Bearish Breakdown (15% Probability)
---------------------------------------------------------------------------------------------
Trigger: Break below 22,990 on volume
Target 1: 22,900-22,950
Target 2: 22,850-22,900
Bounce Level: 22,800-22,850
Recovery Above: 23,050 negates bearish scenario
---------------------------------------------------------------------------------------------
10. RISK FACTORS & CATALYSTS (24H)
Bullish Catalysts
---------------------------------------------------------------------------------------------
Tech earnings optimism building
AI sector momentum continuation
Institutional portfolio rebalancing (month-end flows)
Strong economic data expectations
Risk-on sentiment from Asia markets
---------------------------------------------------------------------------------------------
Bearish Risk Factors
---------------------------------------------------------------------------------------------
Profit-taking ahead of earnings
Rising bond yields concern
Geopolitical tensions impact
Overbought technical condition worries
Sector rotation out of tech
---------------------------------------------------------------------------------------------
High-Impact Events (Next 24H)
---------------------------------------------------------------------------------------------
Asian market opening (risk sentiment gauge)
Weekend news flow analysis
Pre-earnings positioning
Options expiry effects
Futures gap analysis
---------------------------------------------------------------------------------------------
11. TRADING RECOMMENDATIONS (24H)
For Scalpers (5M-15M Timeframes)
---------------------------------------------------------------------------------------------
Primary Setup: Triangle breakout trade
Entry Long: Above 23,120
Target: 23,160-23,180
Stop Loss: 23,080
Risk/Reward: 1:2 ratio
---------------------------------------------------------------------------------------------
For Intraday Traders (30M-1H)
---------------------------------------------------------------------------------------------
Strategy: Bull flag continuation
Entry Zone: 23,050-23,070 (on dips)
Target 1: 23,150
Target 2: 23,200
Stop Loss: 23,000
---------------------------------------------------------------------------------------------
For Swing Setup (4H basis)
---------------------------------------------------------------------------------------------
Approach: Pullback buying opportunity
Optimal Entry: 22,950-23,000
Primary Target: 23,350-23,400
Extended Target: 23,600
Stop Loss: 22,850
---------------------------------------------------------------------------------------------
12. CONFLUENCE ANALYSIS
Bullish Confluence at 22,950-23,000
---------------------------------------------------------------------------------------------
Gann Theory: 23,000° perfect square support
Elliott Wave: Wave 4 completion zone
Wyckoff: Last Point of Support (LPS)
Fibonacci: 61.8% retracement level
Moving Averages: EMA 50 confluence
Volume Profile: High volume node support
---------------------------------------------------------------------------------------------
Resistance Confluence at 23,150-23,200
---------------------------------------------------------------------------------------------
Harmonic: Cypher pattern C-point resistance
Previous Structure: Multiple test area
Psychological: Round number resistance
Gann Angles: 63.75° resistance line
Elliott Wave: Wave B completion area
Technical: Flag pattern upper boundary
---------------------------------------------------------------------------------------------
FINAL 24H FORECAST SUMMARY
Most Likely Scenario: Continued consolidation with upward bias, testing 23,150 resistance with potential breakout to 23,200+ levels.
Trading Range Expectation: 22,980 - 23,180 (primary range)
Breakout Levels:
---------------------------------------------------------------------------------------------
Bullish: Above 23,120 → targets 23,200-23,350
Bearish: Below 22,980 → targets 22,900-22,950
---------------------------------------------------------------------------------------------
Key Time Windows:
---------------------------------------------------------------------------------------------
Asian Open: 00:00-02:00 UTC (gap direction)
US Pre-market: 08:00-13:30 UTC (institutional flows)
US Cash Open: 13:30 UTC (volume confirmation)
---------------------------------------------------------------------------------------------
Risk Management Notes:
---------------------------------------------------------------------------------------------
Position sizing should account for tech sector volatility
Weekend gap risk considerations
Earnings season positioning effects
---------------------------------------------------------------------------------------------
Probability Assessment:
---------------------------------------------------------------------------------------------
50% - Bullish breakout scenario
35% - Range-bound consolidation
15% - Bearish breakdown
---------------------------------------------------------------------------------------------
Disclaimer: This analysis is for educational purposes only. Trading involves substantial risk of loss. Always use appropriate risk management and never risk more than you can afford to lose. Past performance does not guarantee future results.
---------------------------------------------------------------------------------------------
---------------------------------------------------------------------------------------------
For those interested in further developing their trading skills based on these types of analyses, consider exploring the mentoring program offered by Shunya Trade.
I welcome your feedback on this analysis, as it will inform and enhance my future work.
Regards,
Shunya Trade
⚠️ Disclaimer: This post is educational content and does not constitute investment advice, financial advice, or trading recommendations. The views expressed here are based on technical analysis and are shared solely for informational purposes. The stock market is subject to risks, including capital loss, and readers should exercise due diligence before investing. We do not take responsibility for decisions made based on this content. Consult a certified financial advisor for personalized guidance.
NASDAQ: Still Bullish! Look For Valid Buys!Welcome back to the Weekly Forex Forecast for the week of July 21-25th.
In this video, we will analyze the following FX market:
NASDAQ (NQ1!) NAS100
The Stock Indices are strong, and showing no signs of selling off. Buy it until there is a bearish BOS.
Enjoy!
May profits be upon you.
Leave any questions or comments in the comment section.
I appreciate any feedback from my viewers!
Like and/or subscribe if you want more accurate analysis.
Thank you so much!
Disclaimer:
I do not provide personal investment advice and I am not a qualified licensed investment advisor.
All information found here, including any ideas, opinions, views, predictions, forecasts, commentaries, suggestions, expressed or implied herein, are for informational, entertainment or educational purposes only and should not be construed as personal investment advice. While the information provided is believed to be accurate, it may include errors or inaccuracies.
I will not and cannot be held liable for any actions you take as a result of anything you read here.
Conduct your own due diligence, or consult a licensed financial advisor or broker before making any and all investment decisions. Any investments, trades, speculations, or decisions made on the basis of any information found on this channel, expressed or implied herein, are committed at your own risk, financial or otherwise.

NASDAQ Potential UpsidesHey Traders, in tomorrow's trading session we are monitoring NAS100 for a buying opportunity around 22,780 zone, NASDAQ is trading in an uptrend and currently is in a correction phase in which it is approaching the trend at 22,780 support and resistance area.
Trade safe, Joe.
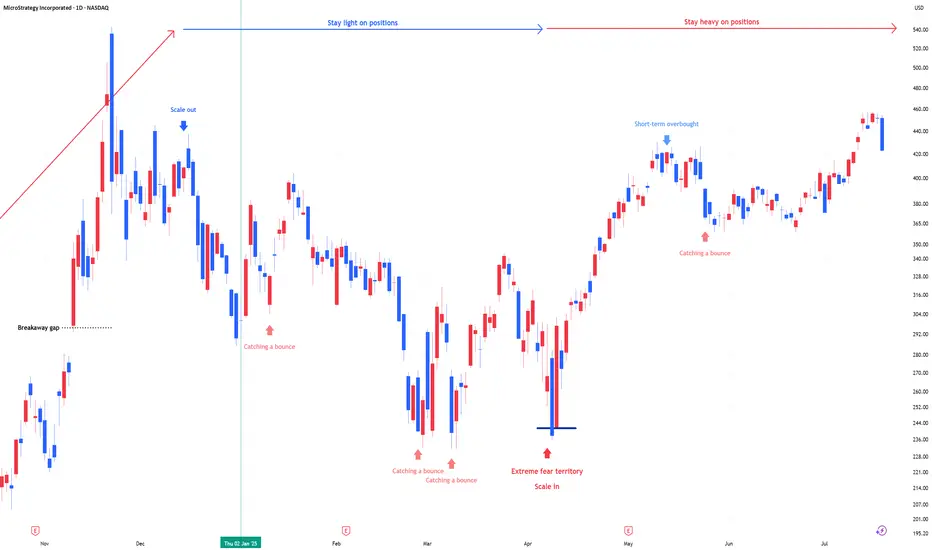
MSTR: Stay heavy on positions"MSTR position size is adjusted in line with US market and bitcoin signals for underweight or overweight allocations. During panic phases, 2x leverage ETFs are on the table."
Stay heavy on positions
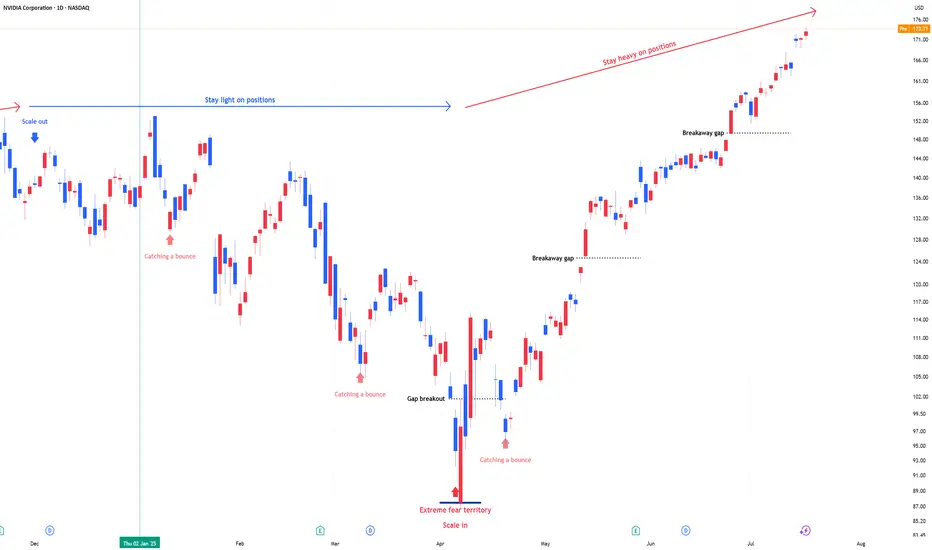
NVIDIA: Stay heavy on positionsNVDA position size is adjusted in line with US market signals for underweight or overweight allocations. During panic phases, 2x leverage ETFs are on the table
Stay heavy on positions.
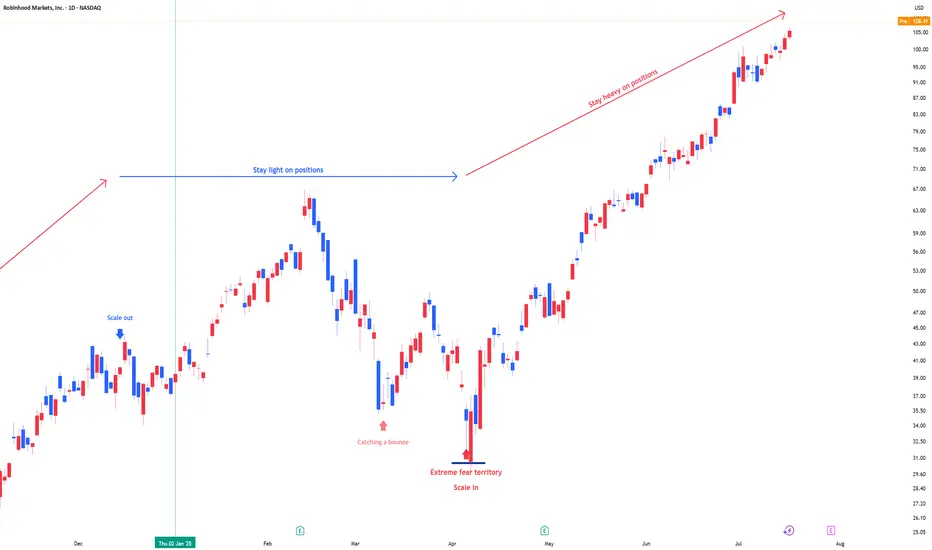
RobinHood Markets: Stay heavy on positionsHOOD position size is adjusted in line with US market signals for underweight or overweight allocations. During panic phases, 2x leverage ETFs are on the table
Stay heavy on positions.
NAS100 (CASH100) SHORT - Double Top H8Risk/reward = 4.6
Entry price = 23 063
Stop loss price = 23 190
Take profit level 1 (50%) = 22 635
Take profit level 2 (50%) = 22 303
Still waiting for confirmation on some variables.
For example, need H8 candle to close in range and volume to validate, amongst other variables.
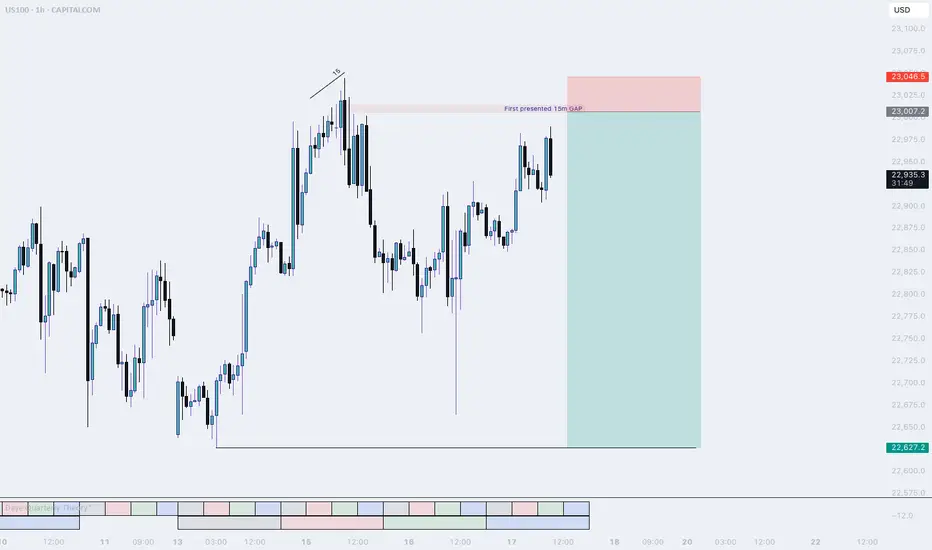
NQ, Short setupJust before market Open price dropped lower, I expect price to travel back up into the 15 m Gap and then sell off. This is the only setup I am interested in today.
The 15m level will be a resistance level for price. This level is derived from the last reversal. Since NQ was lagging, i expect price to use his level to squeeze the shorts out and start a new down trend.
If this does not happen and the highs get taken out, I will be flat today
Goodluck, Good trading.
F
NASDAQ 100: AI Momentum and Resilient Earnings Drive New HighsThe NASDAQ 100 continues its strong uptrend 📈, recently breaking to new highs after a period of consolidation. The rally is broad-based but remains led by heavyweight tech names and AI-related stocks 🤖.
Key Fundamental Drivers:
AI & Tech Growth 🤖💡: The biggest catalyst is the ongoing boom in artificial intelligence and digital transformation. Companies in the index, especially the “Magnificent Seven” (like NVIDIA, Microsoft, Apple), are seeing robust earnings growth and strong investor demand for AI exposure. Global IT spending is projected to grow by over 9% in 2025, with AI spending up nearly 30% year-on-year.
Earnings Resilience 💪💰: Despite high interest rates and inflation, tech companies have adapted well, maintaining strong margins and growth. The sector is expected to remain a top performer through 2025.
Fed Policy & Rate Expectations 🏦🔮: Markets are increasingly pricing in a pause or even cuts in US interest rates later in 2025, which is bullish for growth stocks and tech-heavy indices like the NASDAQ 100.
Geopolitical & Macro Factors:
Reduced Uncertainty 🌏🕊️: The market has absorbed major geopolitical shocks (such as the Israel-Iran conflict and US-China trade tensions), and the resolution or de-escalation of these risks has reduced uncertainty, supporting risk assets.
US Election & Policy 🇺🇸🗳️: The outcome of the US election and expectations for stable or pro-business policies have also contributed to positive sentiment.
Global Supply Chains & Resilience 🌐🔗: While some risks remain (e.g., cyber threats, regulatory changes, and supply chain disruptions), the tech sector’s global reach and adaptability have helped it weather these challenges.
Why is it rallying now?
AI optimism and strong tech earnings are the main drivers 🤖💹.
Expectations of easier Fed policy and a resilient US economy are fueling risk appetite 🏦📈.
Geopolitical risks have eased or are being priced in, allowing investors to focus on growth 🌍🕊️.
Summary:
The NASDAQ 100’s rally is powered by AI-driven tech growth 🤖, resilient earnings 💪, and easing macro/geopolitical risks 🌏. The index remains a global leader as investors bet on the next wave of technology and digital innovation 🚀.

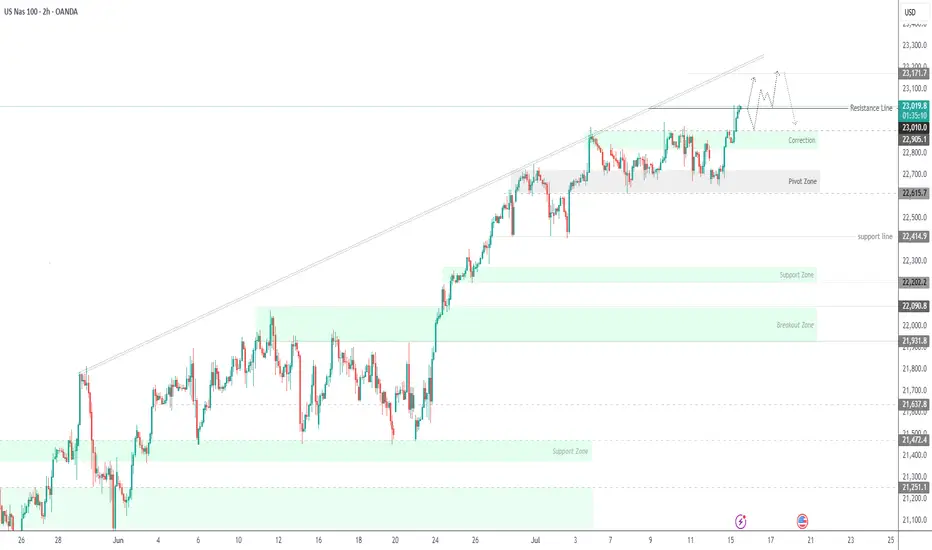
USNAS100 – Bearish Below 22900 as Earnings & Tariffs Hit MarketUSNAS100 – Bearish Bias Ahead of Earnings, PPI & Tariff Tensions
S&P 500 and Nasdaq futures are slightly lower as traders weigh rate outlook, tariff developments, and major earnings reports.
📊 Earnings in Focus:
Goldman Sachs NYSE:GS , Morgan Stanley NYSE:MS , and Bank of America NYSE:BAC are set to report today.
JPMorgan Chase NYSE:JPM and Citigroup NYSE:C posted strong results yesterday, but expressed caution over U.S. tariff policies.
🌍 Tariff Watch:
Trump announced a 19% tariff on Indonesian goods, with more deals anticipated ahead of the August 1 tariff deadline. The EU is reportedly preparing retaliatory measures if negotiations stall.
🔧 Technical Outlook:
The Nasdaq100 shows bearish momentum as long as it trades below 22900 and 23010, with potential downside targets:
Support: 22720 → 22615 → 22420
Resistance: 23010 → 23170
To shift back to a bullish trend, price must stabilize above 22900 and break 23010.
Key Events Today:
• Corporate Earnings
• Tariff Developments
• U.S. PPI Report
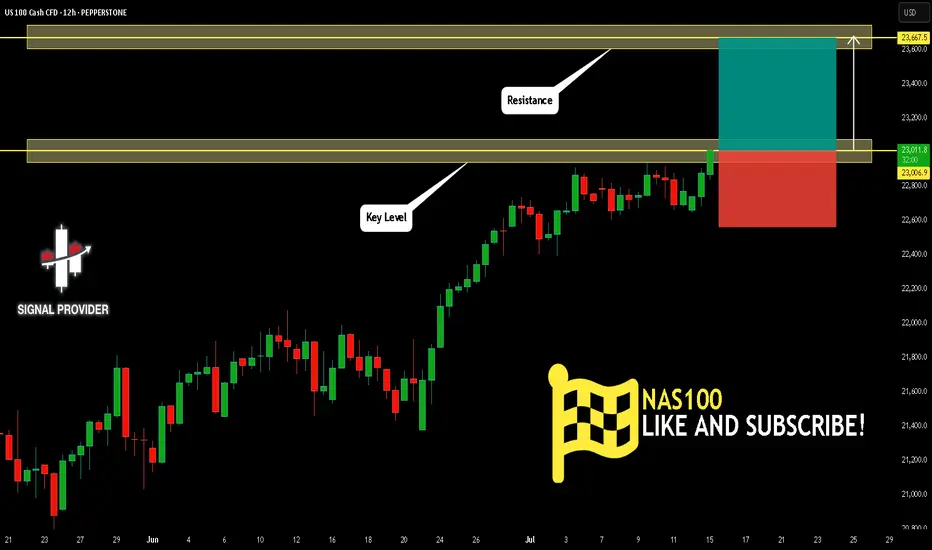
NAS100 Is Very Bullish! Long!
Take a look at our analysis for NAS100.
Time Frame: 12h
Current Trend: Bullish
Sentiment: Oversold (based on 7-period RSI)
Forecast: Bullish
The market is on a crucial zone of demand 23,006.9.
The oversold market condition in a combination with key structure gives us a relatively strong bullish signal with goal 23,667.5 level.
P.S
Overbought describes a period of time where there has been a significant and consistent upward move in price over a period of time without much pullback.
Disclosure: I am part of Trade Nation's Influencer program and receive a monthly fee for using their TradingView charts in my analysis.
Like and subscribe and comment my ideas if you enjoy them!
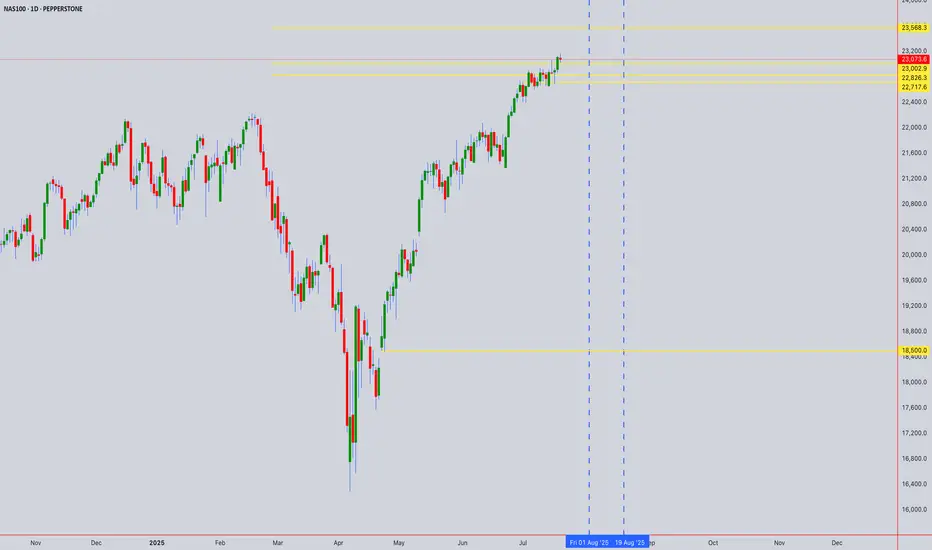
USNAS100 Outlook – CPI Data to Confirm Breakout or PullbackUSNAS100 – Bullish Momentum Holds Ahead of CPI
USNAS100 continues to show strong bullish momentum, trading above 22,905 and recently printing a new all-time high (ATH).
As long as price remains above this level, the next upside target is 23,170, followed by 23,300.
Market Focus – CPI Data Today:
• Expected: 2.6%
• Below 2.6% → bullish reaction likely
• Above 2.6% → bearish pressure expected
• Exactly 2.6% → could trigger a short-term bearish pullback
Key Risk Level:
A confirmed break below 22,905 would signal weakness and open the door for a correction toward 22,615.