NAS100 Forecast 24HAs of Tuesday, July 15, 2025, 2:03:11 AM UTC+4 the forecast for US100 (Nasdaq 100) in the next 24 hours presents a mixed outlook, with underlying bullish sentiment but caution due to ongoing market dynamics and potential for short-term pullbacks.
Factors Contributing to a Bullish Bias:
Underlying Strength and Breakout Behavior: Despite some short-term bearish technical signals, the Nasdaq is described as being in "breakout mode," decisively overriding key levels. This suggests underlying bullish momentum.
AI as a Growth Driver: Artificial intelligence (AI) remains a primary growth driver for the US economy and the technology sector, which heavily influences the Nasdaq 100. Confidence in secular tailwinds like cloud computing and semiconductor demand also persists .
Temporary US Dollar Weakness: The US Dollar Index (DXY) is currently in a retracement phase, pulling back after strength. A weaker dollar can provide a relief rally for risk assets like the Nasdaq, making US tech stocks more attractive to international investors.
Potential for Federal Reserve Rate Cuts: While no rate cuts are expected over the summer, a rate cut is considered likely in September. Historically, phases of moderate interest rate cuts in the absence of a recession have been positive for the US stock market.
"Buy on Dip" Mentality: Some analyses suggest that any short-term declines could be viewed as buying opportunities, indicating an underlying positive sentiment among investors.
Strong Earnings Expectations (for some tech): Despite general market concerns, some technology companies associated with AI innovation are expected to perform well, contributing positively to the index.
Factors Suggesting Caution and Potential for Bearish Movement/Volatility:
Escalating Trade Tensions (Trump's Tariffs): President Trump's continued aggressive protectionist stance and new tariff threats (e.g., against Canada) are a significant risk. These can create uncertainty, weigh on corporate profits, and lead to market volatility. This is frequently cited as the main risk for US indices.
Short-Term Technical Bearishness: Some technical analyses indicate a high chance of bearish candle closures across various timeframes (1H, 4H, Daily, Weekly, Monthly) , and some traders are eyeing selling opportunities from specific resistance zones (e.g., around 22,800-22,869).
Overvalued Growth Stocks: Following a recent rally, US stocks, particularly growth stocks, are trading at a premium to fair value. This can limit upside potential and make the market more susceptible to corrections if tariff negotiations falter or earnings guidance disappoints.
Market Seasonality: As we move into the latter half of July, market seasonality can shift from bullish to a more bearish stance.
Earnings Season and "Sell on the News" : While major financial institutions are kicking off Q2 earnings season, there's a potential for a "sell on the news" response, even if earnings aren't particularly bad, given the strong rally stocks have already staged.
Mixed Global Signals: European markets showing mixed performance and pressure from US futures suggest cautious global risk sentiment, which could cap upside for the Nasdaq.
Unfilled Stock Imbalances: Some technical analysis points to an unfilled stock imbalance around 22,300, which could act as a reaction point if the price pulls back.
Key Levels to Watch (Approximate):
Support: 22,600, 22,300 (unfilled imbalance), 21,611 (resistance-turned-support), 20,673 (Fibonacci extension and prior high).
Resistance: 22,800, 22,869, 23,000-23,100 (potential re-entry targets for rally continuation), 25,000-25,100 (approximate imbalance level to be filled).
In conclusion, for the next 24 hours, the US100 is likely to face a battle between underlying bullish momentum driven by AI and potential Fed policy, and the immediate headwinds of escalating trade tensions and some short-term technical bearishness. Traders should be prepared for volatility and quick shifts in sentiment based on news flow, particularly regarding trade and upcoming earnings reports.
For those interested in further developing their trading skills based on these types of analyses, consider exploring the mentoring program offered by Shunya Trade.
I welcome your feedback on this analysis, as it will inform and enhance my future work.
Regards,
Shunya Trade
⚠️ Disclaimer: This post is educational content and does not constitute investment advice, financial advice, or trading recommendations. The views expressed here are based on technical analysis and are shared solely for informational purposes. The stock market is subject to risks, including capital loss, and readers should exercise due diligence before investing. We do not take responsibility for decisions made based on this content. Consult a certified financial advisor for personalized guidance.
NASDAQ 100 CFD
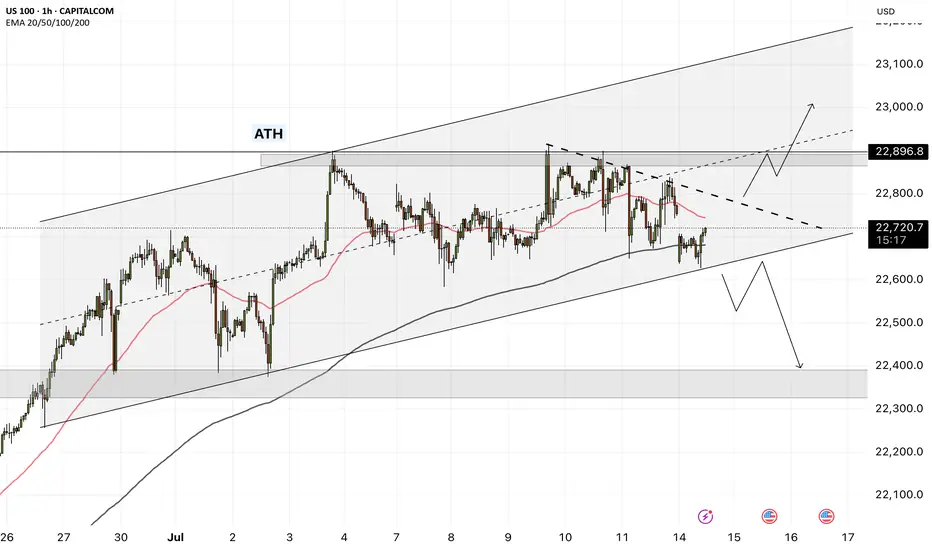
NAS100 - Stock market awaits inflation!The index is located between EMA200 and EMA50 on the one-hour timeframe and is trading in its ascending channel. Maintaining the ascending channel and confirming it after breaking the downtrend line will lead to the continuation of the Nasdaq's upward path to higher targets (23000), but in case of no increase and channel failure, one can look for selling positions up to the target of 22500.
Last week, the U.S.dollar demonstrated strong performance against major global currencies, despite having experienced some weakness since April 2, when President Donald Trump announced retaliatory tariffs against key U.S. trading partners. However, these tariffs were ultimately postponed, and only a baseline 10% tariff was maintained.
The 90-day deadline for implementing these tariffs, originally set to expire on Wednesday, has now been extended to August 1. Nevertheless, Trump surprised the markets this week by announcing a 25% tariff on imports from Japan and South Korea, threatening a 50% tariff on Brazilian goods, and implementing lower tariffs for other partners. These developments triggered a shift of capital toward the U.S. dollar as a safe-haven asset, boosting its strength.
This marks a notable shift in how the dollar is reacting to tariff tensions. In April, fears of an economic slowdown weighed on the greenback, but now it is gaining traction as a refuge in times of uncertainty, particularly as inflation risks mount—contributing to choppy moves in U.S. equity markets.
As is customary, the earnings season will kick off with reports from major banks and financial institutions. On Tuesday, JPMorgan is set to release its financial results, opening the floodgates for a wave of earnings reports. The image referenced lists several other companies, many of which are market heavyweights.
Following a relatively quiet week due to Independence Day holidays and a lack of major economic data, markets are now gearing up for a steady stream of reports in the coming days. Tuesday will bring the Consumer Price Index (CPI) for June along with the Empire State manufacturing survey. On Wednesday, the spotlight will shift to the Producer Price Index (PPI) for the same month. Then, on Thursday, traders will focus on June’s retail sales report, the Philadelphia Fed’s manufacturing survey, and the weekly jobless claims figures.
The week will conclude with two additional reports on Friday: the June housing starts data and the preliminary reading of the University of Michigan’s Consumer Sentiment Index.
June’s CPI report is expected to reflect an uptick in inflation, potentially driven by Trump’s tariff policies. Some analysts believe the tariffs will have an “undeniable” impact on prices, though others remain uncertain.
Despite concerns from both experts and consumers that businesses might pass tariff costs on to buyers, inflation has so far remained relatively moderate this year. The effects of Trump’s aggressive tariff campaign on hard economic data have not yet been clearly reflected—but that may be about to change.
According to Bloomberg’s consensus forecasts, as cited by Wells Fargo Securities, the CPI is expected to show a 2.7% year-over-year increase in June—up from 2.4% the previous month. Meanwhile, core CPI, which excludes volatile food and energy prices, is projected to have risen 3% over the same period, compared to a prior gain of 2.8%.
If these numbers come in as expected, it could support the forecasts of analysts who have warned that the costs of Trump’s heavy import tariffs would eventually show up on price tags, as manufacturers, importers, and retailers pass along the burden through the supply chain. Since taking office, Trump has imposed a wide array of tariffs, including a 10% levy on most imports, a 25% duty on foreign automobiles, and tariffs exceeding 50% on Chinese products.
US100 (Nasdaq 100) - Future Outlook (as of mid-July 2025)The US100, which is heavily concentrated in technology and growth companies, has been a significant driver of overall market performance in recent times. Its future trajectory is intricately linked to a combination of macroeconomic trends, corporate earnings, and evolving technological narratives.
Key Factors Shaping the Outlook:
Monetary Policy and Inflation Dynamics:
Cooling Inflation: If inflation continues to moderate (as indicated by CPI, PCE, and other economic data), central banks, particularly the U.S. Federal Reserve, will have more flexibility to consider easing monetary policy.
Interest Rate Expectations: Lower interest rates are generally a boon for growth stocks. They reduce the cost of borrowing for companies and increase the present value of their future earnings, which makes their (often higher) valuations more palatable. Conversely, any resurgence in inflation that forces a "higher for longer" interest rate stance could put significant downward pressure on the US100. As of mid-2025, the market has largely priced in the expectation of potential rate cuts later in 2025 or early 2026, but this remains highly data-dependent and subject to change with each new economic report.
C orporate Earnings and AI Enthusiasm:
Tech Earnings Season: The performance of the major tech titans within the Nasdaq 100 (e.g., Apple, Microsoft, Amazon, Google, Nvidia, Meta, Tesla) during their quarterly earnings reports will be critical. Continued strong earnings beats, particularly from companies that are leading the charge in Artificial Intelligence (AI), will reinforce investor confidence and support higher valuations.
Artificial Intelligence (AI) Narrative: The intense excitement and significant investment surrounding AI remain a powerful tailwind for the US100. Companies demonstrating clear pathways to monetize AI, or those establishing dominant positions in AI infrastructure and applications, are likely to continue seeing robust performance. However, any signs of the AI narrative losing steam, or a perception of an AI "bubble," could trigger profit-taking or a broader market correction.
Economic Growth and Consumer Behavior:
U.S. Economic Health: A resilient U.S. economy, characterized by healthy GDP growth and a strong labor market, provides a conducive environment for corporate revenues. A "soft landing" scenario (where inflation is tamed without triggering a recession) is the most favorable outcome for the US100.
Consumer Spending: Strong consumer confidence and sustained spending directly benefit sectors like e-commerce, software services, and consumer electronics, which are heavily represented in the Nasdaq 100.
Valuation Considerations:
While many Nasdaq 100 companies have delivered impressive earnings growth, their valuations (e.g., P/E ratios) are, for some, elevated compared to historical averages. This implies that there might be less margin for error in future earnings reports or unexpected shifts in the economic landscape. A "valuation reset" could occur if growth projections fail to materialize or if interest rates remain higher than currently anticipated.
Geopolitical and Global Factors:
Global Trade & Geopolitics: Ongoing global trade dynamics, geopolitical tensions (e.g., US-China relations, regional conflicts), and potential supply chain disruptions can introduce unforeseen volatility and impact global economic growth, which, in turn, affects the predominantly international-facing tech sector.
Overall Future Outlook (from a mid-July 2025 perspective):
The US100's future outlook appears cautiously optimistic, primarily driven by the enduring strength of underlying technology trends and the transformative potential of AI. The index has demonstrated remarkable resilience and continues to be favored by growth-oriented investors.
Upside Potential: Could be fueled by sustained strong earnings from its tech giants, especially those leading in AI, coupled with clear indications of forthcoming interest rate cuts.
Downside Risks: The index remains highly susceptible to shifts in interest rate expectations (e.g., if inflation proves stickier than anticipated), any disappointments in high-profile tech earnings, or a broader economic downturn. Given its concentration in high-growth, high-beta stocks, the US100 is prone to more significant fluctuations in both upward and downward market moves compared to broader, more diversified indices.
Investors and traders will be closely monitoring key economic data (inflation, employment), central bank communications, and the performance of bellwether tech companies for crucial clues about the index's direction.
⚠️ Disclaimer: This post is educational content and does not constitute investment advice, financial advice, or trading recommendations. The views expressed here are based on technical analysis and are shared solely for informational purposes. The stock market is subject to risks, including capital loss, and readers should exercise due diligence before investing. We do not take responsibility for decisions made based on this content. Consult a certified financial advisor for personalized guidance
For those interested in further developing their trading skills based on these types of analyses, consider exploring the mentoring program offered by Shunya Trade.
I welcome your feedback on this analysis, as it will inform and enhance my future work
NAS100 Nasdaq Range-Bound: What Traders Should Watch Next US100I'm currently keeping a close eye on the Nasdaq 🧠📊, which is trading within a range-bound structure 📉📈. While we’re seeing some bullish momentum on the NAS100 4-hour chart today ⏱️📈, it’s nothing particularly strong or decisive just yet. I’m waiting for a clear break 🔓 either above or below this current range before considering any trading opportunities 🎯.
In this US100 chart 🖼️, I’ve highlighted key components such as price action, market structure, the prevailing trend, and other important elements of technical analysis 🧩📐.
⚠️ Please remember: this is a market analysis and reflects my personal opinion — not a trade recommendation. Always do your own due diligence 🕵️♂️ before making any trading decisions. This is not financial advice.

NASDAQ Potential DownsidesHey Traders, in today's trading we are monitoring NAS100 for a selling opportunity around 22,800 zone, NASDAQ is trading in a downtrend and currently is in a correction phase in which it is approaching the trend at 22,800 support and resistance area.
Trade safe, Joe.
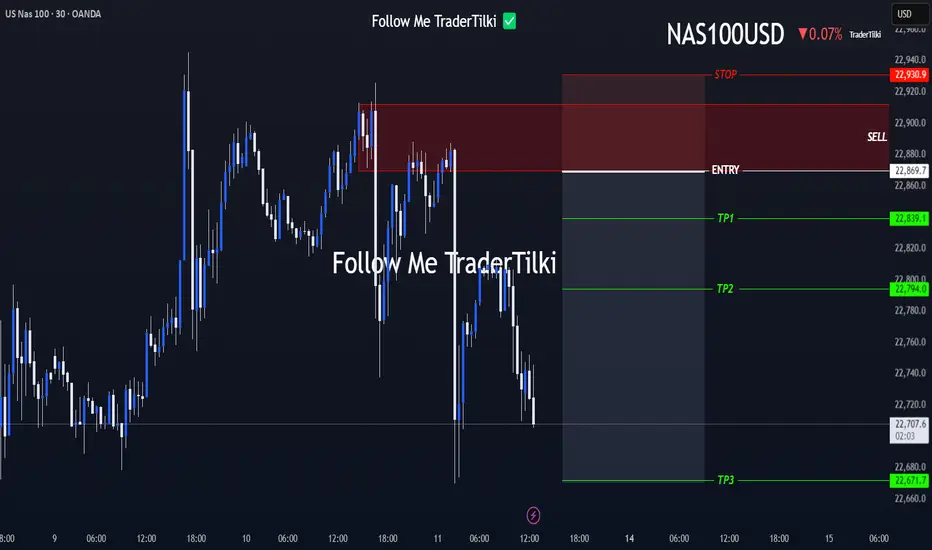
NAS100 Setup Locked In — Ride the Drop from the Order Block!Hey Guys,
I'm planning a sell trade on the NAS100 index from a designated order block. Once price reaches the sell zone, the position will be activated.
📍 Trade Details:
- 🟢 Entry Level: 22,869
- 🔴 Stop Loss: 22,930
- 🎯 TP1 – First Target: 22,839
- 🎯 TP2 – Second Target: 22,794
- 🎯 TP3 – Final Target: 22,671
📐 Risk-to-Reward Ratio: 3.24
Your likes and support are what keep me motivated to share these analyses consistently.
Huge thanks to everyone who shows love and appreciation! 🙏
NASDAQ: Time For A Pullback?In this Weekly Market Forecast, we will analyze the NASDAQ for the week of July 14 - 18th.
The NASDAQ had a strong week, until Tariff Tensions Friday arrived.
This by itself doesn't mean we should start looking for sells. Just like the S&P 500, I'm expecting short term bearishness, as price goes from ERL to IRL.
With Tuesday CPI Data coming, this short term consolidation is to be expected until the news is announced.
Let the markets pick a direction, and flow with it.
Have a plan of action in place so you can react to the price action promptly!
Enjoy!
May profits be upon you.
Leave any questions or comments in the comment section.
I appreciate any feedback from my viewers!
Like and/or subscribe if you want more accurate analysis.
Thank you so much!
Disclaimer:
I do not provide personal investment advice and I am not a qualified licensed investment advisor.
All information found here, including any ideas, opinions, views, predictions, forecasts, commentaries, suggestions, expressed or implied herein, are for informational, entertainment or educational purposes only and should not be construed as personal investment advice. While the information provided is believed to be accurate, it may include errors or inaccuracies.
I will not and cannot be held liable for any actions you take as a result of anything you read here.
Conduct your own due diligence, or consult a licensed financial advisor or broker before making any and all investment decisions. Any investments, trades, speculations, or decisions made on the basis of any information found on this channel, expressed or implied herein, are committed at your own risk, financial or otherwise.

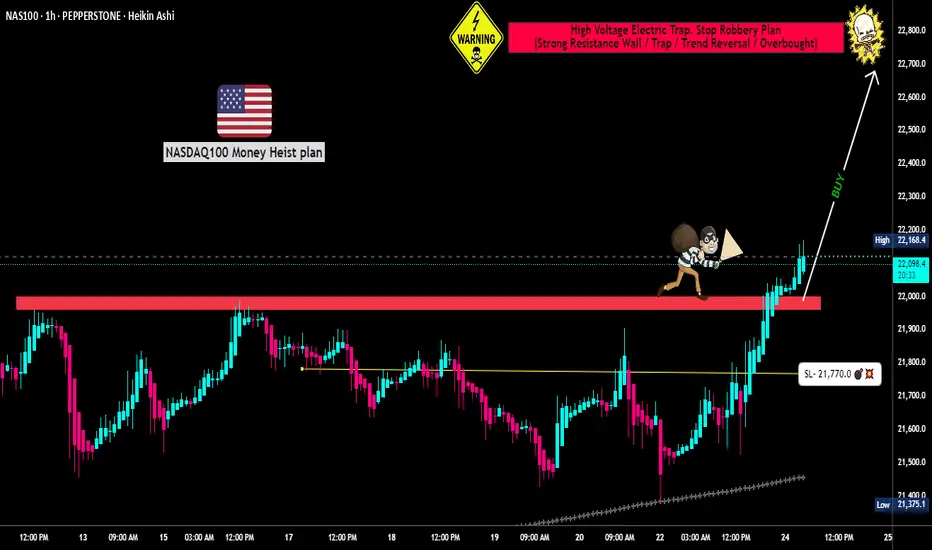
"NASDAQ 100: THE TECH ROBBERY! – Quick Profits Before Reversal?"🔥 "The NDX NASDAQ 100 INDEX Heist: Bullish Loot & Escape Before the Trap!" 🔥
🌟 Hi! Hola! Ola! Bonjour! Hallo! Marhaba! 🌟
Dear Money Makers & Market Robbers, 🤑💰💸✈️
Based on the 🔥Thief Trading Style🔥 (technical + fundamental analysis), here’s our master plan to heist the NDX - NASDAQ 100 INDEX. Follow the strategy on the chart—long entry is the play! Aim to escape near the high-risk RED Zone (overbought, consolidation, potential reversal). The bears are lurking, so take profits and treat yourself—you’ve earned it! 💪🏆🎉
🚀Entry (The Vault is Open!)
"Swipe the bullish loot at any price!"
For precision, place buy limit orders within 15-30min timeframe (recent swing lows/highs).
Set alerts! Don’t miss the heist.
🛑 Stop Loss (Safety Net)
Thief-style SL at nearest swing low (4H timeframe) → 21,770.00 (adjust based on risk/lot size).
🏴☠️ Target 🎯: 22,800.00
Bullish momentum is fueling this heist—ride the wave but exit before the trap!
📰 Fundamental Backing (Why This Heist Works)
Macroeconomic trends, COT data, geopolitics, and sentiment align for bullish moves.
Full analysis? Check 👉🔗🌎
⚠️ Trading Alerts (News & Risk Mgmt)
Avoid new trades during high-impact news (volatility = danger).
Use trailing stops to lock profits and dodge sudden reversals.
💥 Boost This Heist!
Hit 👍 (Boost Button) to strengthen our robbery squad!
More heists = More profits—stay tuned for the next steal! 🚀🤑
See you soon, fellow thieves! 🤝🎉
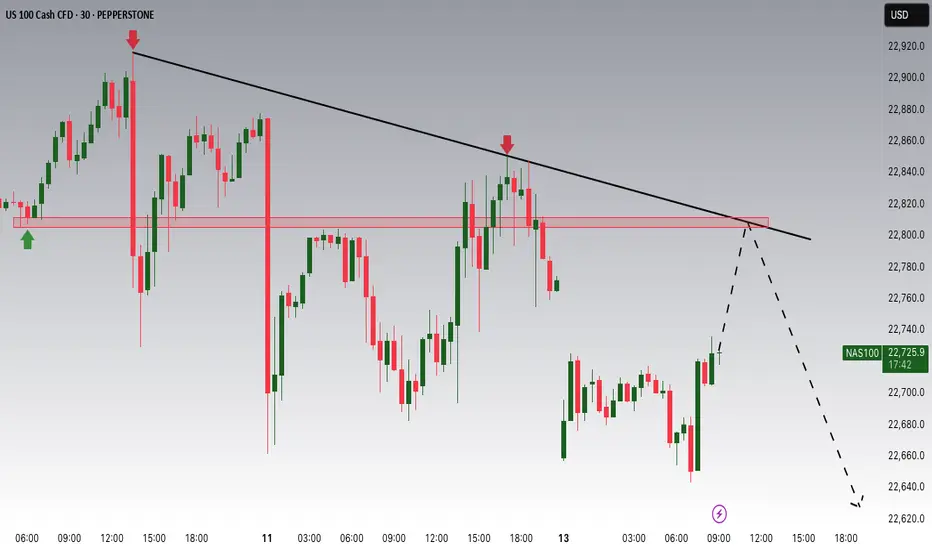
Bearish Momentum Builds Below pivot zone USNAS100 Analysis
Price has reversed from its ATH and now shows bearish momentum.
Below 22705, downside targets are 22615 and 22420.
Bullish scenario only valid if price breaks and holds above 22815.
Pivot: 22710
Support: 22615, 22420
Resistance: 22815, 22910
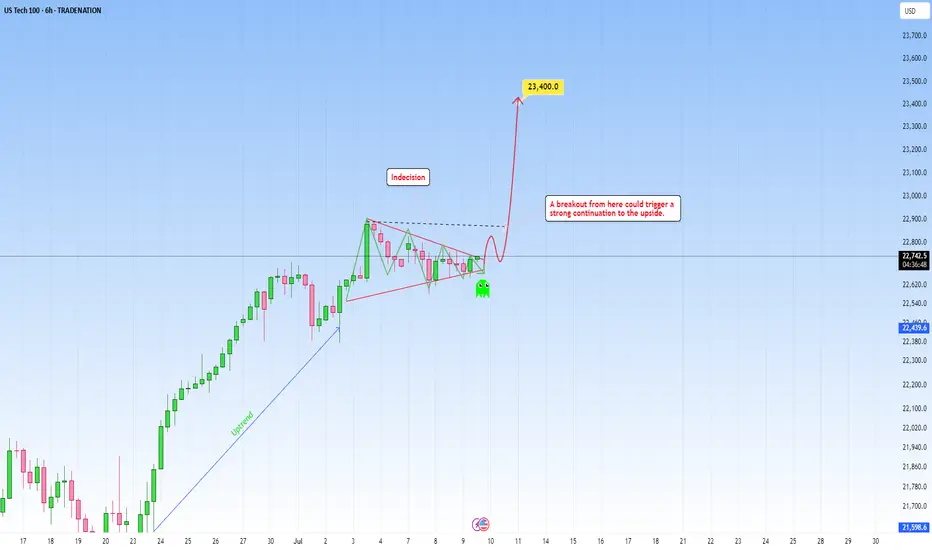
One last squeeze and NAS100 could explode into the next rallyThe NAS100 is currently coiling within a tight consolidation range, showing signs of tension building up. After a strong push upward, price has been moving sideways in a narrowing structure. This build-up around the high, a compression of buyers and sellers in a low-volatility squeeze could be an indication that we could use. This kind of price action typically signals that buyers are gaining control, squeezing out sellers with each dip.
The lack of deep pullbacks combined with increasingly shallow sell-offs shows fading bearish momentum. Which is often typical during a buildup phase before a breakout. If buyers can push price above with a strong close, it could trigger breakout momentum and lead to a continuation of the larger bullish trend.
Ideally, if price reacts positively and forms bullish confirmation, it would set up a solid continuation entry, with upside potential toward the next target of 23.400.
Until then, bulls are watching closely for signs of commitment. The breakout is yet to be confirmed, but the squeeze is on, and the pressure is building.
What will happen next?
Just sharing my thoughts for the charts, this isn’t financial advice. Always confirm your setups and manage your risk properly.
Disclosure: I am part of Trade Nation's Influencer program and receive a monthly fee for using their TradingView charts in my analysis.
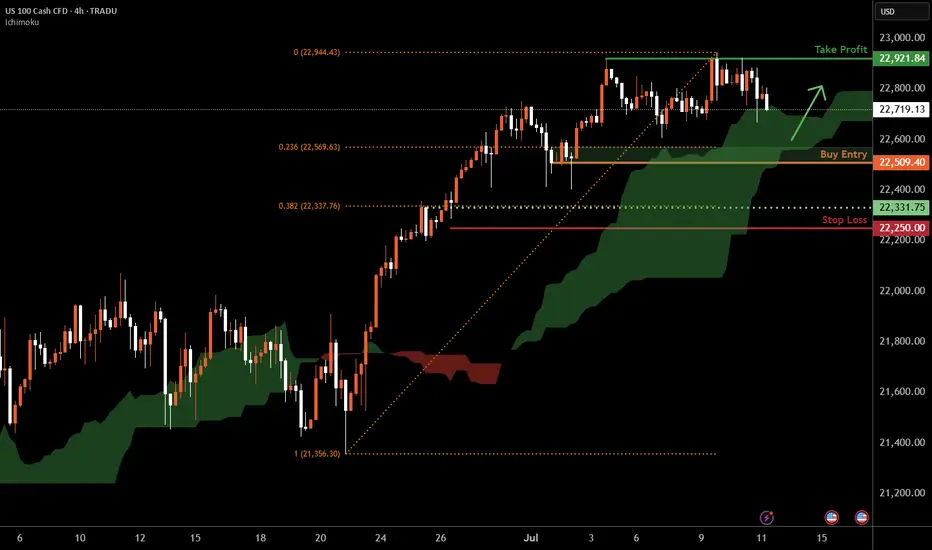
Nasdaq-100 H4 | Swing-low support at 23.6% Fibonacci retracementThe Nasdaq-100 (NAS100) is falling towards a swing-low support and could potentially bounce off this level to climb higher.
Buy entry is at 22,509.40 which is a swing-low support that aligns closely with the 23.6% Fibonacci retracement.
Stop loss is at 22,250.00 which is a level that lies underneath a pullback support and the 38.2% Fibonacci retracement.
Take profit is at 22,921.84 which is a multi-swing-high resistance.
High Risk Investment Warning
Trading Forex/CFDs on margin carries a high level of risk and may not be suitable for all investors. Leverage can work against you.
Stratos Markets Limited (tradu.com ):
CFDs are complex instruments and come with a high risk of losing money rapidly due to leverage. 63% of retail investor accounts lose money when trading CFDs with this provider. You should consider whether you understand how CFDs work and whether you can afford to take the high risk of losing your money.
Stratos Europe Ltd (tradu.com ):
CFDs are complex instruments and come with a high risk of losing money rapidly due to leverage. 63% of retail investor accounts lose money when trading CFDs with this provider. You should consider whether you understand how CFDs work and whether you can afford to take the high risk of losing your money.
Stratos Global LLC (tradu.com ):
Losses can exceed deposits.
Please be advised that the information presented on TradingView is provided to Tradu (‘Company’, ‘we’) by a third-party provider (‘TFA Global Pte Ltd’). Please be reminded that you are solely responsible for the trading decisions on your account. There is a very high degree of risk involved in trading. Any information and/or content is intended entirely for research, educational and informational purposes only and does not constitute investment or consultation advice or investment strategy. The information is not tailored to the investment needs of any specific person and therefore does not involve a consideration of any of the investment objectives, financial situation or needs of any viewer that may receive it. Kindly also note that past performance is not a reliable indicator of future results. Actual results may differ materially from those anticipated in forward-looking or past performance statements. We assume no liability as to the accuracy or completeness of any of the information and/or content provided herein and the Company cannot be held responsible for any omission, mistake nor for any loss or damage including without limitation to any loss of profit which may arise from reliance on any information supplied by TFA Global Pte Ltd.
The speaker(s) is neither an employee, agent nor representative of Tradu and is therefore acting independently. The opinions given are their own, constitute general market commentary, and do not constitute the opinion or advice of Tradu or any form of personal or investment advice. Tradu neither endorses nor guarantees offerings of third-party speakers, nor is Tradu responsible for the content, veracity or opinions of third-party speakers, presenters or participants.
Nasdaq 100 Dips as Tariffs Spark CautionWhile crypto markets rally, U.S. equities have cooled. The Nasdaq 100 dropped by 0.6% following the announcement of new tariffs, particularly those aimed at Canadian goods. Tech stocks are reacting cautiously to these developments, although Nvidia’s record-breaking $4 trillion market cap continues to provide some support for the index.
With major financials such as JPMorgan and Wells Fargo reporting Q2 earnings next week, investors will soon get clarity on how corporate America is coping with higher input costs and global trade tensions.
Technical View (Nasdaq 100):
The index is consolidating between resistance at 22,900 and support at 22,600. A break above 22,900 could reignite the tech rally, while a drop below support may see price test 22,400 and potentially 22,000 in coming sessions.
NAS100 (Cash100) Double Top H8Potential short on NAS100.
Risk/reward = 5.4.
Entry = 22 956
Stop loss = 23 059
TP level 1 = 22 473 (50% of position)
T level 2 = 22 303 (50% of position)
RSI divergence.
Waiting for closure of current H8 candle to close in range.
Looking for lower volume on H8 closure, however, will make exception id higher since top 1 was on Thursday the 3rd and markets closed early.
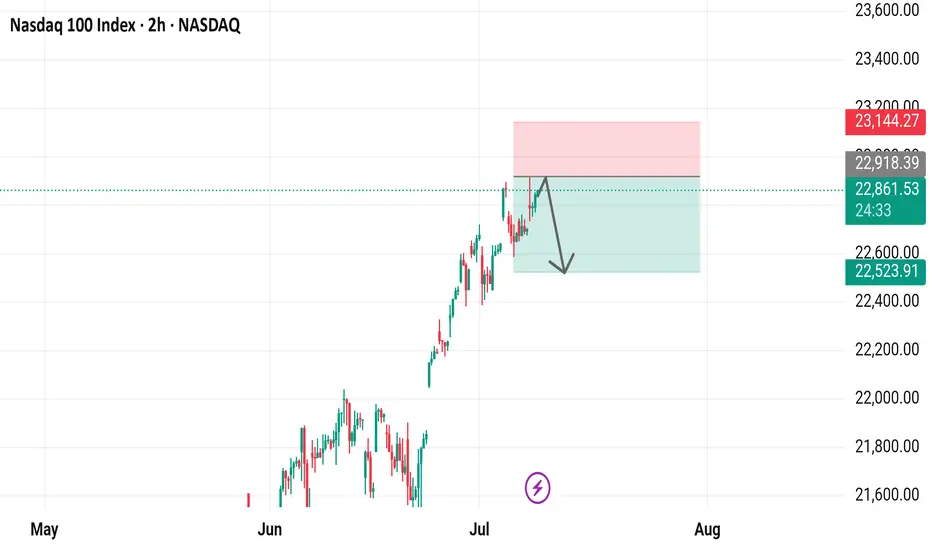
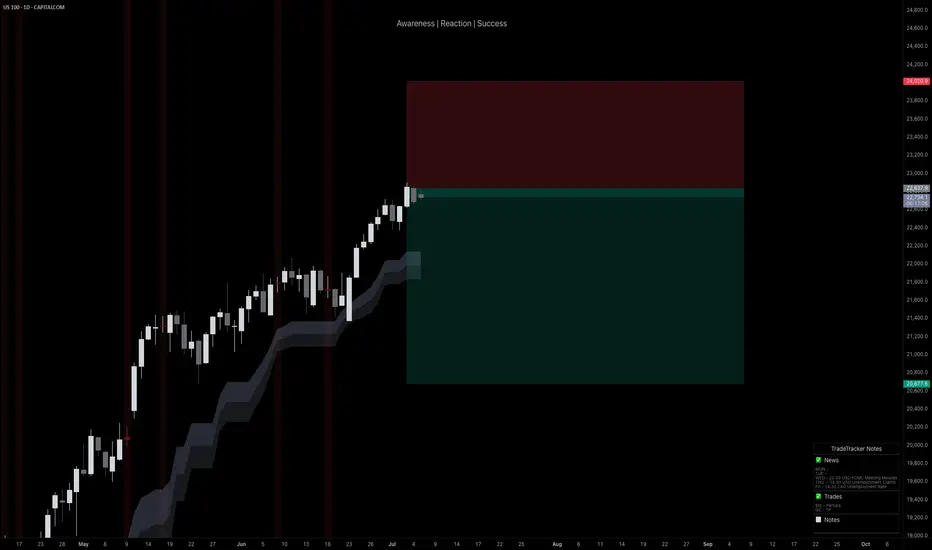
Nasdaq 100 Index 2-Hour Chart Analysis2-hour candlestick chart for the Nasdaq 100 Index (NDX) on the NASDAQ exchange. The chart spans from May to August, showcasing a significant upward trend with notable fluctuations. Key indicators include a recent price of 22,861.53, representing a 0.72% increase. The chart features technical analysis elements such as support and resistance levels, highlighted by green and red boxes, and a downward arrow suggesting a potential price movement.
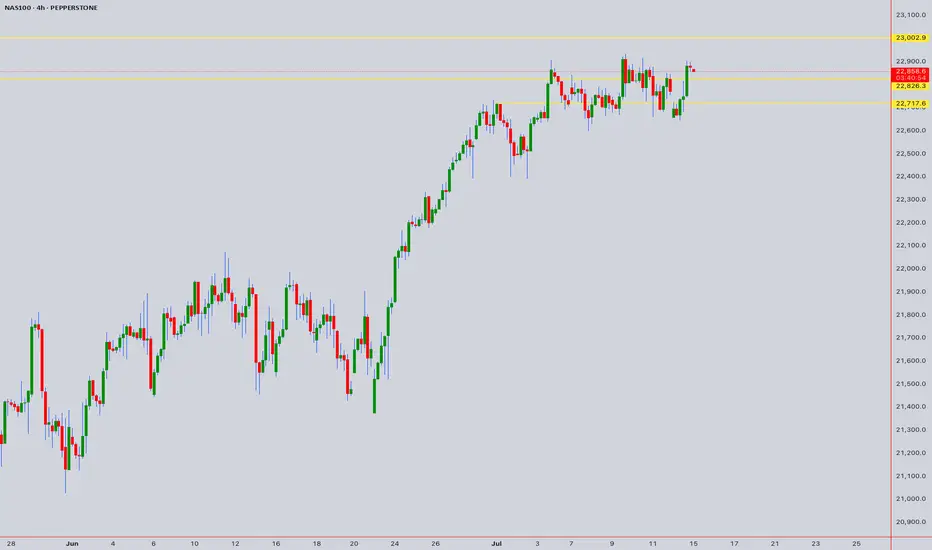
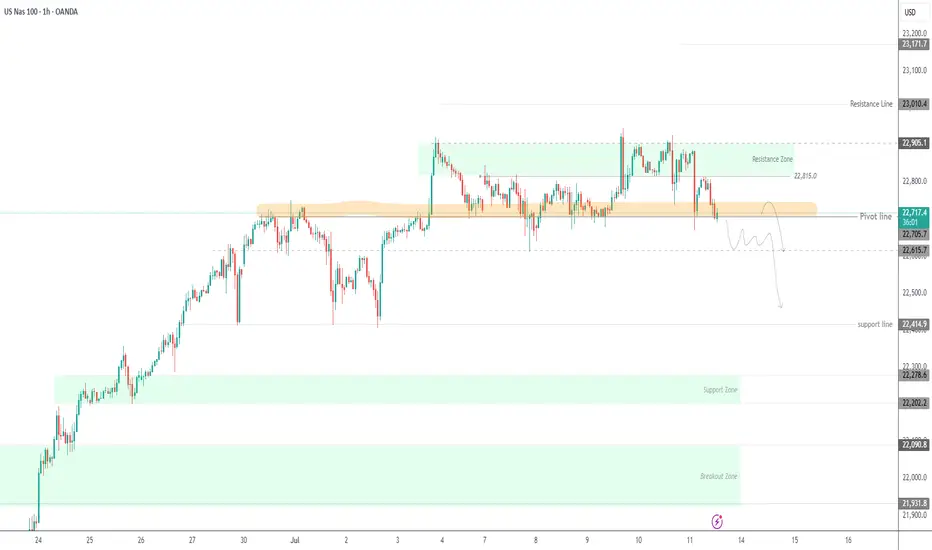
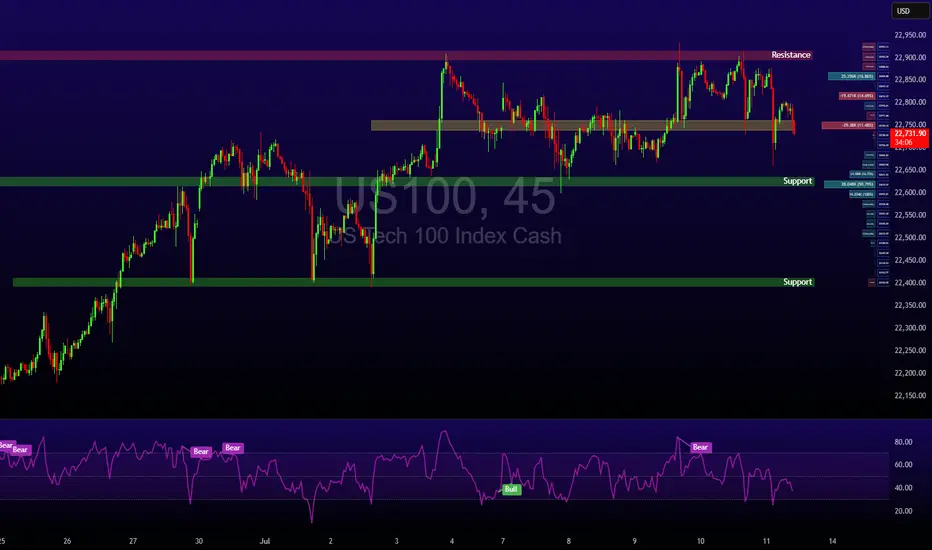
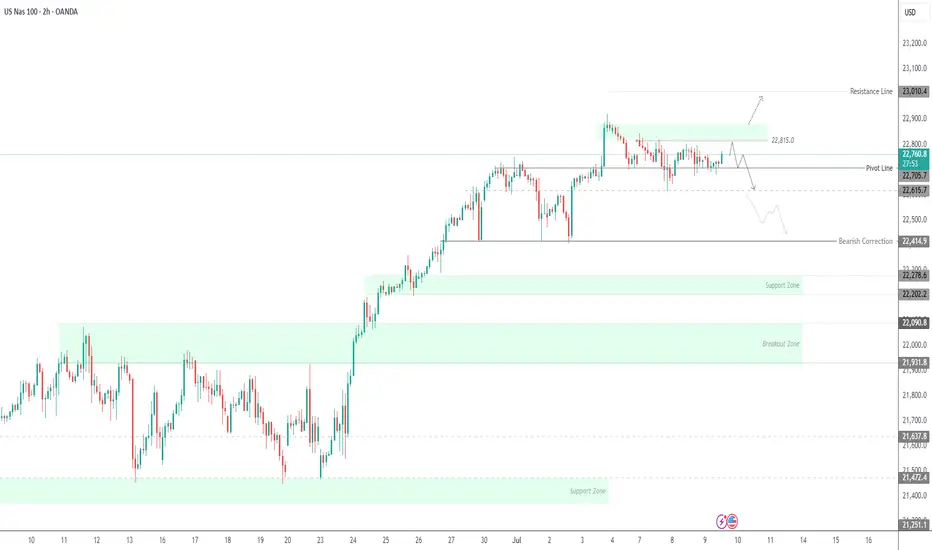
USNAS100 Consolidates Between 22815–22705 | Breakout Will DefineUSNAS100 – Technical Outlook
The NASDAQ remains under pressure amid ongoing tariff uncertainty, with traders closely watching for any progress in negotiations or signs of escalation.
Currently, the price is consolidating between 22815 and 22705, awaiting a breakout to define the next directional move.
A 1H candle close below 22705 would confirm bearish continuation, targeting 22600, with further downside potential toward 22420.
A break above 22815 would shift momentum bullish, opening the way to 22880, followed by 23010.
Key Levels:
Support: 22600 / 22420
Resistance: 22815 / 22880 / 23010
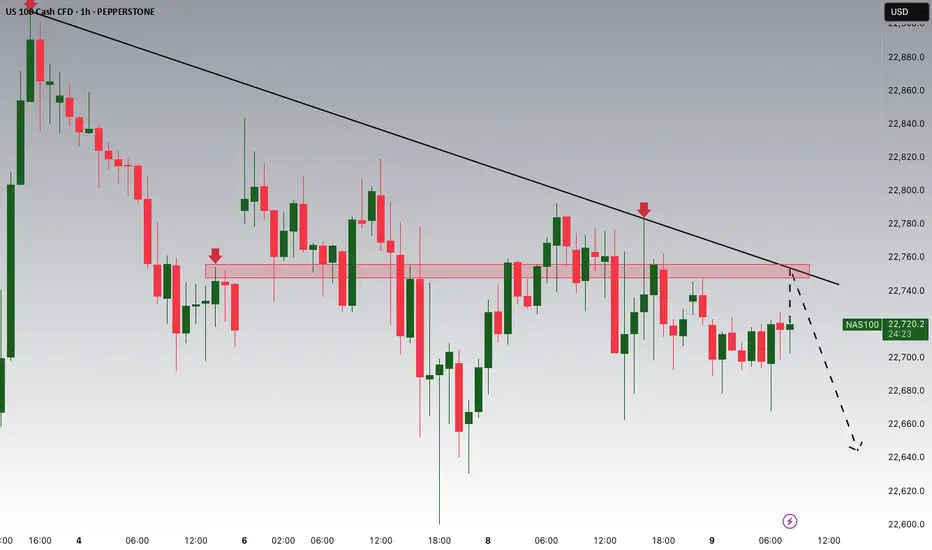
NASDAQ Potential DownsidesHey Traders, in today's trading session we are monitoring NAS100 for a selling opportunity around 22,750 zone, NASDAQ is trading in a downtrend and currently is in a correction phase in which it is approaching the trend at 22,750 support and resistance area.
Trade safe, Joe.
Watch me trade NQ LIVE!This is a just a quick video showing what I look for in order to take a trade.
I entered a short on NQ minutes ago, looking for 2.44 RR!
Apologies for this rough cut video. It was spur of the moment, and I wanted to share with my followers and viewers!
Enjoy!
May profits be upon you.
Leave any questions or comments in the comment section.
I appreciate any feedback from my viewers!
Like and/or subscribe if you want more accurate analysis.
Thank you so much!
Disclaimer:
I do not provide personal investment advice and I am not a qualified licensed investment advisor.
All information found here, including any ideas, opinions, views, predictions, forecasts, commentaries, suggestions, expressed or implied herein, are for informational, entertainment or educational purposes only and should not be construed as personal investment advice. While the information provided is believed to be accurate, it may include errors or inaccuracies.
I will not and cannot be held liable for any actions you take as a result of anything you read here.
Conduct your own due diligence, or consult a licensed financial advisor or broker before making any and all investment decisions. Any investments, trades, speculations, or decisions made on the basis of any information found on this channel, expressed or implied herein, are committed at your own risk, financial or otherwise.

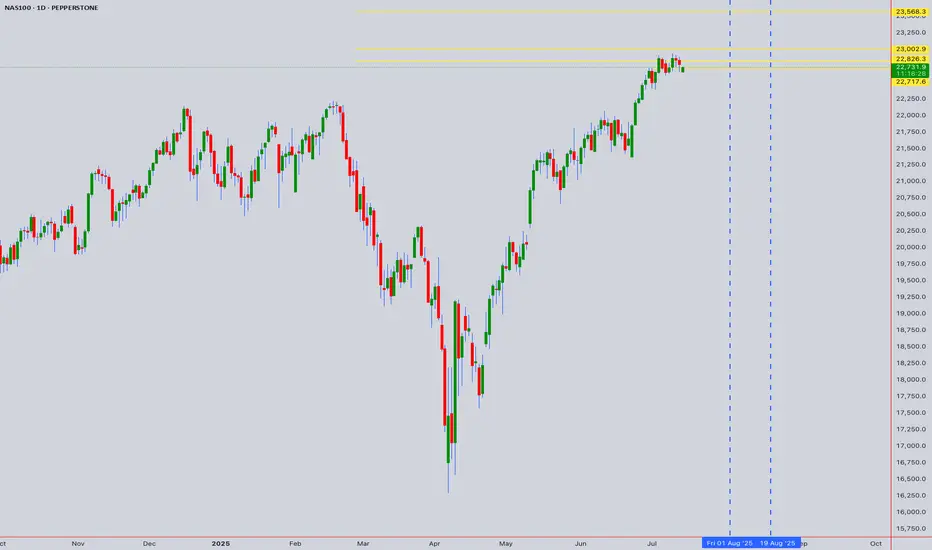
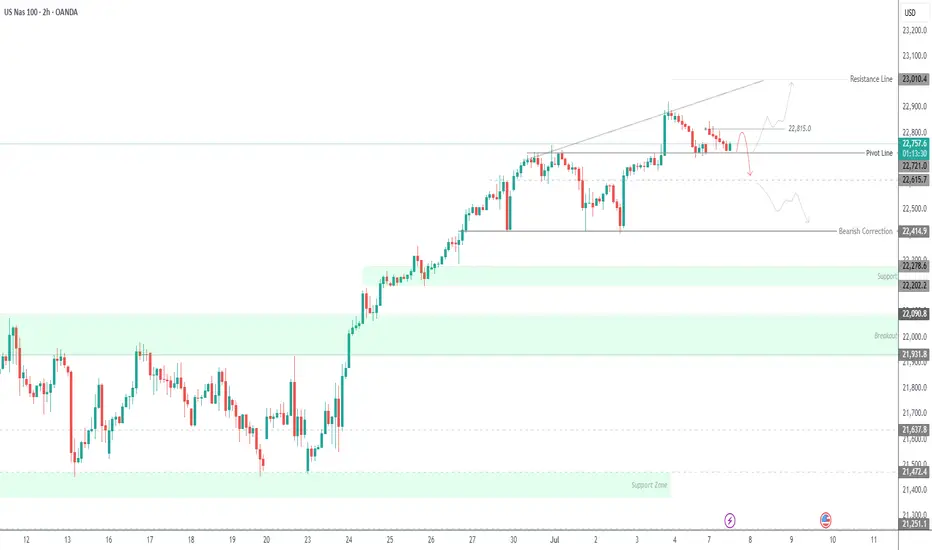
NASDAQ Bulls Defend Pivot – Can 23,000 Break Next?USNAS100
The Nasdaq 100 is currently holding above the pivotal 22,720 level, supported by market optimism amid recent tariff-related developments from the White House.
Bullish Scenario:
Sustained price action above 22,720 keeps bullish momentum intact. A break and 1H close above 22,815 would confirm strength, opening the path toward the psychological milestone and potential all-time high at 23,000.
Bearish Breakdown:
A 1H or 4H close below 22,720 would invalidate the bullish bias and strengthen downside pressure, with initial support seen at 22,615 and deeper correction likely toward 22,420.
Key Technical Levels:
• Resistance: 22,815 · 23,000
• Support: 22,615 · 22,420
NAS100 Reading Market Structure: When to Trade and When to WaitI'm currently keeping a close eye on the NASDAQ 📉. Price has remained largely range-bound over the past few sessions and continues to show signs of pressure 🔻. While we've seen a short-term rally 🚀, it lacks the conviction and momentum typically seen in stronger trending environments 📊.
When comparing the current conditions to previous trend phases, the difference is clear. Structure is unclear, and there's no confirmation of sustained direction yet. As shown on the chart 📈, we previously saw strong bullish momentum followed by a sharp shift, suggesting indecision in the market 🤔.
In these situations, patience is key ⏳. It's just as important to know when not to trade as it is to know when to act 🎯. For now, I’m choosing to stay on the sidelines until a clearer trend develops.
Not financial advice ⚠️

NASDAQ After the Fireworks: Bearish Setup LoadedAfter the classic 4th of July rally, I stepped in on the short side of Nasdaq, targeting 22,000 and 21,400 zones. The market structure shows exhaustion, and with the cloud retest failing to hold new highs, I positioned accordingly.
Technical:
• Price stalled at prior expansion highs with tight compression near 23,000.
• Daily FibCloud offered resistance confirmation.
• Bearish risk-reward skew forms after extended rally and thin retraces.
• Volume divergence spotted.
Fundamentals:
Multiple overlapping uncertainties:
• Trump confirmed tariffs will take effect on August 1, threatening a 10% surcharge on BRICS-aligned nations.
• Treasury Secretary Bessent anticipates several trade deal announcements within 48h—but stresses quality over quantity.
• Bank of America maintains its base case of 0 rate cuts in 2025, citing strong economic data and sticky inflation risks.
The combination of tariff escalation, hawkish monetary expectations, and global trade friction creates a perfect backdrop for volatility and correction—especially in overextended tech indices like the Nasdaq.
Note: Please remember to adjust this trade idea according to your individual trading conditions, including position size, broker-specific price variations, and any relevant external factors. Every trader’s situation is unique, so it’s crucial to tailor your approach to your own risk tolerance and market environment.
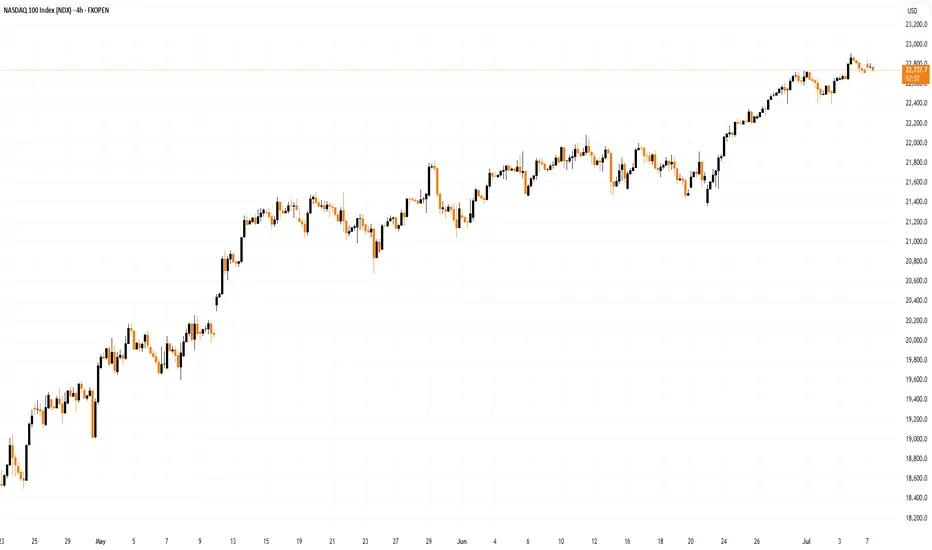
Nasdaq 100: Bearish Signals Near the All-Time HighNasdaq 100: Bearish Signals Near the All-Time High
As the 4-hour chart of the Nasdaq 100 (US Tech 100 mini on FXOpen) shows, the index reached a new all-time high last week. However, the price action suggests that the current pace of growth may not last.
Last week’s strong labour market data triggered a significant bullish impulse. However, the upward momentum has been entirely retraced (as indicated by the arrows).
The tax cut bill signed on Friday, 4 July, by Trump — which is expected to lead to a significant increase in US government debt — contributed to a modest bullish gap at today’s market open. Yet, as trading progressed during the Asian session, the index declined.
This suggests that fundamental news, which could have served as bullish catalysts, are failing to generate sustainable upward movement — a bearish sign.
Further grounds for doubt regarding the index's continued growth are provided by technical analysis of the Nasdaq 100 (US Tech 100 mini on FXOpen) chart, specifically:
→ a bearish divergence on the RSI indicator;
→ price proximity to the upper boundary of the ascending channel, which is considered resistance.
It is reasonable to suggest that the market may be overheated and that bullish momentum is waning. Consequently, a correction may be forming — potentially involving a test of the 22,100 level. This level acted as resistance from late 2024 until it was broken by strong bullish momentum in late June.
This article represents the opinion of the Companies operating under the FXOpen brand only. It is not to be construed as an offer, solicitation, or recommendation with respect to products and services provided by the Companies operating under the FXOpen brand, nor is it to be considered financial advice.
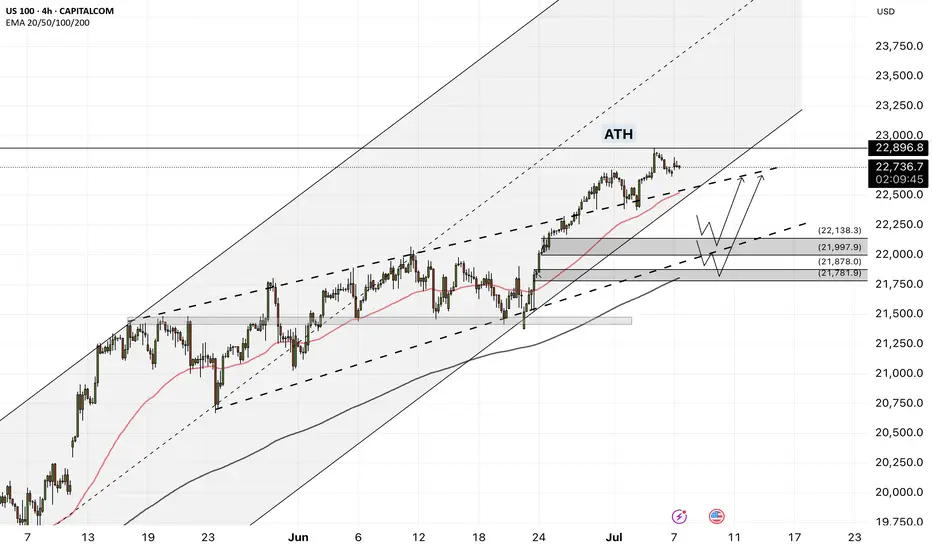
NAS100 - Stock market is waiting for tariffs!The index is above the EMA200 and EMA50 on the four-hour timeframe and is trading in its ascending channel. Maintaining the ascending channel will lead to the continuation of the Nasdaq's upward path to higher targets, but if it does not rise and corrects towards the demand limits, you can buy the Nasdaq index with appropriate reward and risk.
Three months ago, Donald Trump postponed the imposition of severe retaliatory tariffs, granting America’s major trading partners more time to reach new agreements that Washington views as “fairer.” Now, as the White House’s July 9 deadline approaches, only two official trade deals have been finalized—one with the United Kingdom and another with Vietnam. As for China, merely a fragile temporary truce has been reached, which has so far prevented any additional tariffs from being enforced.
Although reports suggest promising progress in negotiations with India, Japan, and South Korea, no final agreements have been secured with these countries yet. Interestingly, talks with the European Union—which had previously stalled—have suddenly taken a positive turn, and prospects for a deal with Canada in the coming days have also improved.
However, given the limited time left, it seems unlikely that trade agreements with all of America’s 18 key partners will be reached before the deadline. This situation has raised a critical question for the markets: Will Trump set a new deadline for the remaining countries, or will the suspended tariffs be reinstated?
The prevailing view is that the U.S. president will once again resort to threats before granting any extensions—this time not merely by reviving the “Liberation Day” tariffs, but also by promising even heavier tariffs to extract the last concessions from the remaining trade partners.
U.S. Treasury Secretary Scott Bassett stated that if no agreements are reached by August 1, tariffs will revert to the levels announced in April. He also emphasized that Washington’s core strategy in these trade talks is to apply maximum pressure. According to Bassett, letters will be sent to various countries, outlining the August 1 deadline for reaching deals. This news, which broke during the market’s closing hours, sparked a wave of risk appetite in the financial markets.
In a week when the U.S. economic calendar is notably devoid of major data releases, investors are focusing their attention on the minutes from the Federal Reserve’s June FOMC meeting—a document that could offer fresh insights into the trajectory of interest rates for the second half of the year.
June’s strong employment report, which exceeded market expectations, has effectively dashed hopes for an interest rate cut this month. Now, if the positive economic momentum persists, the likelihood of a rate cut in the September meeting may also gradually be priced out by the markets.
According to data from Challenger, Gray & Christmas, U.S. employers announced 47,999 job cuts in June, marking a sharp decline from 93,816 in the previous month. Compared to June of last year, layoffs have dropped by 2%. However, total job cuts in the second quarter of 2025 reached 247,256—a 39% increase from the same period last year (177,391) and the highest second-quarter layoff figure since 2020.
With no significant economic reports scheduled for the coming days, investors will be closely analyzing Wednesday night’s Fed minutes and the limited remarks from central bank officials—statements where every word has the potential to significantly move the markets.
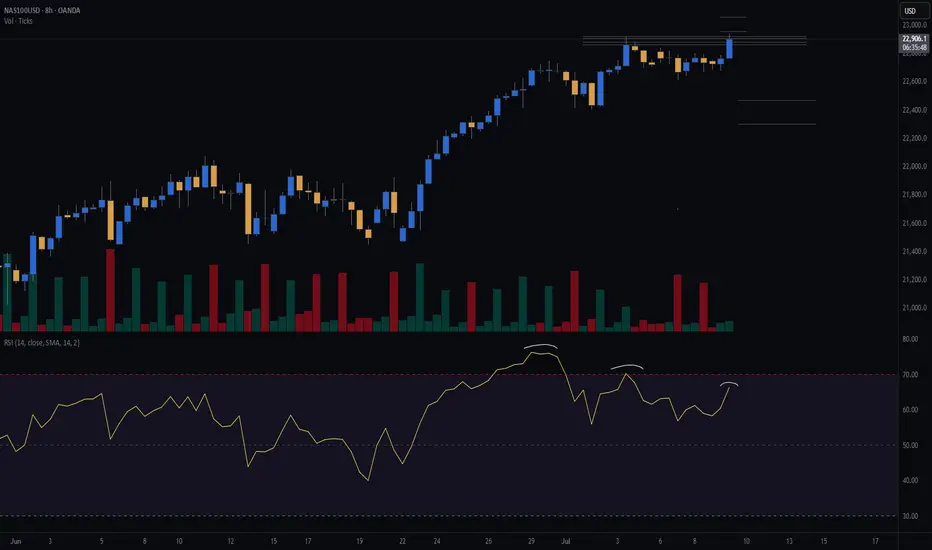
Nasdaq Approaches 23,000 Mark for the First TimeOver the past five trading sessions, the U.S. Nasdaq index has posted a gain of more than 1.5%, supported by a recent rise in market confidence that has pushed the equity index to new all-time highs. The NFP employment data released yesterday surprised markets with 147,000 new jobs, compared to the 111,000 expected, reflecting a recovery in the labor market that could ultimately support domestic consumption in the U.S.. This has helped maintain investor confidence in equities, supporting a bullish bias in the Nasdaq in recent sessions.
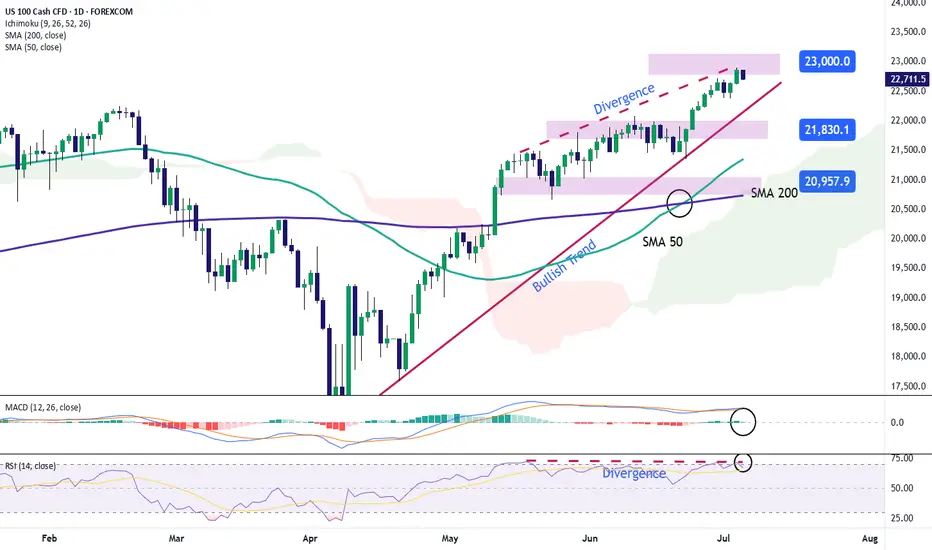
Sustained Uptrend
Since the early days of April, the Nasdaq has maintained a solid upward trend, with no relevant signs of selling pressure that would threaten the current bullish structure. As a result, the long-term bias remains clearly bullish within the broader market outlook. However, it's worth noting that a growing sense of indecision has emerged in recent sessions, reflected in the candlestick patterns, which could open the door to short-term bearish corrections.
Technical Indicators
MACD: The MACD histogram continues to hover around the neutral zero line, indicating a balance in moving average strength during recent sessions. If this pattern continues, it may result in a more defined period of price neutrality in the short term.
RSI: The presence of consistent RSI highs, alongside higher price highs in the Nasdaq, has led to the formation of a bearish divergence. This suggests that market equilibrium has been affected by recent bullish momentum, and could lead to price pullbacks in the upcoming sessions.
Key Levels to Watch:
23,000 – Psychological barrier: A tentative resistance level in the short term due to the lack of clear technical references. A breakout above this level could reinforce the current bullish bias and signal a more sustained upward trend.
21,800 – Nearby support: An area aligned with a recent neutral technical zone, which may act as relevant support in the event of a short-term pullback.
21,000 – Key support: A level that coincides with the 50-period simple moving average. A break below this level could put the current bullish structure at risk and pave the way for a more significant downward move.
Written by Julian Pineda, CFA – Market Analyst