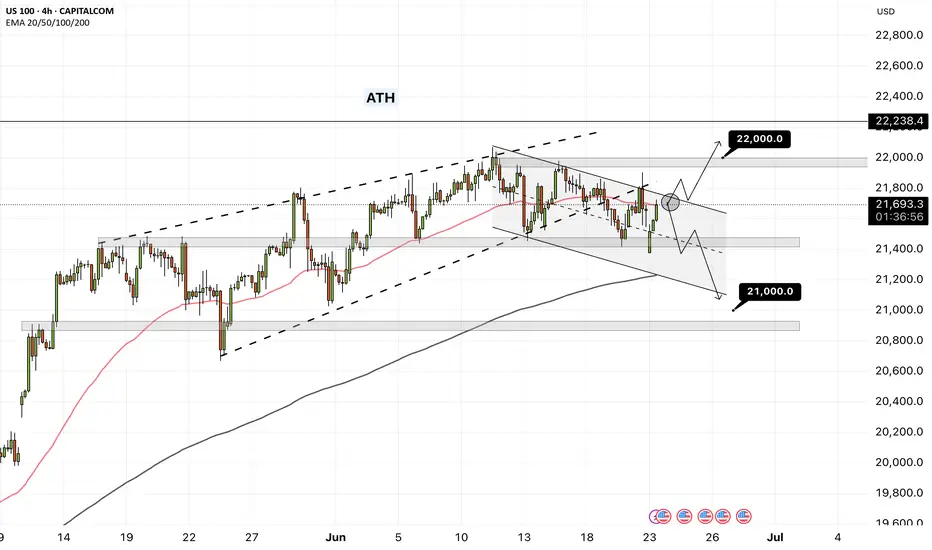
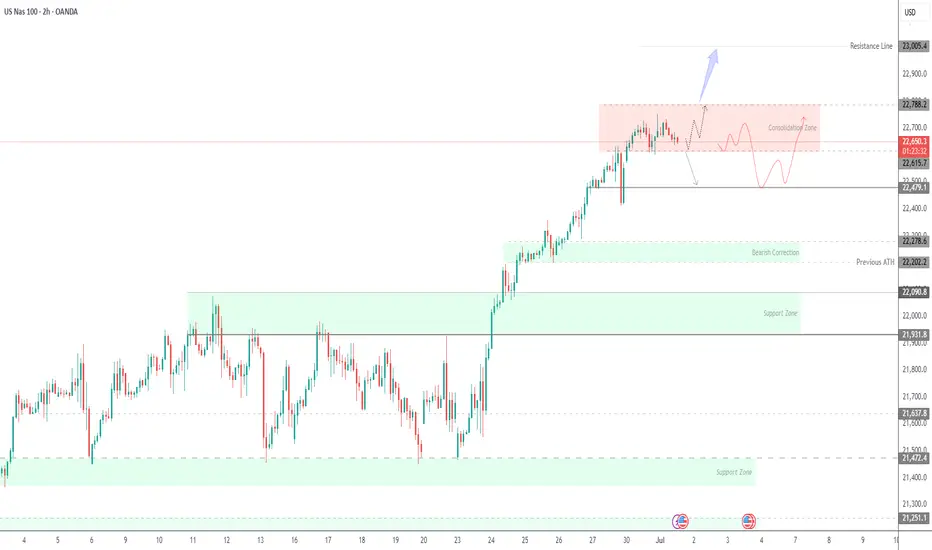
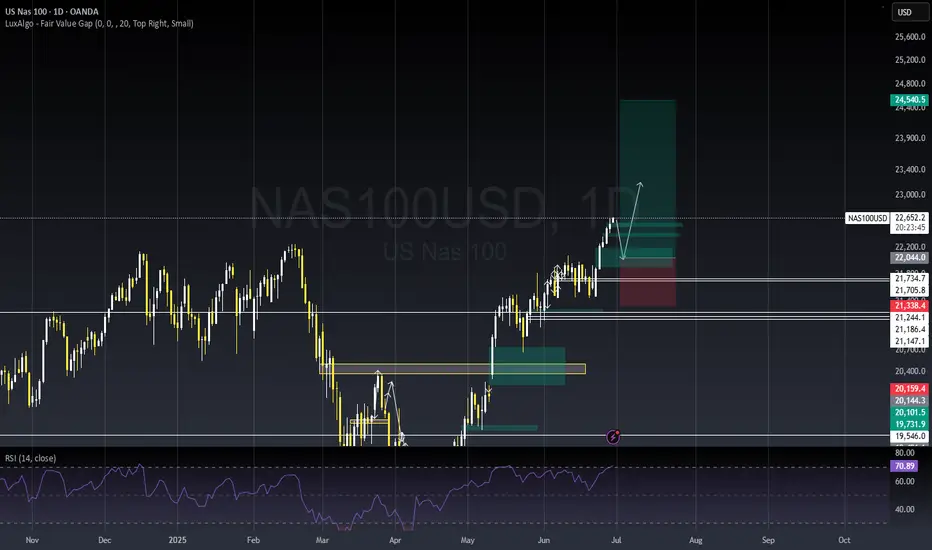
USNAS100 Key Level: 22,740 – Will the Trend Continue or Reverse?USNAS100 Update – Bullish Momentum Holds Above 22,740
USNAS100 has continued to push higher, following through as expected from yesterday’s analysis.
The index maintains bullish momentum as long as it trades above the key pivot at 22,740.
However, a 1H close below 22,730 could trigger a bearish correction toward 22,615.
A sustained break below that level may shift the trend to bearish.
Key Levels:
• Resistance: 22,870 / 23,000
• Support: 22,615 / 22,410
NASDAQ 100 CFD
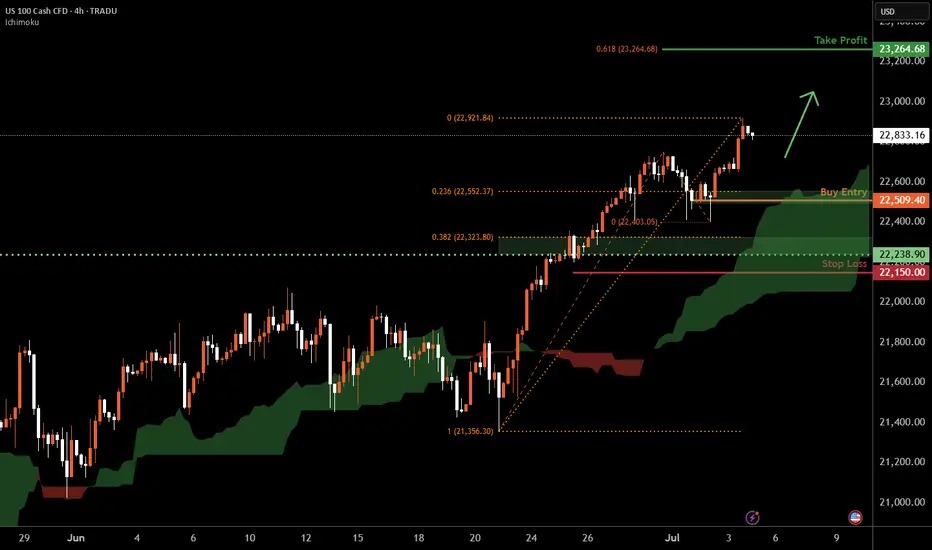
Nasdaq-100 H4 | Bullish uptrend to extend higher?The Nasdaq-100 (NAS100) is falling towards a swing-low support and could potentially bounce off this level to climb higher.
Buy entry is at 22,509.40 which is a swing-low support that aligns closely with the 23.6% Fibonacci retracement.
Stop loss is at 22,150.00 which is a level that lies underneath an overlap support and the 38.2% Fibonacci retracement.
Take profit is at 23,264.68 which is a resistance that aligns with the 61.8% Fibonacci projection.
High Risk Investment Warning
Trading Forex/CFDs on margin carries a high level of risk and may not be suitable for all investors. Leverage can work against you.
Stratos Markets Limited (tradu.com ):
CFDs are complex instruments and come with a high risk of losing money rapidly due to leverage. 63% of retail investor accounts lose money when trading CFDs with this provider. You should consider whether you understand how CFDs work and whether you can afford to take the high risk of losing your money.
Stratos Europe Ltd (tradu.com ):
CFDs are complex instruments and come with a high risk of losing money rapidly due to leverage. 63% of retail investor accounts lose money when trading CFDs with this provider. You should consider whether you understand how CFDs work and whether you can afford to take the high risk of losing your money.
Stratos Global LLC (tradu.com ):
Losses can exceed deposits.
Please be advised that the information presented on TradingView is provided to Tradu (‘Company’, ‘we’) by a third-party provider (‘TFA Global Pte Ltd’). Please be reminded that you are solely responsible for the trading decisions on your account. There is a very high degree of risk involved in trading. Any information and/or content is intended entirely for research, educational and informational purposes only and does not constitute investment or consultation advice or investment strategy. The information is not tailored to the investment needs of any specific person and therefore does not involve a consideration of any of the investment objectives, financial situation or needs of any viewer that may receive it. Kindly also note that past performance is not a reliable indicator of future results. Actual results may differ materially from those anticipated in forward-looking or past performance statements. We assume no liability as to the accuracy or completeness of any of the information and/or content provided herein and the Company cannot be held responsible for any omission, mistake nor for any loss or damage including without limitation to any loss of profit which may arise from reliance on any information supplied by TFA Global Pte Ltd.
The speaker(s) is neither an employee, agent nor representative of Tradu and is therefore acting independently. The opinions given are their own, constitute general market commentary, and do not constitute the opinion or advice of Tradu or any form of personal or investment advice. Tradu neither endorses nor guarantees offerings of third-party speakers, nor is Tradu responsible for the content, veracity or opinions of third-party speakers, presenters or participants.
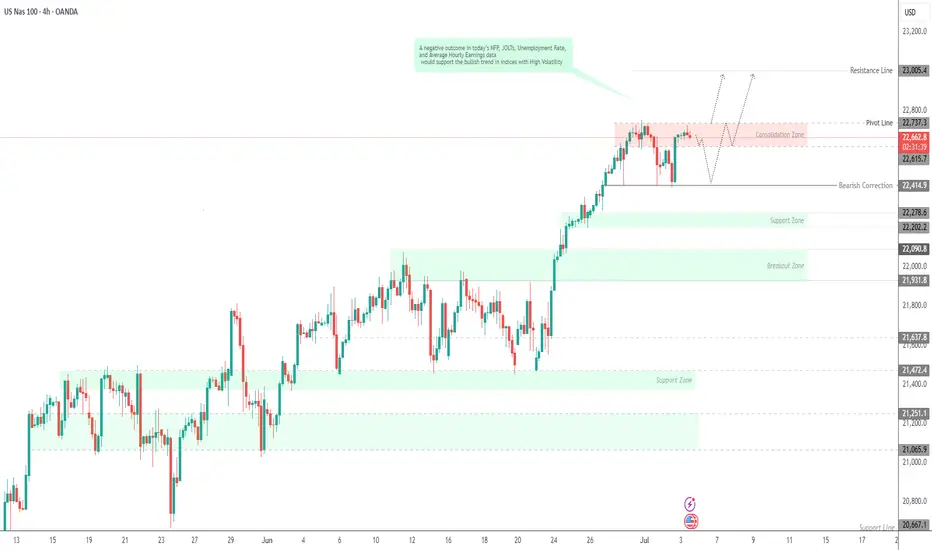
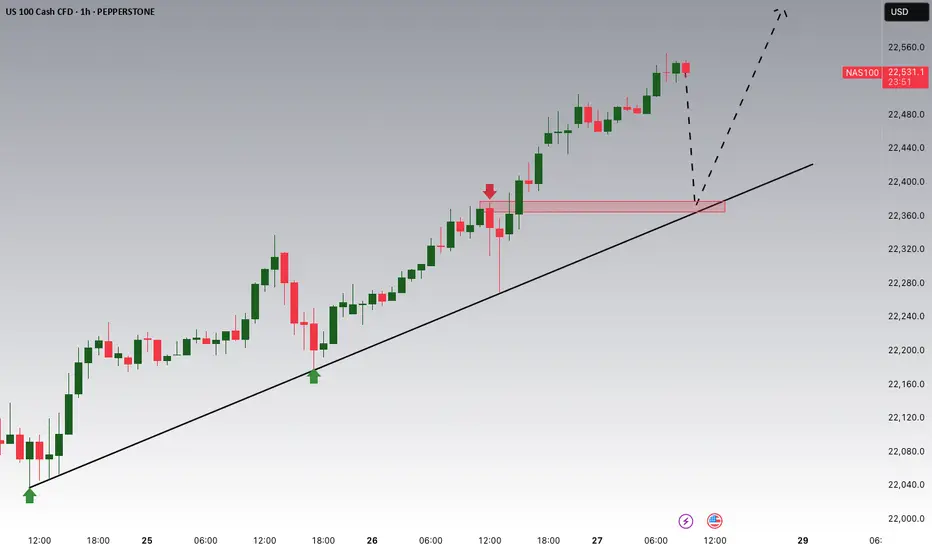
USNAS10 Faces Key Test at 22,615 Ahead of NFP VolatilityUSNAS100 – Key Levels Ahead of Major News
Today’s economic data releases (NFP, Unemployment Rate, etc.) are expected to drive volatility in the market. Traders should watch key levels closely.
Technical Outlook (USNAS10):
• Price is attempting to test 22,615.
• If it holds above 22,615, the bullish momentum is likely to continue.
• However, if price stabilizes below 22,615 on the 1H chart, further downside toward 22,420 is expected before a potential bullish reversal begins.
A breakout above 22,740 could trigger further upside toward 23,000
Key Levels:
• Resistance: 23,000 / 23,100
• Support: 22,420 / 22,280
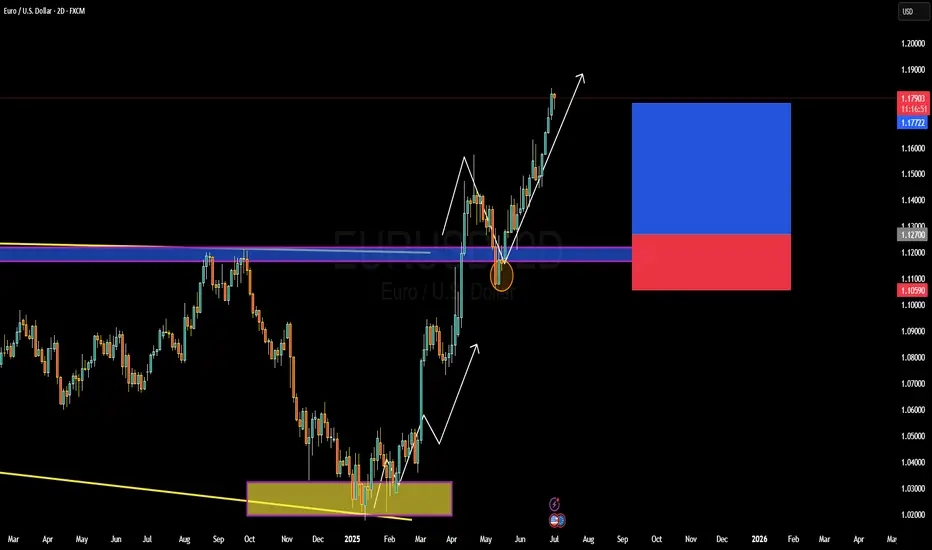
EURUSD BULISH OR BEARISH DETAILED ANALYSISEURUSD has been playing out exactly as forecasted, now trading confidently above the key 1.17 handle. Price action has respected prior structure levels perfectly, with the recent bullish impulse forming clean higher highs and higher lows. After a minor corrective move and successful retest of the previous breakout zone, we’re now seeing continuation momentum build toward the 1.21 target. This pattern is a textbook bullish flag followed by a clean breakout and retest, confirming the strength behind this current upside leg.
Fundamentally, the euro has gained strength due to growing divergence between the ECB and the Fed. With inflation in the Eurozone stabilizing and recent data indicating a modest recovery in manufacturing and services PMI, there's increasing speculation the ECB may hold rates longer, while the Fed is seen leaning toward eventual rate cuts as US labor data softens. The June NFP miss and downward revisions in prior data have weakened the USD’s position, creating a favorable environment for EURUSD bulls.
The technical confluence with macro fundamentals is striking. Risk sentiment is improving across global markets as inflation fears ease and rate clarity emerges. The euro remains supported by strong capital inflows and demand for yield stability. Additionally, EURUSD has cleared multi-month resistance zones with conviction, signaling institutional interest and momentum-based positioning. The recent candle formations suggest buyers are in firm control.
We remain on track for the 1.21 level, which aligns with prior swing highs and a key Fibonacci extension target. Any pullback toward the 1.16–1.1650 region should be viewed as a high-probability buying opportunity. With the DXY under pressure and euro zone resilience improving, EURUSD continues to be one of the top-performing major pairs heading into Q3. Stay patient and ride the wave—this move has more room to run.
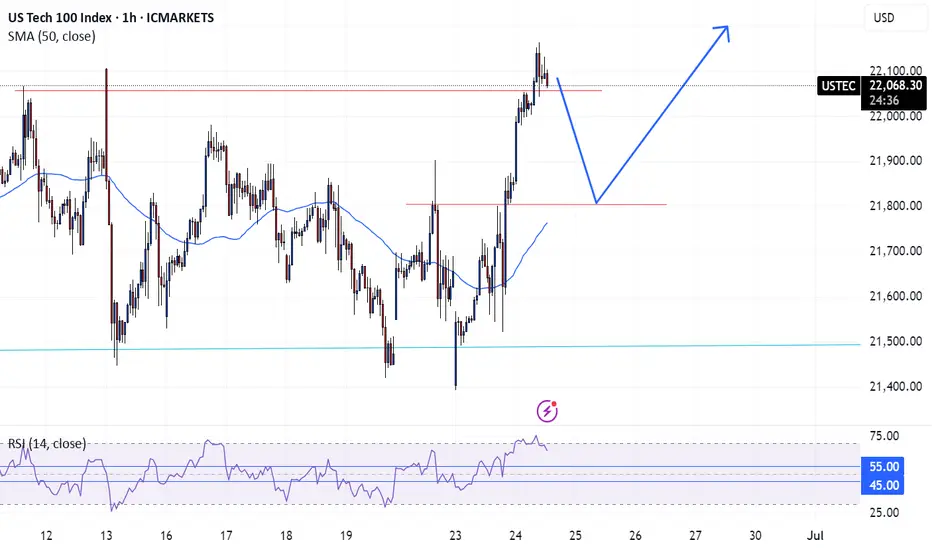
USNAS100 Bullish Momentum Holds Above Key PivotUSNAS100 – Overview
The price successfully retested the 22,610 level and resumed its bullish trend, reaching 22,750 as anticipated in our previous idea.
Currently, the index needs to maintain stability above the 22,610 pivot line to sustain the upward momentum toward the next resistance at 22,790. A sustained move above this level may open the path toward 23,000.
However, a 1H candle close below 22,610 could trigger a corrective move down to 22,480. A break below this support would expose the next key level at 22,280.
Pivot: 22,610
Resistance: 22,790 – 23,000
Support: 22,480 – 22,280
NAS100 Will Go Up From Support! Buy!
Please, check our technical outlook for NAS100.
Time Frame: 9h
Current Trend: Bullish
Sentiment: Oversold (based on 7-period RSI)
Forecast: Bullish
The market is approaching a key horizontal level 21,651.9.
Considering the today's price action, probabilities will be high to see a movement to 22,171.9.
P.S
We determine oversold/overbought condition with RSI indicator.
When it drops below 30 - the market is considered to be oversold.
When it bounces above 70 - the market is considered to be overbought.
Disclosure: I am part of Trade Nation's Influencer program and receive a monthly fee for using their TradingView charts in my analysis.
Like and subscribe and comment my ideas if you enjoy them!

NAS100 - The stock market is breaking the ceiling!The index is above the EMA200 and EMA50 on the four-hour timeframe and is trading in its medium-term channels. If it does not increase and corrects towards different zone, it is possible to buy the index near the reward.
Following a strong rally in U.S.equities, the S&P 500 and Nasdaq indices both achieved new all-time highs on Friday. It marks the first time since February that the S&P 500 has surpassed its previous peak, while the Nasdaq entered fresh price territory for the first time since December.
Despite ongoing market focus on economic data and the Federal Reserve’s interest rate policy path, the simultaneous surge in both indices reflects a renewed appetite for risk in the stock market—an appetite that has been accelerating since mid-April, especially in tech stocks.
In contrast, the Russell 2000 index, which tracks small-cap U.S. companies, still remains significantly below its prior high. To return to its October levels, it would need to rise over 13.5%. However, Friday’s 1.7% gain suggests capital is beginning to flow more broadly into underrepresented sectors.
Analysts argue that a strong breakout in the Russell 2000 could signal a broader rotation toward increased risk-taking—possibly driven by optimism over future rate cuts, easing inflation, and improved business conditions in the second half of the year.
Now that the S&P 500 has reached new highs and the Nasdaq has joined in, attention turns to the Russell 2000. If it begins to accelerate upward, markets could enter a new phase of sustained bullish momentum.
Following a week focused on gauging U.S. consumer spending strength, the upcoming holiday-shortened week (due to Independence Day) will shift attention to key employment and economic activity data.
On Tuesday, markets await the ISM Manufacturing PMI and the JOLTS job openings report. Wednesday will spotlight the ADP private employment report, and Thursday—one day earlier than usual due to the holiday—will see the release of several crucial figures, including the Non-Farm Payrolls (NFP), weekly jobless claims, and the ISM Services Index.
Currently, investor reaction to Donald Trump’s tariff commentary has been minimal. Market participants largely believe that any new tariffs would have limited inflationary effects and that significant retaliation from trade partners is unlikely.
Friday’s PCE report painted a complex picture of the U.S. economy. On one hand, inflation remains above ideal levels; on the other, household spending is showing signs of fatigue—a combination that presents challenges for policymakers.
Inflation-adjusted personal consumption fell by 0.3%, marking the first decline since the start of the year and indicating a gradual erosion of domestic demand. While wages continue to rise, their impact has been offset by declining overall income and reduced government support. To maintain their lifestyle, households have dipped into their savings, driving the personal savings rate down to 4.5%—its lowest level this year.
On the inflation front, the core PCE price index—the Fed’s preferred inflation gauge—rose 2.7% year-over-year, slightly above expectations. Monthly inflation also increased by 0.2%. Although these figures appear somewhat restrained, they remain above the Fed’s 2% target, with persistent price pressures in services—particularly non-housing services—still evident.
Altogether, the data suggest the U.S. economy faces a troubling divergence: weakening household income and consumption could slow growth, while sticky inflation in the services sector—especially under a potential Trump tariff scenario—could limit the Federal Reserve’s ability to cut interest rates.
NASDAQNASDAQ If the price cannot break through the 22728 level, it is expected that the price will drop. Consider selling the red zone.
🔥Trading futures, forex, CFDs and stocks carries a risk of loss.
Please consider carefully whether such trading is suitable for you.
>>GooD Luck 😊
❤️ Like and subscribe to never miss a new idea!
NAS100 LongNow that we have an official strong bullish close breaking previous highs on the weekly and monthly time frame. We will look for a potential pullback. The 3M candle is currently on track to closing as a strong bullish engulfing. Also, a 1M morning start followed up by a bullish momentum candle.
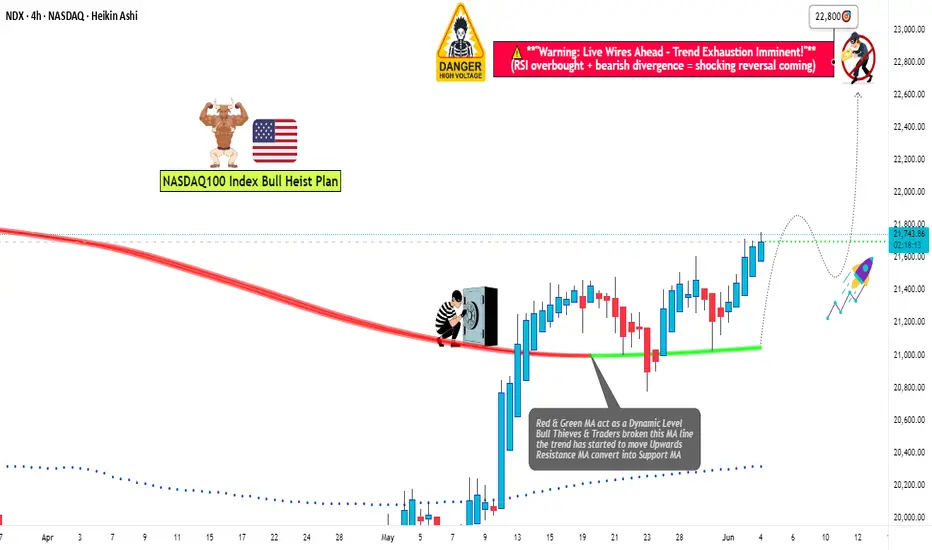
"NASDAQ 100: THE TECH ROBBERY! – Quick Profits Before Reversal?"🔥 "The NDX NASDAQ 100 INDEX Heist: Bullish Loot & Escape Before the Trap!" 🔥
🌟 Hi! Hola! Ola! Bonjour! Hallo! Marhaba! 🌟
Dear Money Makers & Market Robbers, 🤑💰💸✈️
Based on the 🔥Thief Trading Style🔥 (technical + fundamental analysis), here’s our master plan to heist the NDX - NASDAQ 100 INDEX. Follow the strategy on the chart—long entry is the play! Aim to escape near the high-risk RED Zone (overbought, consolidation, potential reversal). The bears are lurking, so take profits and treat yourself—you’ve earned it! 💪🏆🎉
🚀Entry (The Vault is Open!)
"Swipe the bullish loot at any price!"
For precision, place buy limit orders within 15-30min timeframe (recent swing lows/highs).
Set alerts! Don’t miss the heist.
🛑 Stop Loss (Safety Net)
Thief-style SL at nearest swing low (4H timeframe) → 21,000.00 (adjust based on risk/lot size).
🏴☠️ Target 🎯: 22,800.00
Bullish momentum is fueling this heist—ride the wave but exit before the trap!
📰 Fundamental Backing (Why This Heist Works)
Macroeconomic trends, COT data, geopolitics, and sentiment align for bullish moves.
Full analysis? Check our bio0 linkk! 👉🔗🌎
⚠️ Trading Alerts (News & Risk Mgmt)
Avoid new trades during high-impact news (volatility = danger).
Use trailing stops to lock profits and dodge sudden reversals.
💥 Boost This Heist!
Hit 👍 (Boost Button) to strengthen our robbery squad!
More heists = More profits—stay tuned for the next steal! 🚀🤑
See you soon, fellow thieves! 🤝🎉
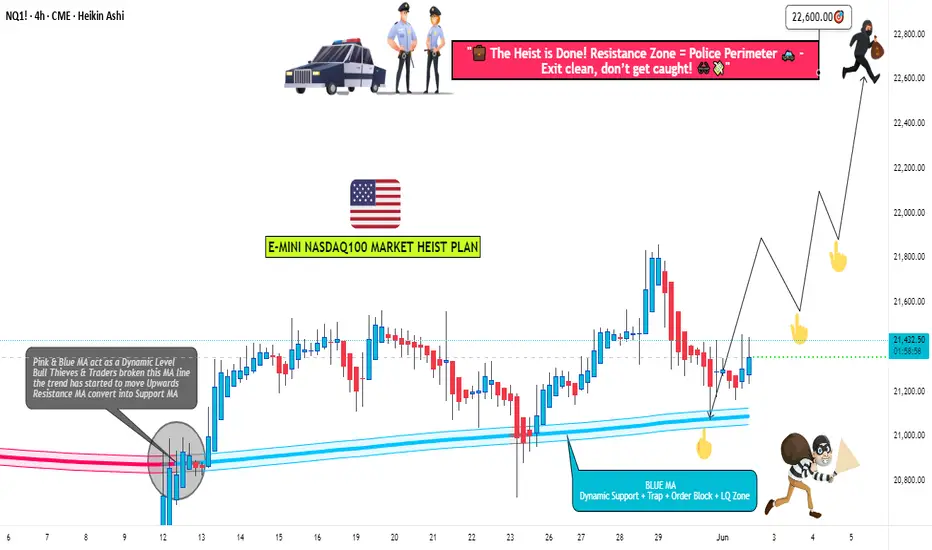
NASDAQ 100 TECH HEIST: Bullish Loot Before the Bear Trap!🚨 E-MINI NASDAQ 100 HEIST: Tech Rally or Bear Trap? (Thief Trading Blueprint) 🚨
🌟 Hola! Oi! Bonjour! Hallo! Salam! 🌟
Attention all Market Bandits & Tech Raiders! 🏴☠️💻💰
🔥 Thief Trading Intel: We're targeting the E-MINI NASDAQ 100 for a bullish loot grab! Long entry only—high-risk Red Zone ahead: overbought, consolidating, and primed for a reversal. Don’t let the bears ambush your profits!
"Claim your tech treasure and run—you’ve earned this steal!" 💰🚀
🚪 ENTRY: The Tech Vault is Open!
📈 "Swipe bullish loot at any price—the heist is LIVE!"
Buy Limit orders at recent swing lows/highs (15-30 min TF).
📌 Pro Thief Move: SET ALERTS! Don’t miss the breakout.
🛑 STOP LOSS: Escape Plan
📍 Thief SL (Smart Crew): Recent swing low (20,700.00, 4H TF).
📍 Adjust based on your risk, lot size, and orders.
🎯 TARGET: Loot & Exit!
🎯 22,600.00 (or bail early if the market flips!)
⚡ SCALPERS’ QUICK HIT
👀 Long scalps ONLY!
Deep pockets? Raid now.
Light wallet? Join swing traders.
Trailing SL = Your Profit Shield! 🛡️
📢 WHY THIS HEIST? (NASDAQ Bullish Momentum)
Tech rally brewing! Key drivers:
Fundamentals (COT, Macro, Geopolitics)
Sentiment & Intermarket Trends
Index-Specific Analysis & Positioning
🔗 Full intel? Bio linkss checkk! 👉🏻👉🏻👉🏻
⚠️ WARNING: News = Danger Zone! 📡🚨
Tech news moves FAST! Protect your loot:
❌ Avoid new trades during news.
🔒 Trailing SL = Lock profits.
💖 SUPPORT THE TECH HEIST CREW!
💥 SMASH THAT BOOST BUTTON! 💥
More boosts = bigger future heists!
Stronger crew = more $$$ for all!
Profit daily with Thief Trading Style! 📈🏆
Next tech raid coming soon—stay tuned! 🖥️🤑
US100 (NASDAQ) BREAKOUT BLUEPRINT: LOOT LIKE A SMART TRADER!🔥 NASDAQ 100 HEIST: STEAL THE TREND LIKE A MARKET BANDIT! 🚨💰
Locked & loaded for the US100 (NASDAQ 100) heist? This slick blueprint cracks the code to loot profits—blending killer technicals with macro intel. Ride the bullish wave, but dodge traps near the Overbought Zone. Bears lurk, so secure your bag before the reversal hits! 🐻💨
🎯 ENTRY: STRIKE LIKE A PRO THIEF
Long the breakout near 21,500.0 (or ambush pullbacks at 20,400.0 & 19600.0).
Set stealth alerts to catch moves in real-time. 🕶️🔔
🛡️ STOP LOSS: ESCAPE ALIVE
Hide stops under the last 4H swing low/wick—no reckless bets!
Adjust for your risk—survivors play smart. ⚡
💸 TAKE PROFIT: VANISH WITH THE LOOT
Main Target: 22,250.0 (or bail early if momentum fades).
Scalpers: Trail stops & ghost out with quick wins. 🏃♂️💨
📡 WHY THIS HEIST WORKS
NASDAQ 100’s on fire: Fundamentals + COT data + macro tides align.
Sentiment’s bullish, but stay sharp—links below for the full intel. 🔍🌐
⚠️ WARNING: NEWS = POLICE SIRENS
Avoid new trades during high-impact news. 📢
Lock profits with trailing stops if you’re already in. 🔐
🤝 JOIN THE TRADING MAFIA
Smash LIKE, drop a comment, & let’s dominate the US100! �
Ready for the next big move? Stay tuned. 👀
Happy hunting, chart pirates! 🏴☠️📉

Comprehensive Market Analysis: NAS100 Comprehensive Market Analysis: NAS100
1. Monthly Timeframe (The Long-Term "Big Picture")
Observation: The chart displays an incredibly powerful and long-standing uptrend. The price is consistently making higher highs and higher lows.
Candlestick Analysis: The most recent candles are strong, long-bodied bullish (green) candles. There are no significant bearish reversal patterns present whatsoever. This is a picture of strength.
Ichimoku Analysis: The price is trading far above the Kumo (Cloud), which is wide and bullish (green). The Tenkan-sen is far above the Kijun-sen, and the Chikou Span is in open space high above the price action from 26 periods ago. This is a textbook example of a very strong, healthy bull market.
Conclusion (Monthly): The long-term outlook is unequivocally Bullish.
2. Weekly Timeframe (The Dominant Trend)
Observation: The strength seen on the monthly chart is confirmed here. The trend is clearly defined and moving from the lower-left to the upper-right.
Heikin Ashi Interpretation: If we were to view this with Heikin Ashi, this chart would show a long sequence of green candles, with most of them having no lower wicks, which, according to your lesson, signifies a very strong and healthy uptrend.
Ichimoku Analysis: All five Ichimoku components are in perfect bullish alignment. The price is above the Tenkan-sen, which is above the Kijun-sen, and all are far above the Kumo. This confirms the trend is not only bullish but also has strong momentum.
Conclusion (Weekly): The dominant trend is Strongly Bullish.
3. Daily Timeframe (The Trading Trend)
Observation: The chart shows a clear uptrend. The most recent price action shows a slight pullback or pause after making a new high.
Candlestick Analysis: The last few candles are smaller and show some indecision (like Spinning Tops), which is very common after a strong upward move. This is more likely a "breather" or consolidation rather than a reversal. There are no major bearish reversal patterns like a Bearish Engulfing or Evening Star.
Ichimoku Analysis: The price is pulling back towards the Tenkan-sen, which is the first line of dynamic support. As long as the price holds above the Kijun-sen, the bullish trend is considered fully intact.
Conclusion (Daily): The trend is Bullish, currently in a minor pullback. The overall structure remains strong.
4. 4-Hour and 1-Hour Timeframes (The Intraday Trend)
Observation: These charts give a clearer view of the minor pullback seen on the daily chart. Here, the price action is moving sideways to slightly down.
Candlestick Analysis: We can see a few Long Upper Shadow candles near the recent top, which confirms the lesson that sellers stepped in to cause this short-term pause. However, there is no strong follow-through yet from the bears.
Ichimoku Analysis: On the 4H chart, the price is testing the Kijun-sen as support. This is a critical level. If it holds, the uptrend is likely to resume. If it breaks below, the correction could deepen, with the Kumo cloud being the next major support zone.
Conclusion (4H & 1H): The short-term momentum is corrective/sideways within a larger bullish trend.
5. Lower Timeframes (30M, 15M, 5M)
Observation: These charts show the corrective price action most clearly, appearing as a short-term downtrend.
Context is Key: Based on the overwhelming strength of the Monthly, Weekly, and Daily charts, this downtrend on the lower timeframes must be interpreted as counter-trend noise. It is a pullback, not a reversal of the major trend.
Harmonic Potential: This pullback could be forming the BC leg of a bullish ABCD pattern, or the AB leg of a bullish Gartley or Bat pattern, where traders would look for a buying opportunity at a key Fibonacci retracement level below.
Overall Synthesis and Final Conclusion
By performing a correct, top-down analysis of the NAS100 charts, the conclusion is the complete opposite of my previous mistaken analysis.
Long-Term (Monthly/Weekly): The market is in a powerful, secular bull market.
Medium-Term (Daily): The primary trend is up, but the market is taking a healthy and expected pause or pullback.
Short-Term (Intraday): The market is currently in a corrective phase.
Final Outlook: The multi-timeframe analysis is in strong alignment. The overwhelming evidence suggests that the primary trend for NAS100 is strongly Bullish. The current downward price action on the lower timeframes is very likely a temporary correction. Traders who align with the dominant trend would view this dip as a potential buying opportunity as the price approaches key support levels (like the Kijun-sen on the 4H/Daily chart), anticipating a resumption of the main uptrend.
For those interested in further developing their trading skills based on these types of analyses, consider exploring the mentoring program offered by Shunya Trade.
I welcome your feedback on this analysis, as it will inform and enhance my future work.
Regards,
Shunya Trade
⚠️ Disclaimer: This post is educational content and does not constitute investment advice, financial advice, or trading recommendations. The views expressed here are based on technical analysis and are shared solely for informational purposes. The stock market is subject to risks, including capital loss, and readers should exercise due diligence before investing. We do not take responsibility for decisions made based on this content. Consult a certified financial advisor for personalized guidance.
NASDAQ Potential UpsidesHey Traders, in today's trading session we are monitoring NAS100 for a buying opportunity around 22,380 zone, NASDAQ is trading in an uptrend and currently is in a correction phase in which it is approaching the trend at 22,380 support and resistance area.
Trade safe, Joe.
Smart Friday Trades: NASDAQ Setup and Key Levels to Watch NAS100📊 NASDAQ US100 Analysis – Friday Setup
I'm currently watching the NASDAQ closely 👀. The NAS100 looks significantly overextended 📈, and with it being the end of the week, we often see price action push into the weekly high before pulling back into the weekly close 🔁.
This is a pattern I’ve seen play out many times during the New York session on Fridays 🗽📉.
💡 Here’s my suggestion:
Wait for today’s data release 📅 to finish. If price ranges and then breaks market structure to the downside, keep an eye out for a short entry on the retrace and retest of the range low.
🎯 Your targets and stop loss are outlined clearly in the video, so make sure to watch it through.
⚠️ Trade sensibly, manage your risk, and don't rush into anything.
I'd love to hear your thoughts in the comments 💬
Have an awesome day and I’ll see you in the next one! 🚀

Nasdaq: At the Upper EdgeYesterday, the Nasdaq climbed above resistance at 22,475 points. Currently, the index is positioned outside our turquoise Target Zone (coordinates: 21,751 – 22,425 points), which remains active. Stops for short positions 1% above the zone have not yet been triggered. Our primary scenario remains intact for now: technically, there is room for wave B to reach the next resistance at 23,229 points. Following the B-wave peak, a downtrend is expected with the corrective wave C. With a 42% probability, we anticipate that wave alt.(4) is already complete, and the index may break directly higher within the magenta-colored wave alt.(5), surpassing the 23,229-point mark.
📈 Over 190 precise analyses, clear entry points, and defined Target Zones - that's what we do.

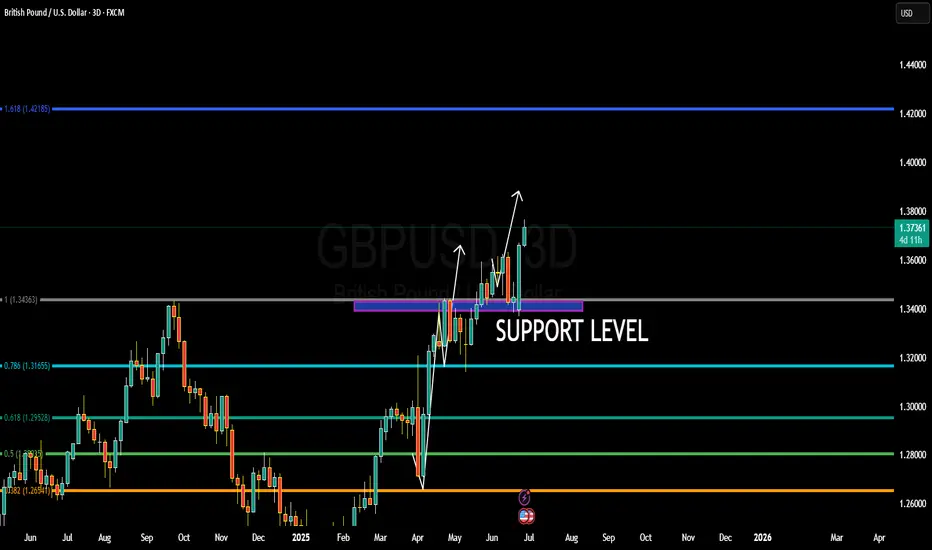
WHY GBPUSD BULLISH ???GBPUSD is unfolding exactly as anticipated, with price now hovering around the 1.3740 region and maintaining strong bullish momentum. Price has successfully bounced from the key support zone near 1.3430, which was previously a major resistance turned into solid demand. This level held firmly during multiple retests, confirming a clean breakout-retest continuation pattern. As long as this structure remains intact, I continue to hold a bullish bias targeting 1.4000 in the coming sessions.
From a fundamental perspective, the British Pound is gaining strength on the back of improved UK economic sentiment. The latest UK inflation data surprised to the upside, pushing annual CPI back above 3%, which reinforces expectations that the Bank of England may need to act sooner rather than later on rate hikes. Markets are now pricing in higher probability of a rate adjustment before the end of Q3 2025. Meanwhile, the US Dollar is under moderate pressure as recent soft labor data and downward revisions in consumer confidence readings have dampened expectations for further tightening from the Fed.
Technically, GBPUSD has cleared major Fibonacci resistance levels and is now forming higher highs and higher lows across the higher timeframes. The current bullish wave is fueled by clean institutional demand and strong price action momentum. If the pair can sustain above 1.3650–1.3680, a swift move toward the psychological 1.4000 handle is highly probable. The 1.4218 Fibonacci extension aligns as a longer-term secondary target for swing traders holding this bullish continuation.
This setup offers a solid blend of macroeconomic backing and technical structure. GBPUSD remains one of the top trending forex pairs right now, favored by strong price action, central bank divergence, and global capital rotation. I'm closely monitoring for intraday pullbacks to add long positions, aiming for extended upside as the market follows through on this bullish breakout continuation.
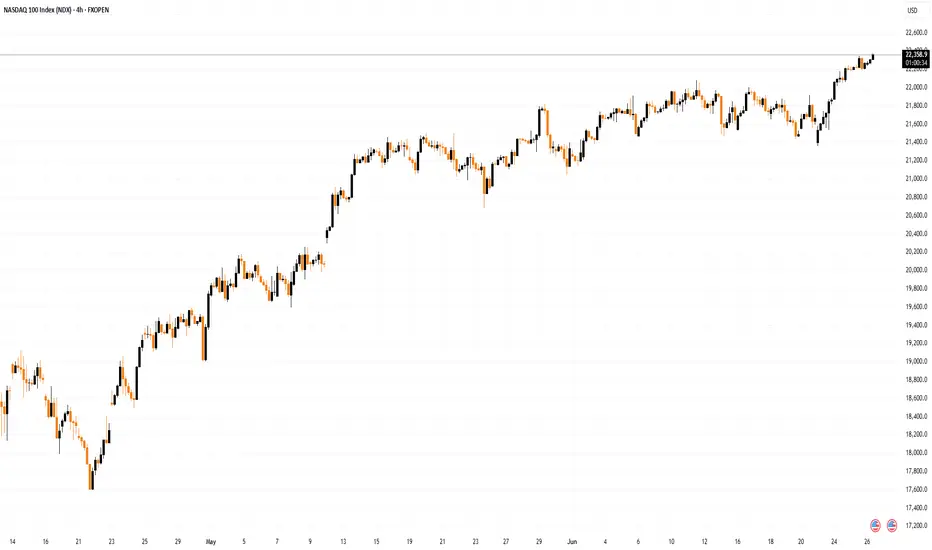
Nasdaq 100: A New All-Time HighNasdaq 100: A New All-Time High
As shown on the Nasdaq 100 chart (US Tech 100 mini on FXOpen), the value of the technology stock index has risen above its February peak, setting a new historical high.
Bullish sentiment may be supported by:
→ Easing concerns over potential US involvement in a Middle East war, as the ceasefire between Israel and Iran remains in effect.
→ Media reports suggesting that Donald Trump is considering replacing Federal Reserve Chair Jerome Powell by September or October, in an effort to influence a rate cut that could accelerate economic growth (though this also raises the risk of a new inflationary wave).
Technical Analysis of the Nasdaq 100 Chart
Price fluctuations in May and June have formed an ascending channel (highlighted in blue), with the following observations:
→ The decline (marked by red lines) appears to be an interim correction forming a bullish flag pattern;
→ The 22K level, which acted as resistance mid-month, was breached by a strong bullish impulse (indicated by the arrow) from the week's low.
This leaves the market vulnerable to a potential correction, which seems possible given:
→ Proximity to the upper boundary of the ascending channel;
→ Overbought conditions indicated by the RSI.
If the market corrects, a retest of the 22K level may happen.
This article represents the opinion of the Companies operating under the FXOpen brand only. It is not to be construed as an offer, solicitation, or recommendation with respect to products and services provided by the Companies operating under the FXOpen brand, nor is it to be considered financial advice.
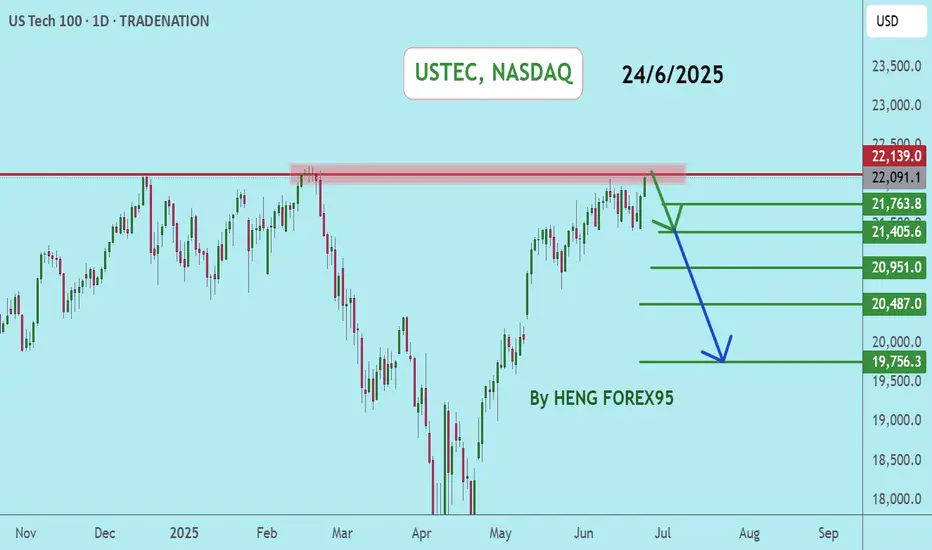
NASDAQ, USTECUSTEC price is currently near the main resistance level of 22168-22229. If the price cannot break through the level of 22229, it is expected that the price will have a chance to go down. Consider selling the red zone.
🔥Trading futures, forex, CFDs and stocks carries a risk of loss.
Please consider carefully whether such trading is suitable for you.
>>GooD Luck 😊
❤️ Like and subscribe to never miss a new idea!
USTECH Long opportunity USTECH is currently on a bullish impulse move, sitting at the resistance level of 22,000. price is trading above the 50 SMA and we can see momentum favors the bulls with the RSI above the 55 level
Expecting a drop in price, based on the technical analysis, where we could potentially see a retest of of the 21,800 price level before the bullish trend resumes beyond 22,000.
Fundamentals with the Iran Israel cease fire support further bullish indices with confidence coming back into the markets.
Market Structure Breakdown on NASDAQ: What Traders Should Watch📉 NASDAQ (NAS100, US100) Analysis 🧠💼
I’m currently keeping a close eye on the NASDAQ (NAS100) — price action is telling a story worth watching.
📆 Last week, the index came under clear pressure, and now on the 4H timeframe, we’re seeing a defined bearish structure with consistent lower highs and lower lows 📉🔻. This recent expansion to the downside has led to a break in market structure (BOS), and price is now pulling back into equilibrium 🔄.
⏳ For now, it’s a waiting game. I’m watching to see if this pullback finds resistance at a premium level and rotates back to the downside, which would present a potential short setup 🎯📊.
🕒 On the 30-minute chart, I’m monitoring for a clear structural shift — a change in momentum that confirms bearish intent. Should the NASDAQ resume its downward move, it could trigger risk-off sentiment, bringing strength into the JPY pairs 💴🚨 as capital flows out of risk assets.
⚠️ Disclaimer:
This analysis is for educational purposes only and should not be considered financial advice. Always conduct your own research and consult with a licensed financial advisor before making any trading decisions. 📚💼

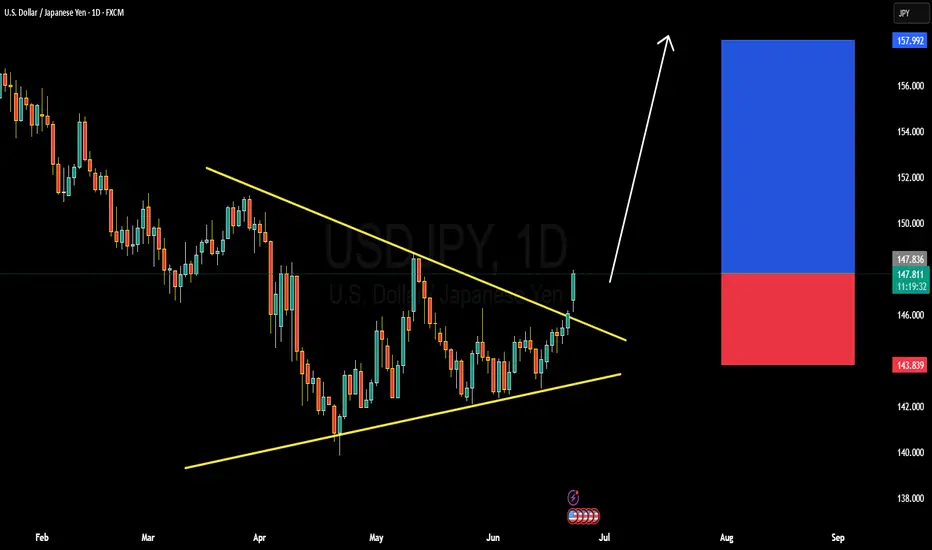
SDJPY BULLISH OR BEARISH DETAILED ANALYSISUSDJPY has successfully broken out of the symmetrical triangle structure that has been forming since early April, with today’s daily candle showing strong bullish momentum above the resistance zone around 147.500. The breakout is clean and backed by volume, which suggests that bulls are in full control. Price action is respecting the trendline structure and has now confirmed a fresh higher high, setting the stage for the next bullish leg. My immediate upside target for this move stands at 157.900.
Fundamentally, the divergence between the Federal Reserve and the Bank of Japan continues to widen. The Fed remains hawkish with inflation still sticky in the US and interest rate cuts being pushed further out. In contrast, the Bank of Japan remains ultra-dovish, with no major policy tightening in sight and continued yield curve control. This policy mismatch is keeping the Yen under consistent selling pressure. Additionally, Japan's core inflation slipped again this week, further reducing the probability of any BOJ rate hike this quarter.
The technical breakout aligns perfectly with the macro narrative. A strong bullish candle breaking structure on the daily suggests momentum will likely continue. With no strong resistance until the 157.900 area, this setup offers a high-conviction long opportunity. Traders should watch for minor pullbacks toward 147.000–146.800 as potential re-entry or add-on zones.
With rising US bond yields, weak Japanese fundamentals, and breakout confirmation on the chart, USDJPY is now well-positioned for a continuation rally. This is a trend-following setup with solid fundamentals and momentum confirmation—ideal conditions for a profitable move in the current forex environment.
U
NAS100 - Will the stock market continue to rise?!The index is trading in its short-term descending channel on the four-hour timeframe between EMA200 and EMA50. If there is no re-up and the channel is broken, I expect a correction to form, the target of which can be the bottom of the descending channel.
If the channel top is broken, we can expect a new ATH to be recorded in the Nasdaq index. It is better to wait for confirmation in case of a breakdown in order to control the risk further.
Over the past week, the Nasdaq has managed to stay within a stable range, especially despite geopolitical pressures, mixed signals from the Federal Reserve, and some concerns in the semiconductor sector. This stability is largely due to the strong fundamentals of large technology companies, the reduction in distribution days (selling pressure) in the market, and renewed expectations of interest rate cuts later in the year.
At a structural level, the number of distribution days, which indicate selling pressure from large institutions, has reached a relatively low number of 3 days in the Nasdaq over the past month. This is a sign of the weakness of heavy selling at price peaks and the market's willingness to maintain long positions. Unlike trends seen in previous years, this time the market has shown no signs of widespread divergence or fundamental weakness, even despite strong inflation data or concerns about new trade restrictions with China.
This trend is largely supported by the stellar performance of companies such as Nvidia, Microsoft, Apple and other major players in the artificial intelligence and technology sectors. Revenue growth, increased investment in AI infrastructure, as well as the return of institutional investors’ confidence in technology stocks, have led the Nasdaq to record significant returns since the beginning of 2025. Analysts from major financial institutions such as Goldman Sachs and Morgan Stanley, while warning of potential selling pressure on the index, remain positive about continued growth, of course, assuming that economic data does not deviate from the expected path.
However, some risks are clearly visible in the trading week ahead. The most important of them is the possibility of geopolitical tensions again affecting the market. In recent days, oil prices have risen and financial markets have experienced moments of fear after tensions in the Middle East escalated and the US political response to Iran and Israel's moves. Although the Nasdaq was able to withstand these fluctuations, the market remains very sensitive to energy price spikes and their impact on inflation.
Important data in the coming week could also determine the market's direction. The release of the Core PCE index, the Fed's preferred inflation measure, as well as data on unemployment insurance claims, both play a key role in the interest rate outlook. If inflation data is lower than expected, the likelihood that the Fed will start cutting rates in September or November increases, which would be a bullish stimulus for the stock market and especially the Nasdaq.
On the other hand, potential pressure on the semiconductor group - especially if new restrictions on technology exports to China are imposed - could disrupt the market trend. Last Friday, just one news report on the possibility of restricting exports of advanced chipsets caused the Nasdaq to fall by more than 0.6%. If this trend becomes official US government policy, it could cause a correction in stocks of companies such as Nvidia, AMD and ASML, which are heavy weights in the Nasdaq index.
In addition to these factors, next week will also see the release of quarterly reports from major companies such as Micron, FedEx and Nike. The results of these reports, especially in the area of sales and cost forecasts, could affect economic growth expectations. If the figures are better than expected, the Nasdaq could move towards new highs. However, if the data is released, the market could enter a short-term correction phase.
In terms of correlation with monetary policy, the Nasdaq index has become more sensitive than ever to interest rates and cash flows. The dollar price, real interest rates, and the direction of Treasury bonds all now have a direct impact on the valuation of technology companies. As a result, any change in the path of monetary tightening or easing is immediately reflected in the Nasdaq’s performance. However, analysts believe that the market will remain in a “wait and see” phase until the official data is released in July. In summary, the Nasdaq index is currently in a situation where its fundamentals are supported by the profitability of large technology companies, the easing of institutional selling pressure, and the possibility of a rate cut. At the same time, the market remains highly sensitive to major geopolitical news, trade policy, and economic data. As a result, the week ahead can be considered a “two-sided” period, where opportunities and threats are in a delicate balance, and only economic data and quarterly results can tip the balance in the direction of an increase or a correction.