Potential Reversal on the NAS100. key level around 20700.0?The Nas100 has been in a downtrend since mid-February, primarily due to President Trump's tariffs, among other factors. The bearish trend began at a high of 22225.5 and has aggressively declined to 19171.0 without any significant corrections on the 1-day chart. However, currently, the price is forming a correction phase, and I am focusing on the 0.5 Fibonacci level, which is around 20700.0. This level coincides with a previous weekly higher high and higher low area.
Now on the 1D Chart
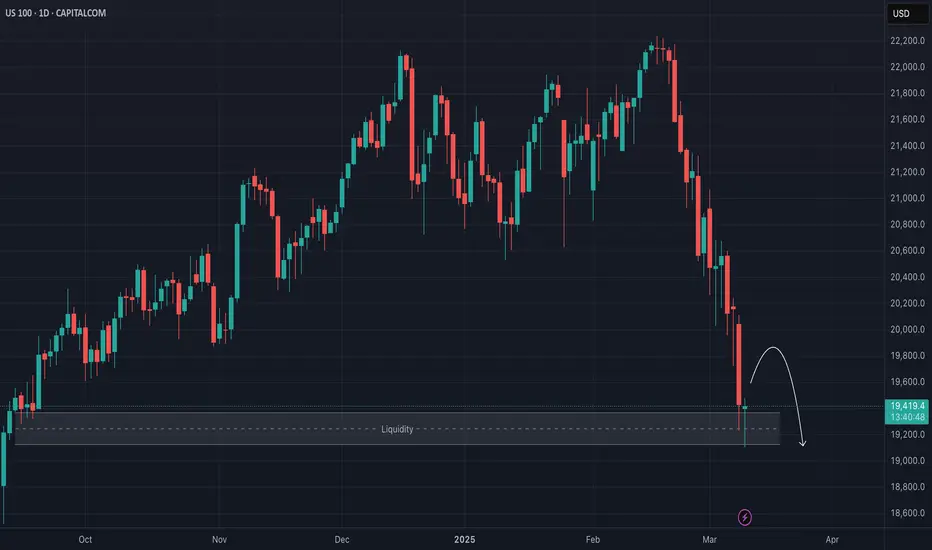
We can observe that the price bounced from 19171.0. After being choppy for a few days, the price has now broken the lower high structure. It appears that the price is aiming to return to the key level around the 20700.0 area, where we also have the aforementioned weekly levels.
The price seems to be making a gradual approach to the mentioned level, which I find favourable. As this develops on the daily chart, I will continue to monitor this setup in preparation for a bearish sell opportunity, when the price breaks the 1-day correction.
Thank you for reading! 🙋🏼♂️
Nas100analysis

Will NASDAQ Rally Continue? Technical Analysis & Trade Idea.NASDAQ NAS100 (4H Chart) Analysis 📊📈
The NASDAQ NAS100 is showing strong bullish momentum on the 4-hour chart. The chart suggests a continuation of the uptrend, with a potential move toward the 21,013.0 target. 🚀
Key Levels to Watch 👀
Support Levels:
19,750.9: Near the 61.8% Fibonacci retracement, this level has seen strong buying interest.
19,405.8: The 100% Fibonacci retracement, marking the swing low and a critical support zone.
Resistance Levels:
20,209.4: The 0% Fibonacci retracement, acting as immediate resistance.
20,611.2: The 50% Fibonacci extension, a key target for bullish continuation.
21,013.0: The 100% Fibonacci extension, representing the ultimate bullish target in this trend.
Volume Profile Insights 📉
The Volume Profile shows heavy trading activity between 19,800–20,000, confirming strong support in this range. Above 20,200, trading volume thins out, suggesting that a breakout could lead to a quick rally toward 21,000.
Momentum and Indicators ⚡
Trend: The index is in a clear uptrend, forming higher highs and higher lows since the recent swing low.
Fibonacci Confluence: The alignment of the 50% retracement and Volume Profile support strengthens the bullish outlook.
Curved Arrow Projection: A pullback to the 19,800–19,750 zone is likely before the next leg higher toward 21,013.0.
Social Media Sentiment 🌐
Twitter: Analysts are optimistic, citing strong tech sector performance and easing interest rate fears. Many traders are eyeing the 21,000 level as the next milestone.
Reddit: Discussions emphasize the importance of the 19,800 support zone, warning that a break below this level could invalidate the bullish setup.
Conclusion 📝
The NASDAQ NAS100 is set for a bullish continuation, with key support at 19,750–19,800 and resistance at 20,209.4 and 21,013.0. Watch for a potential pullback to the 50% Fibonacci retracement before the next upward move. A break below 19,750 could signal a shift in momentum, while a breakout above 20,209.4 would confirm the bullish trend. 🚀
Disclaimer: This analysis is for informational purposes only and not financial advice. Always do your own research and consult a professional before trading. 📢

NAS100 I Potential Gap Fill and More Growth to 21,000Welcome back! Let me know your thoughts in the comments!
** NAS100 Analysis - Listen to video!
We recommend that you keep this pair on your watchlist and enter when the entry criteria of your strategy is met.
Please support this idea with a LIKE and COMMENT if you find it useful and Click "Follow" on our profile if you'd like these trade ideas delivered straight to your email in the future.
Thanks for your continued support!Welcome back! Let me know your thoughts in the comments!

NAS100 Analysis: Potential higher timeframe pullback in playOn the higher timeframe, NAS100 remains bullish. However, recent price action suggests that a higher timeframe pullback may be underway, providing a discounted price opportunity.
On the daily chart, a market structure shift occurred when NAS100 broke below the 20,477 level. The most recent price action indicates a short-term pullback to the upside on lower timeframes, potentially to mitigate the internal supply zone and reach premium price levels.
I am closely watching the 61.80% Fibonacci retracement level around 21,028 for potential selling opportunities, with downside targets at 19,113 and 18,297.
How Are You Trading NAS100 This Week?
Share your thoughts in the comments!
If you found this analysis helpful, please support it with a boost. Also, follow for more updates!

NAS 100 Overextended – Brace for a Pullback! The NAS 100 is looking highly overextended at the moment 📊. Market conditions are precarious, with many instruments trading into key support and resistance levels on both the daily and weekly timeframes ⏳.
A sharp pullback 📉 could be on the horizon, potentially offering a counter-trend buying opportunity on the lower timeframes for the US 100 💰. If it pushes higher, it may set up a potential short trade 🎯.
🚨 Not financial advice – trade wisely and manage your risk! ⚖️
Nas100 Correction: Why a Drop Below 20K is LikelySince reaching its recent all-time high of 22,232, the PEPPERSTONE:NAS100 has dropped 1,000 points. While this might seem like a significant decline, it actually represents less than a 5% correction—hardly a major pullback.
This drop has brought the index into a key confluence support zone, raising the common question: Is the correction over?
In my opinion, it’s not. For a healthy correction, a dip below 20,000 is necessary.
Technical Perspective
🔹 Since the "bullish" event marked by Trump’s election, the index hasn’t made substantial progress. While it has technically risen, the gains have been marginal, suggesting more distribution than true bullish strength.
🔹 The index remains confined within a large rising wedge, as seen on the chart. This type of structure often signals topping and potential reversal rather than sustainable upside momentum.
What’s Next?
In the medium term, I expect a drop below 20,000. For traders looking to speculatively trade the Nas100, potential sell zones would be around 22,000 and 23,000— in the event of a new all-time high.

Nasdaq market analysis: 25-Feb-2025Let’s dive into today's Nasdaq market analysis. Share insights, and potentially spot opportunities for good pips.

NAS100 Analysis: Key Levels & Bearish Trade Setup📊 NAS100 Analysis and Trade Idea | Key Levels & Bearish Bias Explained 📉
Dive into a detailed analysis of the NAS100 (NZ 100) with a focus on key support zones, retracement levels, and a bearish trading bias. Learn how to identify overextended price movements, imbalances, and potential short setups using the daily and 4-hour timeframes. Perfect for traders looking to refine their strategies in indices trading! 💡 💬 Share your thoughts and trading ideas in the comments below!

Is the NAS100 Setting Up for a Reversal? Here’s My Game Plan!👀 👉 In this video, we break down the US100, which appears overextended after pushing into a key weekly high. A significant retracement could be on the horizon this week. I’ll walk you through my trading strategy, covering breakout trades and trend continuation setups. 🚨 *Not financial advice.

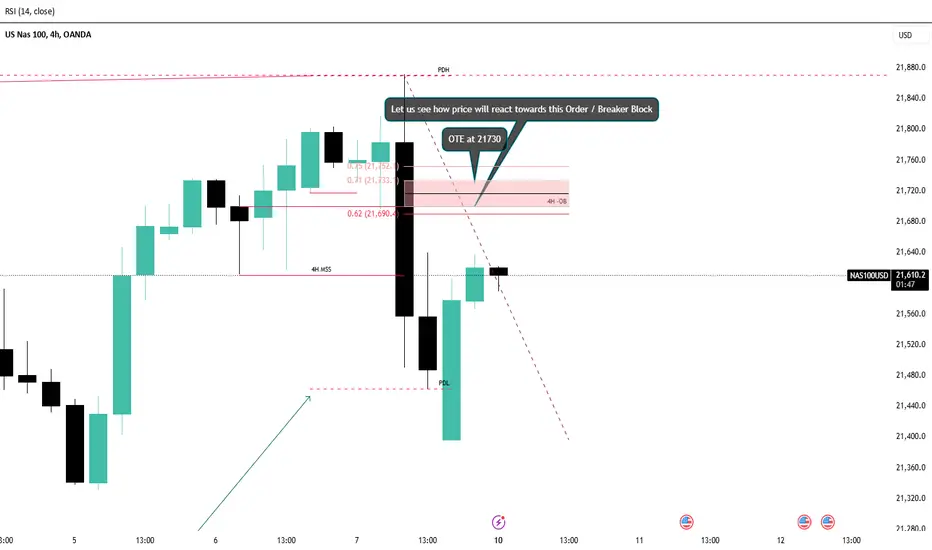
NASDAQ ShortBased on the previous analysis, I am still bearish biased and my entry might be based around the 4H Order / Breaker lock at around 21730.
If it respects it, then we will be on a bearish run. If not, we might look for a buy setup towards the All Time High
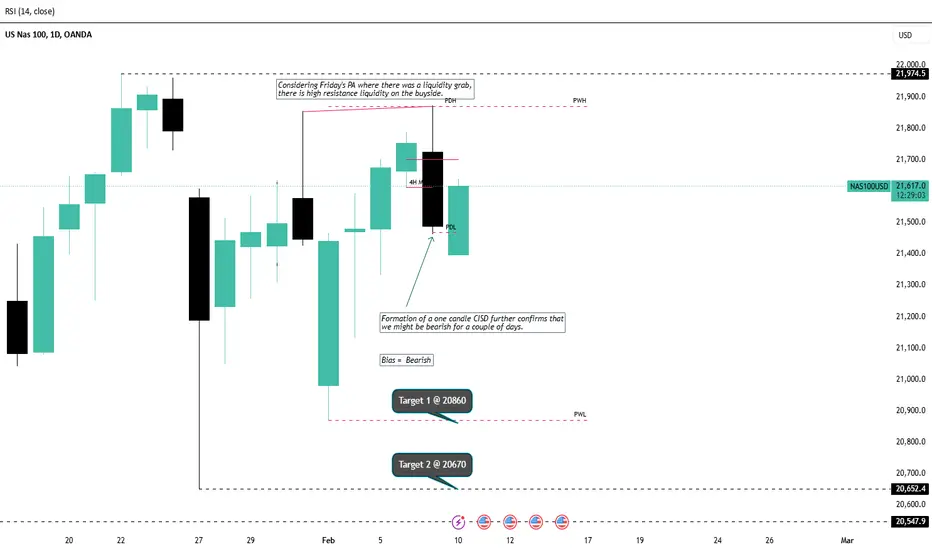
NASDAQ SHORTConsidering Friday's PA where there was a liquidity grab,there is high resistance liquidity on the buyside. Formation of a one candle CISD further confirms that we might be bearish for a couple of days.
We will delve into the smaller timeframe (4H & 1H) to have our entry position and our targets will be at 20860 and 20670
NASDAQ 100 Hits Key Resistance: Is a Retracement Imminent?In this video, I analyze the NASDAQ 100 (#NAS100) as it trades into a key resistance level, appearing overextended on the 4-hour timeframe. I discuss the potential for a counter-trend trade, targeting a retracement to the 50% Fibonacci level of the previous price swing. Watch for insights and strategies on navigating this setup! Not financial advice.

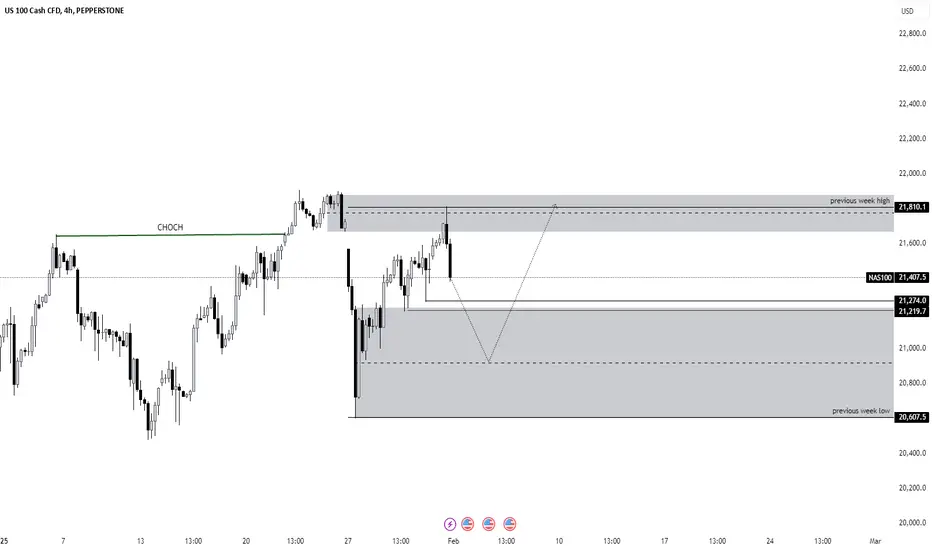
NAS100 1st week of FEB expectationI am forecasting that NAS should go down to the demand zone taking out IRL and then react off the demand zone and head up to the supply zone. the demand zone is also in the discount zone of the range adding more confluence. this week is tricky as NAS is respecting both supply and demand zones so it it unclear if price will break above supply
Bearish Shift in NAS100: What’s Next for the US100 Trend?👀 👉 In this video, we take an in-depth look at the NAS100, analyzing its trend, market structure, price action, key support and resistance zones, and how liquidity is influencing the market. Currently, the US100 is approaching an important support level following a bearish market structure shift. We discuss possible strategies if the trend continues. All the details are covered here. Please note, this is not financial advice.

Buy or Sell? Read the caption. I told you...Hello guys
We came with NAS100 analysis.
Due to the heavy selling that has happened now, we need to maintain the defined twin bottom range to maintain the upward trend.
Otherwise, the drop will continue up to the specified limits.
Now, if the price is supported, you can see its growth up to the specified areas.
*Trade safely with us*
Uptrend or Reversal? Unpacking a Case for NAS100! The NAS100 has been trending bullish recently, but when we zoom out to a higher timeframe, there’s a case to be made for a potential bearish opportunity. In the video, we explore the trend, price action, and market structure, analyzing how it’s approaching a key resistance level. We also discuss a possible trade setup if the conditions align. This is not financial advice.

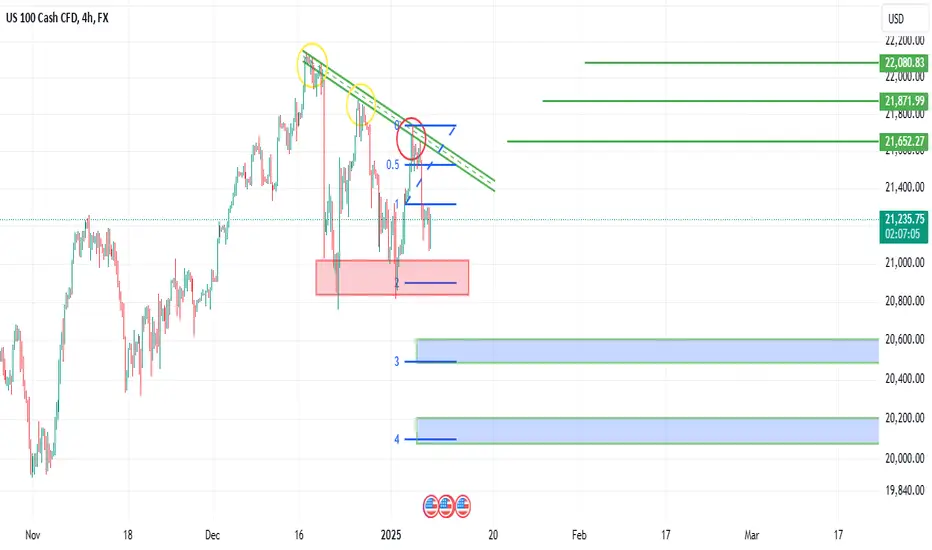
Nas100- Important close for the weekAfter reaching an all-time high in mid-December last year, the NAS100 began a correction characterized by choppy price action.
This Monday, the index formed a local low, aligning closely with the previous all-time high. Since then, NAS100 has rebounded strongly.
Currently, the index is testing the falling trendline originating from the mid-December high.
A breakout above this trendline could indicate that the correction has ended, paving the way for new highs and potentially a fresh all-time high in the first quarter of 2025.
I remain bullish on NASDAQ as long as Monday's low holds as a key support level.

NAS 100 Counter-Trend Opportunity: Possible Bounce from Support 📊 The NAS 100 looks overextended right now. It’s tapped into a key liquidity pool support zone, and I’m eyeing a potential counter-trend trade back up to equilibrium. ⚖️ After that, we could see another sell opportunity if the price action aligns. 🚨 *This is not financial advice.*

Nasdaq market analysis: 10-Jan-2025Let’s dive into today's Last Nasdaq market analysis 2024. Share insights, and potentially spot opportunities for good pips.

NAS100 on Pause: Focused on Scalping Until NFP Shifts the Market👀 👉 The NAS100 has been stuck in a range and lacks a clear trend at the moment. Currently, I only see potential for scalping opportunities. With NFP coming up tomorrow, I’m leaning toward staying on the sidelines and waiting to see if a US100 trend develops next week, which could present some profitable setups for the NASDAQ. ⚠️ This material is for educational purposes only and should not be considered financial advice.

NAS 100: Bullish Trend with Year-End Pullback - Where To Next?In this video, I analyze the NAS 100 on higher timeframes, starting with a quick top-down review to explore a potential trade setup. The three-week and weekly charts indicate a bullish trend; however, as we approach the end of the year, there’s some pullback and uncertain price action. I share my insights on the current market conditions and discuss a possible trade idea. Please note, this is not financial advice.

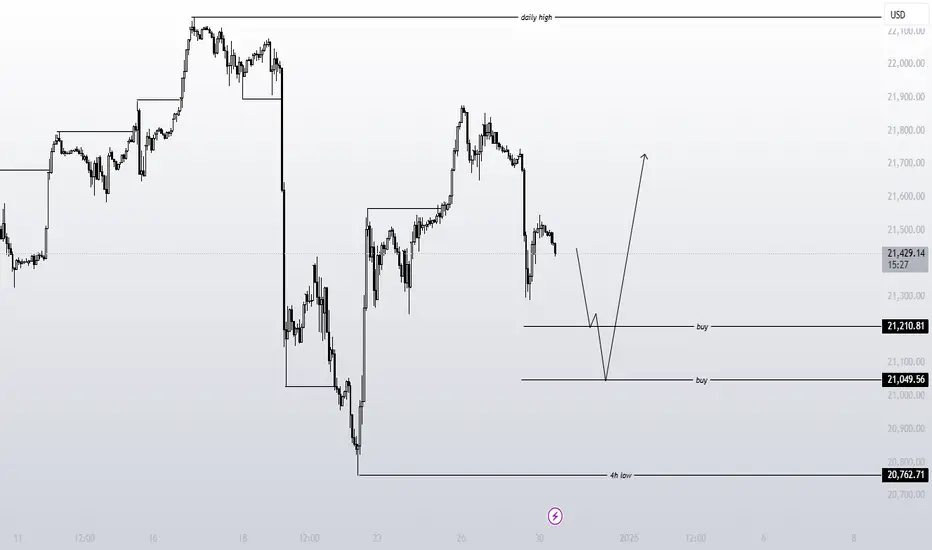
NAS100 update and buy setupOn our last analysis of NAS100, we were bearish and managed to place sell trades as per our strategy. We are still holding those positions because we are still bearish and we would eventually like to target the 4H low. However, we will be prepping ourselves to take buy positions as per our strategy, while still holding those sell positions. If you want to learn more about how our strategy works, visit our page on X. The link is in the bio.
NAS100 Sell setup updateOn our last analysis of NAS100, we were bearish for the longer term and we were waiting for price to reach our area of interest where we would be looking for selling opportunities. Price did indeed push till our area of interest and we managed to place sell trades as per our strategy.
