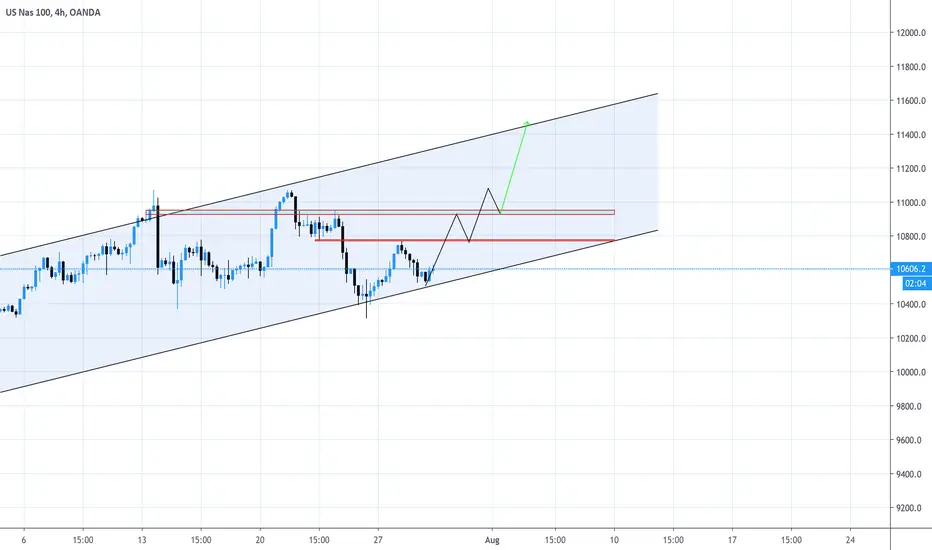
NAS100 - Long ideaNASDAQ has ben boomin for the last 2,3 weeks so.. why not follow the trend and start looking for buy opportinuties? I'm suspecting that price can find support of the previous level of resistance and then go right back up to 11258-ish before falling back down.. stay consistent and follow the trend it is your friend :)
Nas100long

NAS100 Short analysis Currently Looking for some order to get filled down a the previous HL. but lets see.

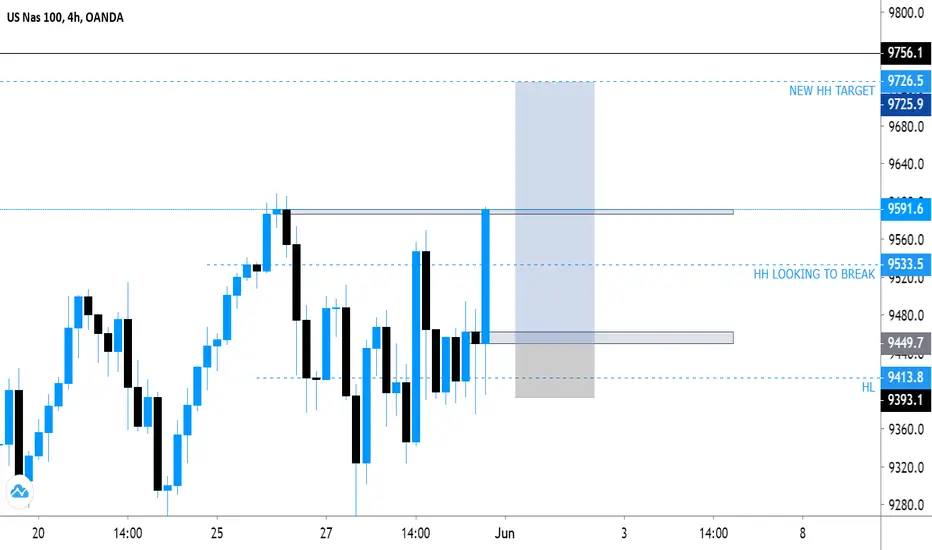
BULLISH MARKET ON NAS100ENJOY THESE BUYS ON NAS100. PRICE RECENTLY MADE A HIGHER LOW. AND WILL PUSH UP TO MAKE A NEW HIGHER HIGH!!!!!
Swing Trade Im already in profits wont move Stop Loss until Tuesday, I will secure partials at 150 pips
"EXAMINE THE MARKETS LIKE A SCIENTIST, BUT TRADING IS AN ART" - @TradingTrav
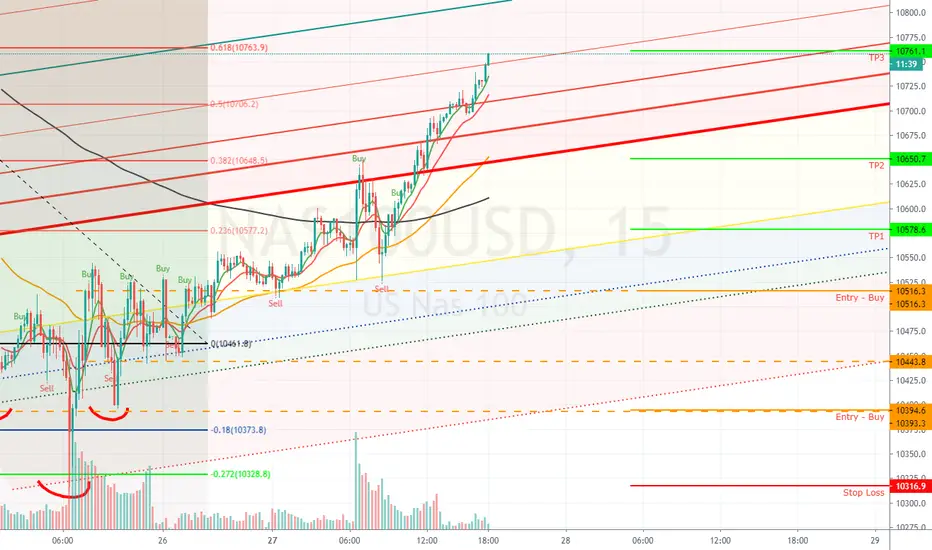
NAS100 - LongCurrently in a uprtend.. we can see price is trying to brake of a very important resistance level.. it broke above it and it came back for retest.. so i went to the 15 min chart and saw a fib rejection thats why i decided to go long plus we have MA crossover

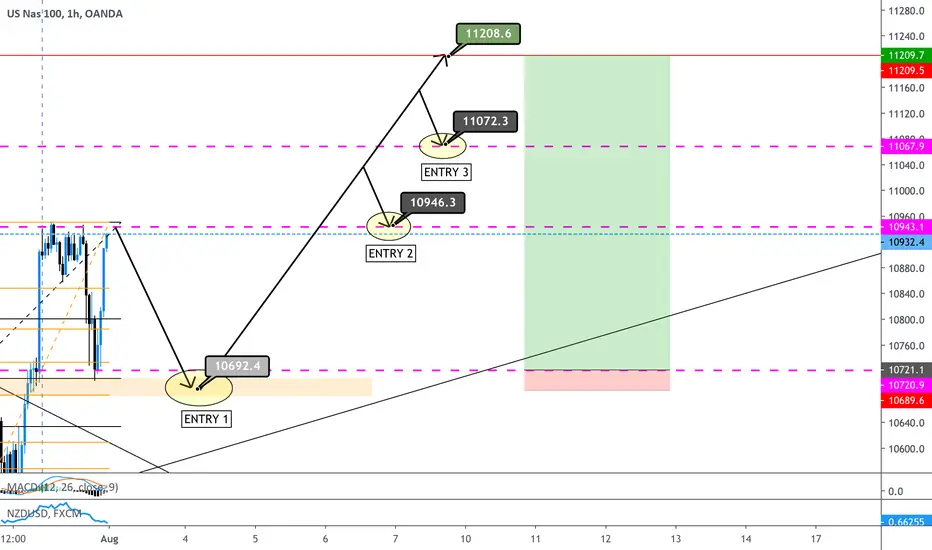

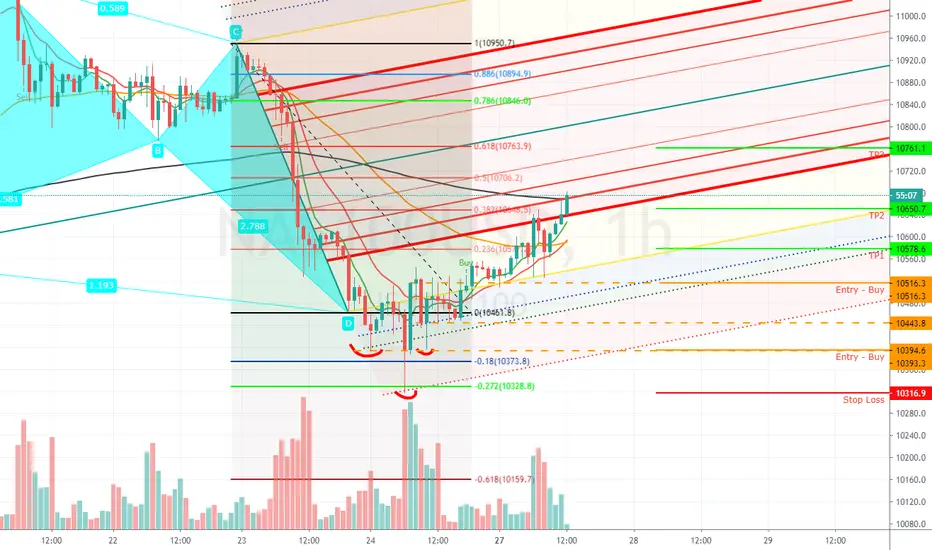
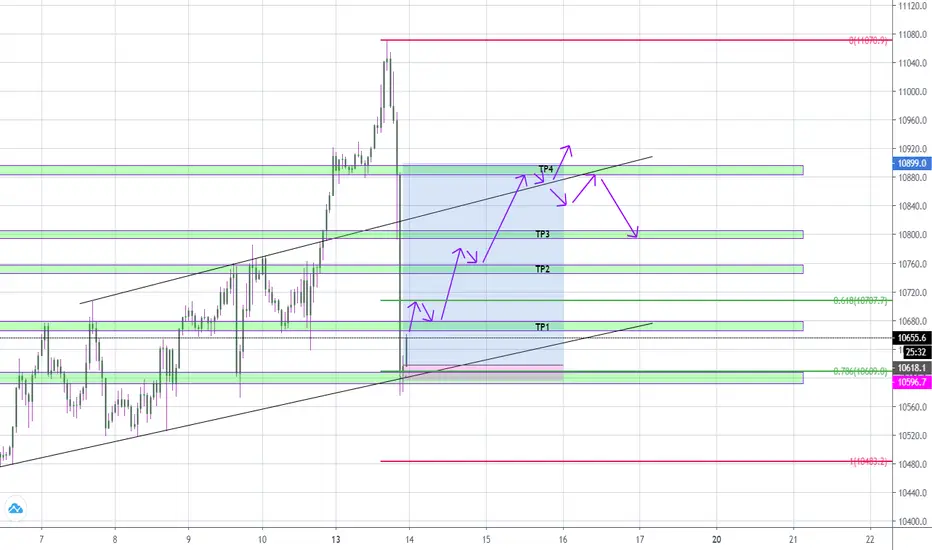
Update NAS100 TP3 HitJust an update on NAS100 TP3 hit, looking for price to push all the way to the media of the PF.
Update NAS100 TP2 HitWe are moving very strongly northward. You can see we have gone from the outer parallel to just crossing over the .382 of the PF. Updates will be provided as we progress. I have secured profit and riding this upward.
UPDATE - NAS100 TP1 hitJust doing an update on my NAS100 trade idea. TP1 has been hit. Currently, the price is playing between the 13 and 50. 1H is bouncing off of an upward rally line and we are at equilibrium (doji-developing). I am still looking for price to push up to the highs seen last week before the market fell on Friday.
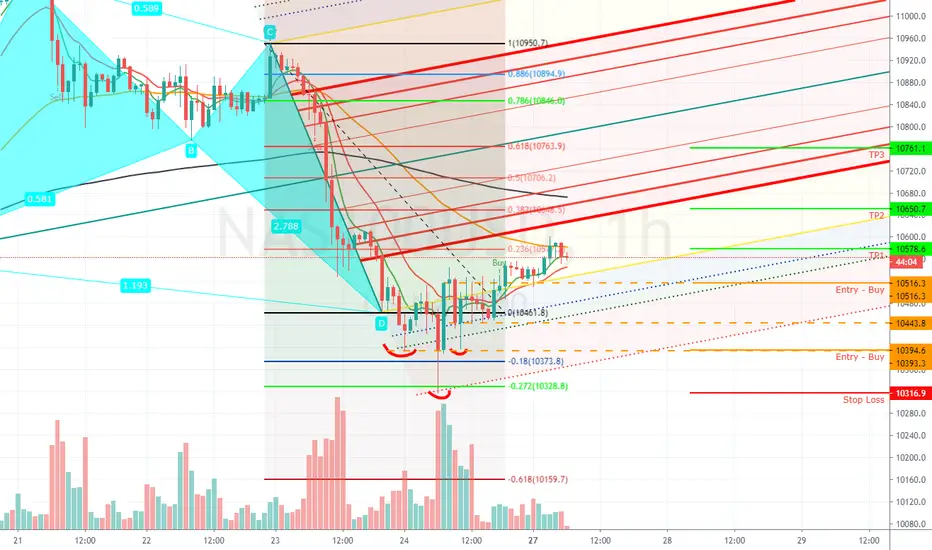
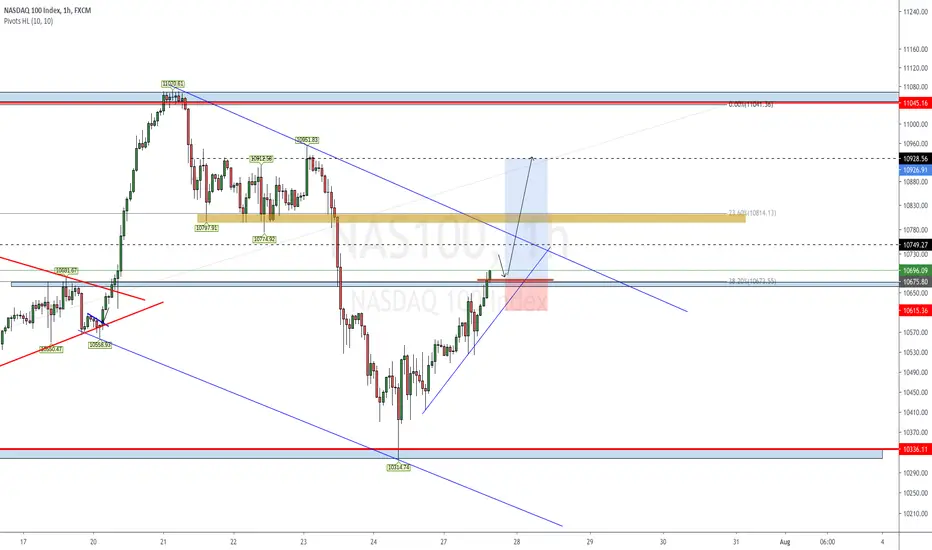
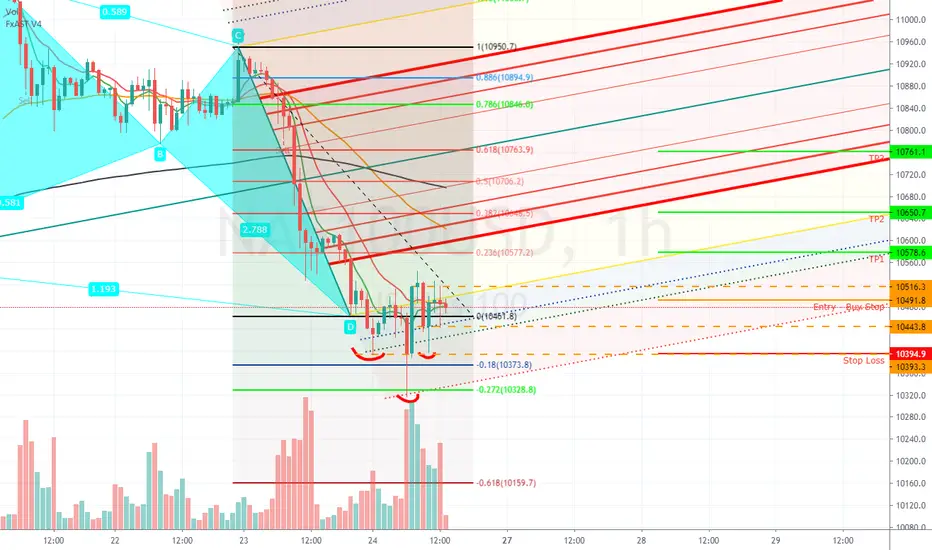
NAS100 unfilled Harmonic PatternI like this because we have a lot of messages telling us that price wants to go long. What we have here is an inverted buddha temple/inverted head and shoulders pattern.
From the left side of the pattern, we can see that we had a healthy wick off of support, then an engulfing bullish candle. There wasn't enough bullish STRENGTH to engulf the left side bearish candles that started the downward movement (yet), so we see that doji at the top and then a bearish engulfing doji, doji, bearish hammer (dumpling top/"ugly" evening star pattern). This next move with the bullish engulfing candle ENGULFED all of the previous movements and formed a bullish belt top pattern. The next evening star pattern move by the bears didn't have enough strength to take out the last step by the bulls, and we see right after that a nice hammer (all at support 10393.3) forming the right side of the pattern.
We see that as the price continued before the close on Friday that we round resistance at the top of the bullish belt top. My trading range is between 10516.3 - 150393.3, with 10443.8 being the halfway point. I am not "expecting" price action to come back down past that area, but if it does, I have a pending buy limit at the bottom.
NASDAQ - THOUGHTS FOR THE WEEKMy weekly review. Last week review was 100% accurate. We hope for more, but bear in mind 100% is always guaranteed because we do not own the market, we trade the market.

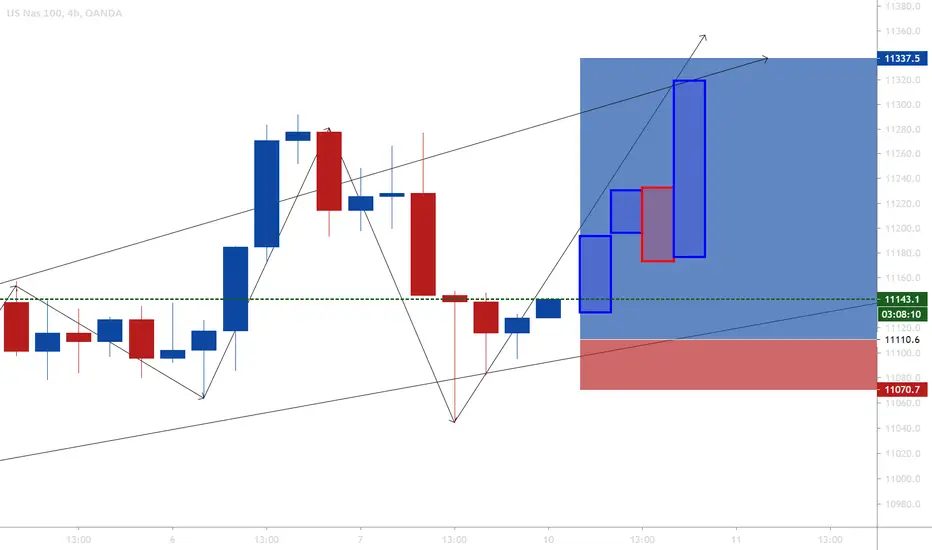
Butterfly Harmonic on NAS100 Potential Long EntryLooking to go long on NAS100 when price UTURNs to activate buy stop. Details on Chart.

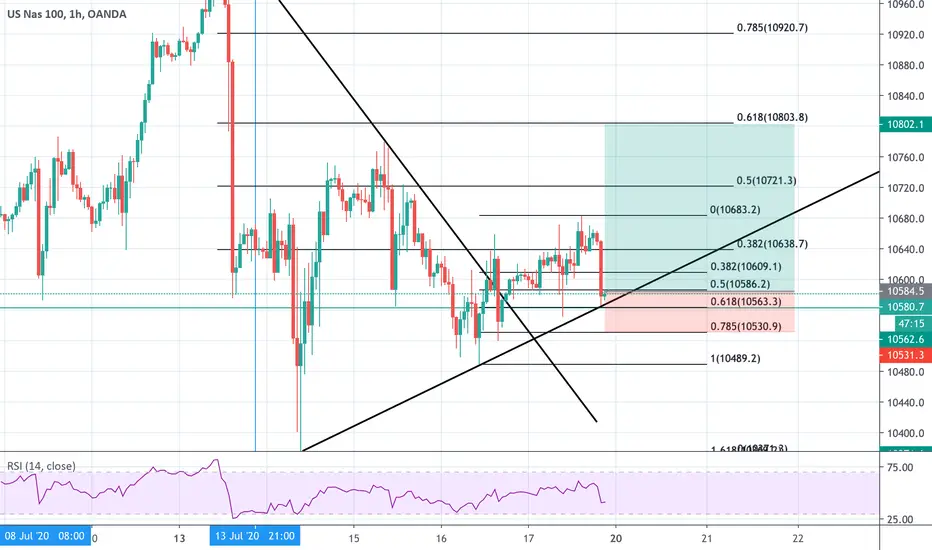
NAS Going LongIt just tapped the trend line on a reversal. Fib lines match up perfectly to buy at a discount. Time to go long before the market opens at they beat us to it
NASDAQ- My Plans for todayI am trading breakouts today. Please remember to trade carefully, apply proper risk management and remember if you use my idea, it's completely at your own risk.


Bought the dip!Started climbing whist I was analysing. I gave around 60-70 pips on eurusd and 60 pips on oil today. Lets make it rain pips with this!.

NAS100USDI just added a new position in this trade. Got in NAS100 scalp & long term. Overall I feel that NAS will come down in the next couple months but for now it’s still bullish.
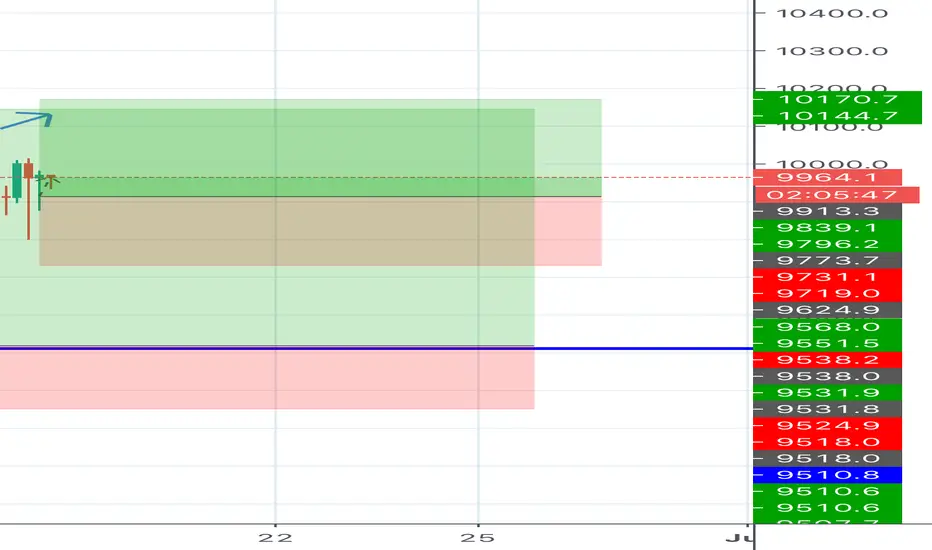

NASDAQ BUY IDEASYOU WILL BUYU AFTER THE RETRACEMENT BUT PLEASE WAIT FOR THE NEWS BEFORE YOU TAKE THE TRADE
ENTRY PRICE - 9580.5
TAKE PROFIT - 9736.6
STOP LOSS - 9501.6
FOLLOW ME FOR MORE OF NASDAQ IDEAS

NAS100 BUY Possible pullbac into 9480.0 ? If so then I'm looking to buy Nas100 all the way to 9760.0