US100 H4 - Sell SignalUS100 H4
Working from the slightly larger timeframes at the moment, as we are trying to block out the market open gaps/noise and surrounding factors. If the dollar is looking to trade closer to 103.000 we could see NAS fall in the short term and continue, but we could also see the correction unfold for the dollar.
At the moment, we are in no mans land, we are neither confident in longs or shorts, we are merely just waiting for a little bit more confirmation on where we are heading, so we can then try and measure opportunity accordingly. Hopefully we can see something for consideration around the time of US market open.
Nas100short
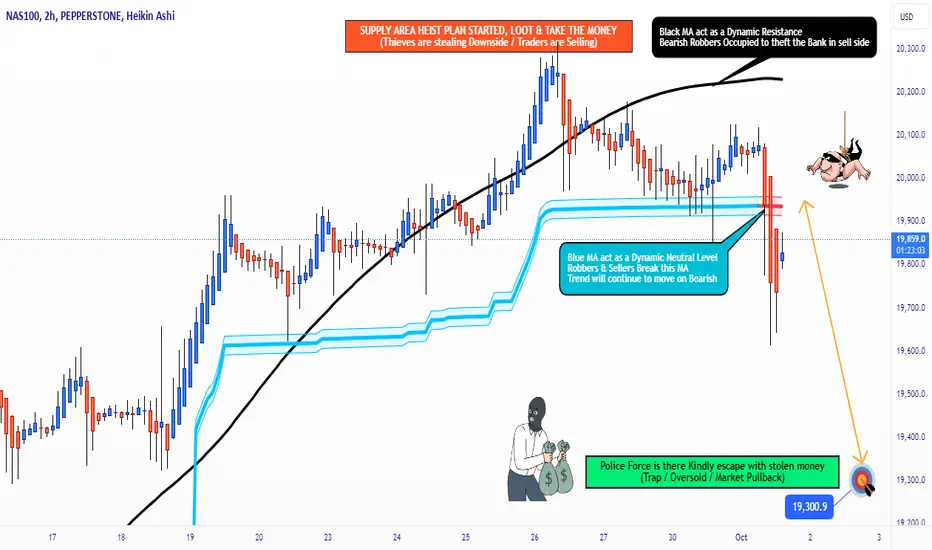
NAS100 / US100 "NASDAQ" Market Money Heist Plan on Bearish SideHallo My Dear Robbers / Money Makers & Losers, 🤑💰
This is our master plan to Heist NAS100 / US100 "NASDAQ" Market based on Thief Trading style Technical Analysis.. kindly please follow the plan I have mentioned in the chart focus on Short entry. Our target is Green Zone that is High risk Dangerous level, market is oversold / Consolidation / Trend Reversal / Trap at the level Bullish Robbers / Traders gain the strength. Be safe and be careful and Be rich 💰.
Entry : Can be taken Anywhere, What I suggest you to Place Sell Limit Orders in 15mins Timeframe Recent / Nearest Swing High
Stop Loss 🛑: Recent Swing High using 2h timeframe
Attention for Scalpers : If you've got a lot of money you can get out right away otherwise you can join with a swing trade robbers and continue the heist plan, Use Trailing SL to protect our money 💰.
Note: If you've got a lot of money you can get out right away otherwise you can join with a swing trade robbers and continue the heist plan, Use Trailing SL to protect our money 💰.
Warning : Fundamental Analysis news 📰 🗞️ comes against our robbery plan. our plan will be ruined smash the Stop Loss. Don't Enter the market at the news update.
Loot and escape on the target 🎯 Swing Traders Plz Book the partial sum of money and wait for next breakout of dynamic level / Order block, Once it is cleared we can continue our heist plan to next new target.
Support our Robbery plan we can easily make money & take money 💰💵 Follow, Like & Share with your friends and Lovers. Make our Robbery Team Very Strong Join Ur hands with US. Loot Everything in this market everyday make money easily with Thief Trading Style.
Stay tuned with me and see you again with another Heist Plan..... 🫂
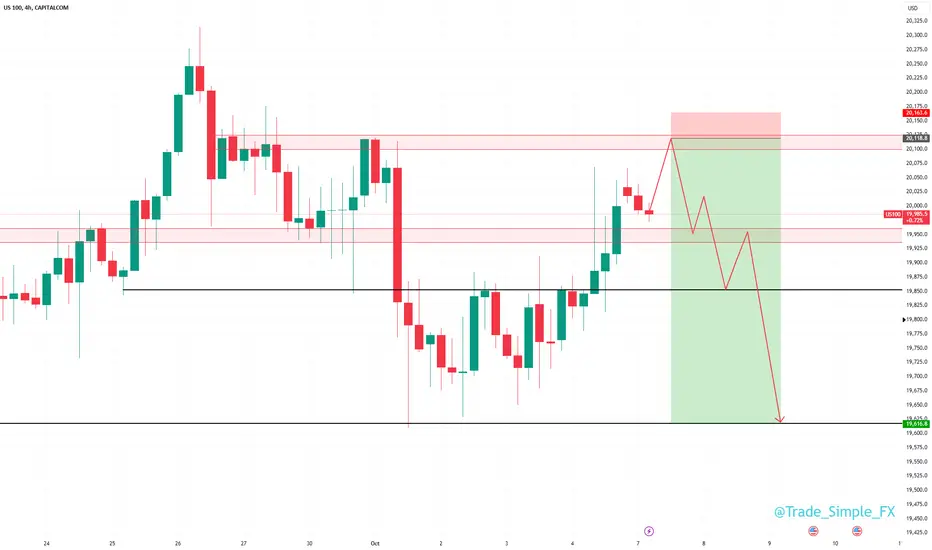
#NAS100 4HNASDAQ 100 (NAS100) 4-Hour Chart Forecast:
The NASDAQ 100 index (NAS100) is displaying bearish potential on the 4-hour chart, suggesting a possible sell opportunity. The price is currently testing a
key resistance level, and a retest of this level may offer a favorable entry for a short position.
Key factors supporting the sell forecast:
Resistance Retest: The price has approached a significant resistance level and is showing signs of hesitation. A retest of this zone could confirm its strength as resistance, making it an attractive level to initiate a sell position if the market fails to break higher.
Bearish Pattern Formation: The chart might be forming a bearish technical pattern, such as a double top or head and shoulders, signaling the potential for a downside move after the retest of resistance.
Momentum Indicators: Technical indicators like the RSI or MACD could be showing bearish divergence or overbought conditions, hinting at a possible reversal from the resistance level.
Traders should wait for a confirmed retest of the resistance level before entering the sell trade. A clear rejection from the resistance zone would strengthen the bearish case. Stop-loss orders should be placed above the resistance level or recent swing highs to manage risk, while profit targets can be set at key support levels or previous lows. However, traders should remain cautious and monitor for any signs of a breakout above resistance, which would invalidate the bearish outlook. Overall, the technical setup favors a sell strategy for NAS100 on the 4-hour chart, pending a successful retest of resistance.

#NAS100USD 1HNAS100USD 1-Hour Chart Analysis
Pattern Identified: Bearish Market Bias with Sell Focus on Pullbacks
Forecast: Sell
Outlook for Next Week: Good Luck
On the 1-hour chart of NAS100USD (NASDAQ 100 Index), the market bias is strongly bearish, indicating a downward trend in price action. Given this bearish environment, the strategy focuses on looking for opportunities to sell during pullbacks. Pullbacks are temporary reversals in the opposite direction of the prevailing trend, offering entry points for short positions before the market resumes its downward movement.
By identifying areas of resistance and key levels during these pullbacks, traders can time their entries more effectively, taking advantage of price retracements before the bearish momentum reasserts itself.
Actionable Insight: Traders should be patient and wait for pullbacks or retracements towards resistance levels or prior support-turned-resistance zones to initiate sell positions. It’s crucial to monitor these levels closely, as a failure to respect them could signal a potential shift in trend. Proper risk management, such as stop-loss placement above resistance areas, is essential to mitigate losses in case of unexpected market movements.
Good Luck for the Next Week: Stay focused, and may your trades be profitable!

NAS100 Technical Analysis and Trade Idea (NASDAQ)👀 👉 Here's my take on the current NAS100 (NASDAQ) situation:
NASDAQ-100 Technical Outlook
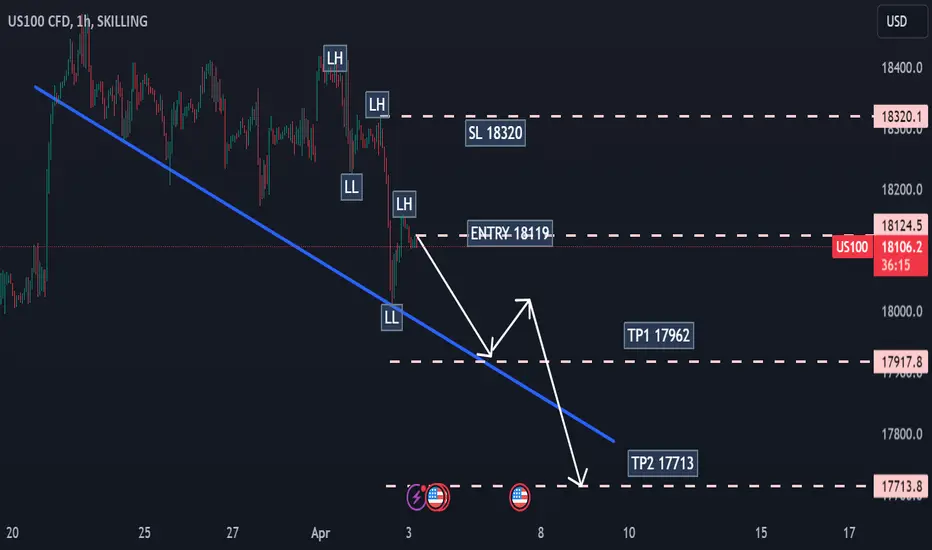
The NASDAQ-100 index is showing signs of weakness on the 4-hour chart, with a notable shift in market structure. We're seeing a pattern of lower highs and lower lows, which typically signals bearish momentum. This could potentially drive prices down to test previous support levels.
Key Levels and Entry Strategy
I'm currently eyeing a short entry, but I'm not jumping in just yet. My strategy is to wait for a clear break of the current structure, followed by a retest of the range lows. This approach allows for a more favourable risk-reward ratio and increases the probability of a successful trade.
Broader Market Context
Seasonal Patterns
Historical data reveals an interesting seasonal trend: bears have often dominated the market from mid-September onwards over the past 5-6 years. This aligns with our current technical outlook and adds weight to the bearish thesis.
Technical Indicators
The MACD is showing a bearish signal on the daily chart, further supporting our downside bias . Additionally, the RSI at 55.95 suggests there's still room for downward movement before we hit oversold territory.
Trade Idea
Given the technical setup and seasonal tendencies, I'm looking to short the NAS100 on a break and retest of the current range lows. Key resistance levels to watch are around 17,511 (50-day moving average) and 17,480 (20-day moving average).
Remember, while this analysis provides a solid foundation, always conduct your own due diligence and adhere to strict risk management principles. The tech sector can be volatile, so position sizing is crucial. 📉✅

NAS100 1:6RR trade ideaIn the recent rate cuts and CPI news, the stocks have gained impulsively(Technology sector up +6%). The overall trend is still bearish as we expect to see a 7-10% correction in the stock market in September. Currently NAS100 has reached our level of interest(19450), which has been a strong support/resistance level in the past. Here we look for shorts targeting 19250 and 19100. Should we break 19450, we look for buys up to 20k. Will update next week.
As always, trade safe and expect the unexpected.
Fractals Trading Community,
Mei
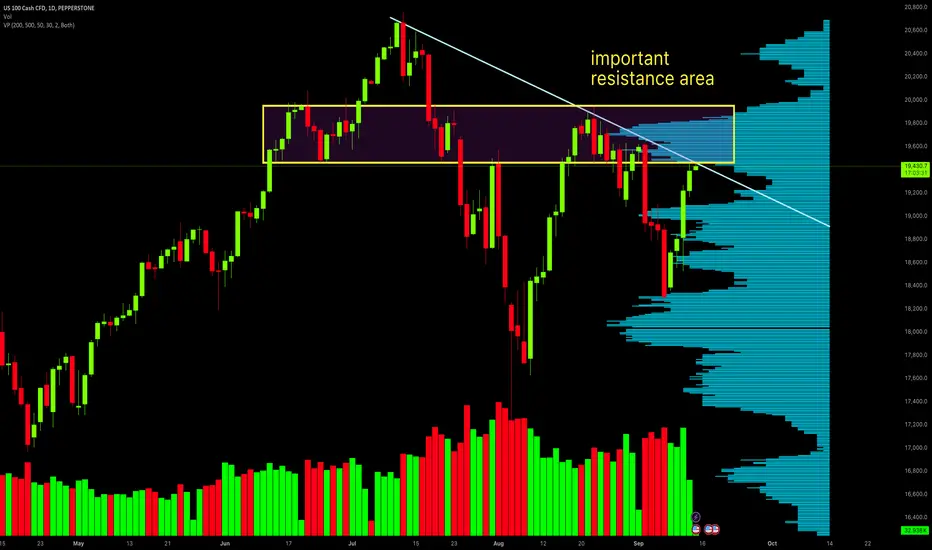
Nas100 not easy to continue go bullish?
Nas100 stock price is closing to the downtrend line, which shares the similar resistance area with Chips concentration area.
therefore, this resistance area is very important, and it might be not easy to be broken above.
NAS100 Technical Analysis and Trade Idea US100 NASDAQ👀👉 The NAS100 has broken key structural support on the daily and 4-hour charts, signaling potential bearish momentum with the NASDAQ. I expect this downward move to extend towards previous lows, as highlighted on the chart. However, my approach is to wait for a bullish retracement early in the week, aiming to catch a reversal that confirms an entry for a short position.
It's important to note that this analysis is based on probabilities, not certainties. Always wait for price confirmation before executing any trades, as discussed in the accompanying video. The analysis provides a comprehensive overview of current price action, trend direction, and market structure. Keep in mind, this is for educational purposes only. Trading carries inherent risks, so make sure you have a solid risk management plan in place at all times. 📈✅

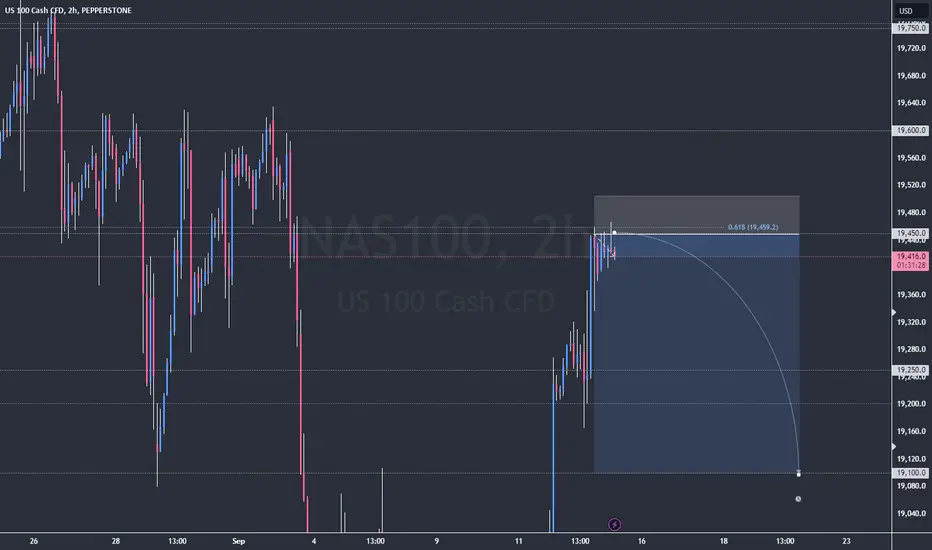
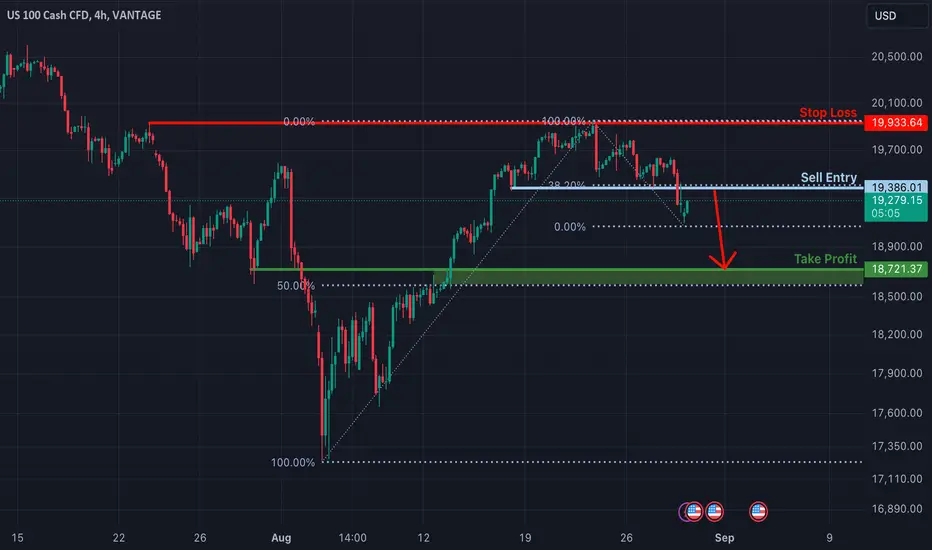
Bearish drop?NAS100 is rising towards the resistance level which is a pullback resistance that lines up with the 38.2% Fibonacci retracement and could reverse from this level to our take profit.
Entry: 19,386.01
Why we like it:
There is a pullback resistance level which lines up with the 38.2% Fibonacci retracement.
Stop loss: 19,933.64
Why we like it:
There is a pullback resistance level.
Take profit: 18,721.37
Why we like it:
There is a pullback support level which is slightly above the 50% Fibonacci retracment.
Please be advised that the information presented on TradingView is provided to Vantage (‘Vantage Global Limited’, ‘we’) by a third-party provider (‘Everest Fortune Group’). Please be reminded that you are solely responsible for the trading decisions on your account. There is a very high degree of risk involved in trading. Any information and/or content is intended entirely for research, educational and informational purposes only and does not constitute investment or consultation advice or investment strategy. The information is not tailored to the investment needs of any specific person and therefore does not involve a consideration of any of the investment objectives, financial situation or needs of any viewer that may receive it. Kindly also note that past performance is not a reliable indicator of future results. Actual results may differ materially from those anticipated in forward-looking or past performance statements. We assume no liability as to the accuracy or completeness of any of the information and/or content provided herein and the Company cannot be held responsible for any omission, mistake nor for any loss or damage including without limitation to any loss of profit which may arise from reliance on any information supplied by Everest Fortune Group.
NAS100 Technical Analysis and Trade Idea NASDAQ👀👉 Our analysis is centered on the NAS100, which has shown bullish momentum on the daily and 4-hour timeframes. However, with the price now at a resistance level, we anticipate a potential pullback to the Fibonacci 50% to 61.8% retracement levels.
We incorporate key elements of technical analysis, including trend evaluation, price action, and market structure. Additionally, we will outline a potential trade setup and discuss strategies to approach it with a higher probability of success.
Please note that this analysis is provided for educational purposes only and should not be considered financial advice. The insights shared are speculative and do not guarantee future market behavior. We strongly recommend verifying current price actions before making any trading decisions.
This presentation offers an in-depth examination of the current trend, market structure, and price movements. However, it's important to understand that while the content is educational, it does not guarantee trading success. The foreign exchange market carries significant risks, and we strongly stress the importance of implementing robust risk management strategies in all trading activities.
We urge you to conduct thorough research and exercise careful consideration before making any trading decisions. Stay informed, remain vigilant, and approach the markets with a well-prepared strategy. 📊✅

NAS100 Technical Analysis - NASDAQ Next Move👀👉 In this video, we take a close look at the NAS100 currency pair, which has shown bullish momentum on the 4-hour time frame but now seems to be overextended. I’m expecting a potential pullback with the US100 to the Fibonacci 50% to 61.8% retracement levels. We cover the trend, price action, market structure, and other key elements of technical analysis. Additionally, we explore a potential trade setup and, crucially, how to approach it with a higher probability of success.
As always, this video is for educational purposes only and should not be considered financial advice. It's essential to recognize that these insights are speculative and not guaranteed predictions. Make sure to verify specific price actions before executing any trades, as highlighted in the video. The analysis offers an in-depth look at the current trend, market structure, and price movements. Remember, this content is for educational purposes and does not guarantee success. Trading involves significant risks, so always apply robust risk management strategies. 📊✅

NAS100 Technical Analysis and Trade Idea US100 👉🔍 Looking at this NAS100 chart, we can clearly see that the price has broken a 4-hour downtrend. There is a noticeable break in market structure to the upside, followed by a significant rally with the US100. It has now reached a resistance level, and I'm anticipating a retracement back down into the 50% to 61.8% Fibonacci levels, where I'll be looking for a NASDAQ potential buy opportunity if the price action described in the video unfolds.
It's important to note that these observations are speculative and not a definitive forecast. Confirming specific price movements is crucial before making any buying or selling decisions, as explained in the video. The video provides a comprehensive analysis of the current trend, market structure, and price dynamics. Remember, this educational content is designed to enhance understanding and does not guarantee outcomes. Trading inherently involves substantial risks, so employing robust risk management techniques is essential. 📈🔔

NAS100 I Break of daily support level 19,467Welcome back! Let me know your thoughts in the comments!
** NAS100 Analysis - Listen to video!
We recommend that you keep this pair on your watchlist and enter when the entry criteria of your strategy is met.
Please support this idea with a LIKE and COMMENT if you find it useful and Click "Follow" on our profile if you'd like these trade ideas delivered straight to your email in the future.
Thanks for your continued support!Welcome back! Let me know your thoughts in the comments!

NAS100 NASDAQ Technical Analysis and Trade Idea US100👉🔍 In this video, we analyze the NAS100 index. It's evident that the NASDAQ has been showing strong upward momentum in a bullish trend. However, considering today is Friday, I anticipate a potentially sharp retracement with the US100. My strategy involves monitoring the 15-minute chart for signs of sideways movement and a potential reversal, which could present a selling opportunity targeting the previous swing low.
It's important to note that these observations are speculative and not a definitive forecast. Confirming specific price movements is crucial before considering any buying or selling decisions, as elaborated in the video. The video provides a comprehensive analysis of the current trend, market structure, and price dynamics. Remember, this educational content is designed to enhance understanding and does not guarantee outcomes. Trading inherently involves substantial risks, so employing robust risk management techniques is essential. 📈🔔

NAS100 (NASDAQ US100) Technical Analysis and Trade Idea👉 In this analysis, we focus on the higher time frame charts for the NASDAQ 100 index. Currently, the charts indicate a bullish outlook. However, it’s important to note that this assessment is speculative and not a definitive prediction. To confirm a true reversal, we must closely monitor specific price movements. The accompanying video provides an in-depth analysis of the trend, market structure, and price action. Remember that trading carries substantial risk, so always prioritize robust risk management strategies in your decision-making process. 📊✅

SELL NASDAQIn the morning I posted to buy NASDAQ, and while waiting for the market to reach our entry it turned out to make us a BB and now we're getting in a short trade.
Follow for more!

nas100 institutional tactics setupnas100 1:4,5 Risk reward setup
if you like my idea please hit the like button follow and subscribe wish you good luck and good trading
Show some Love Peace brothers and sisters
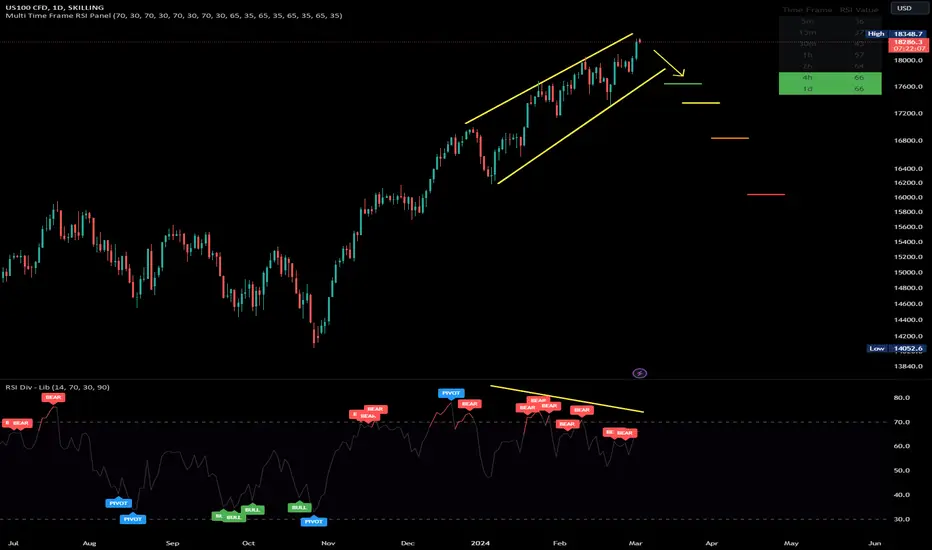
❌possibility of correction is very high❌Strong divergence can be seen in the indicators. The possibility of correction is very high. I do not look at buying situations at all
NAS100 Technical Analysis and Trade IdeaIn the video, we explore a potential trading opportunity in the NAS100 index. Our analysis involves assessing the current trend, studying price fluctuations, evaluating market structure, and identifying a potential entry point under favourable conditions (if they occur), as explained in the video. Remember to integrate robust risk management principles into your trading strategy. As always, please note that this information is purely for educational purposes and should not be interpreted as financial advice.

Nasdaq - In Bearish TrendNasdaq following the Berish Trend making LH and LL also respecting the bearish trendline.
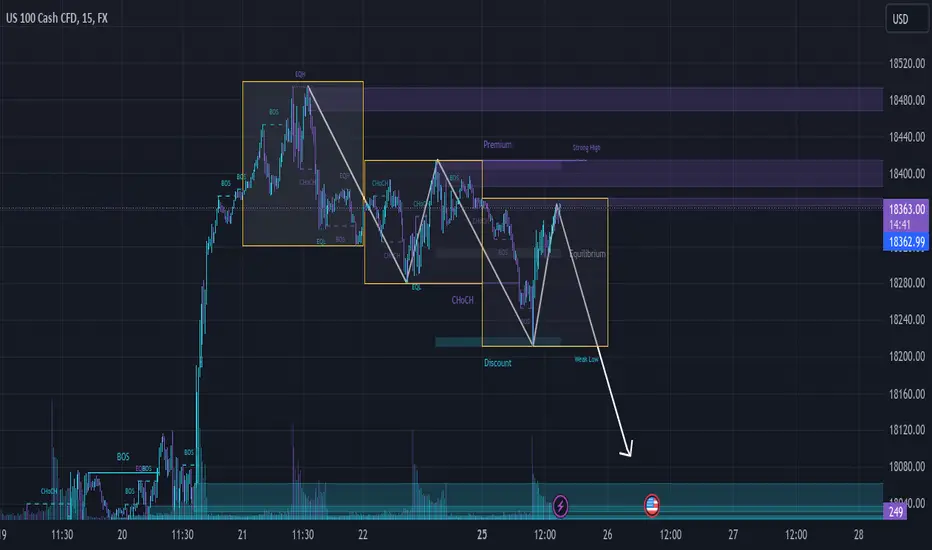
Possible sell opportunity on NASDAQwere on a 3rd day of push to the downside, also currently in the golden zone and also in Premium zone. On the 4H & 15 min time frame weve reached order blocks. Id go for a 1:2 RR for this just to keep it light since this still is an uptrend. If it goes beyond the 2nd leg the trade will be invalid
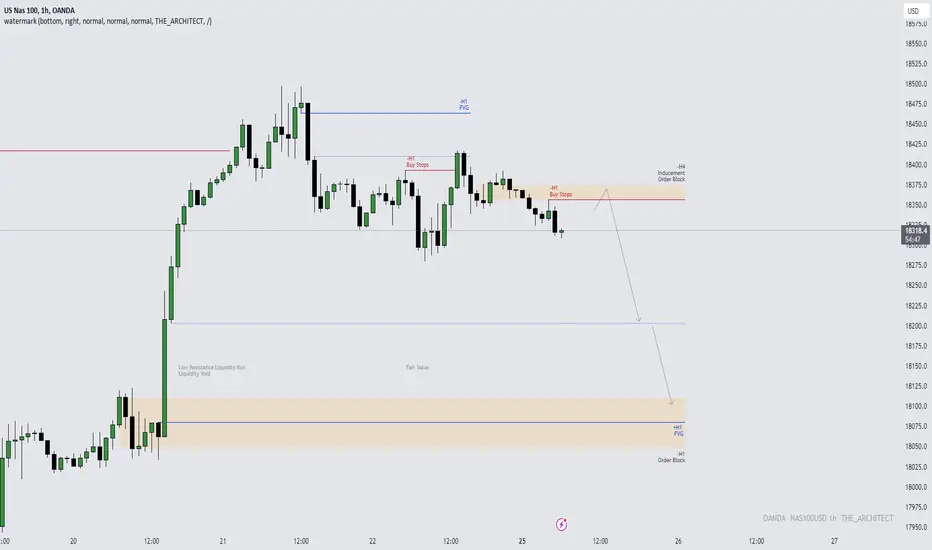
NAS100USD: Exploring Potential Sell OpportunitiesCurrently, NAS100USD shows signs of a potential sell-side draw towards the H1 Bullish Order Block . This hypothesis is reinforced by several confluences, notably the presence of inefficiencies such as Liquidity Void and Fair Value Gaps at discount prices, which typically signal opportune moments for smart money to capitalize on profits.
For confirmation of entries, we await a pullback into the H4 Bearish Order Block, which also features Buy Stop Liquidity below it, serving as our selling target.
Stay tuned for an in-depth video analysis of NAS100USD to further dissect this potential trading opportunity.
Kind Regards,
The_Architect
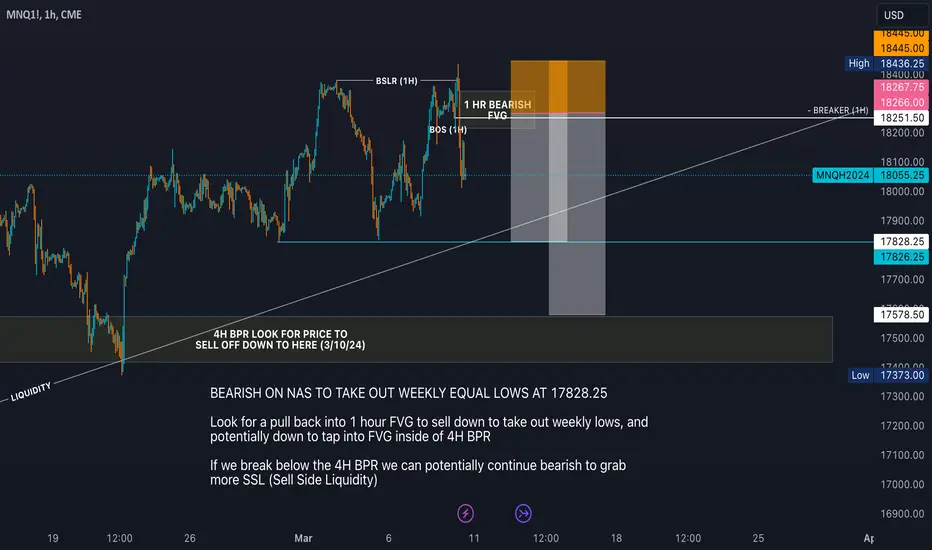
BEARISH ON NAS TO TAKE OUT WEEKLY EQUAL LOWS AT 17828.25BEARISH ON NAS TO TAKE OUT WEEKLY EQUAL LOWS AT 17828.25
Look for a pull back into 1 hour FVG to sell down to take out weekly lows, and potentially down to tap into FVG inside of 4H BPR
If we break below the 4H BPR we can potentially continue bearish to grab more SSL (Sell Side Liquidity)