Nas100short
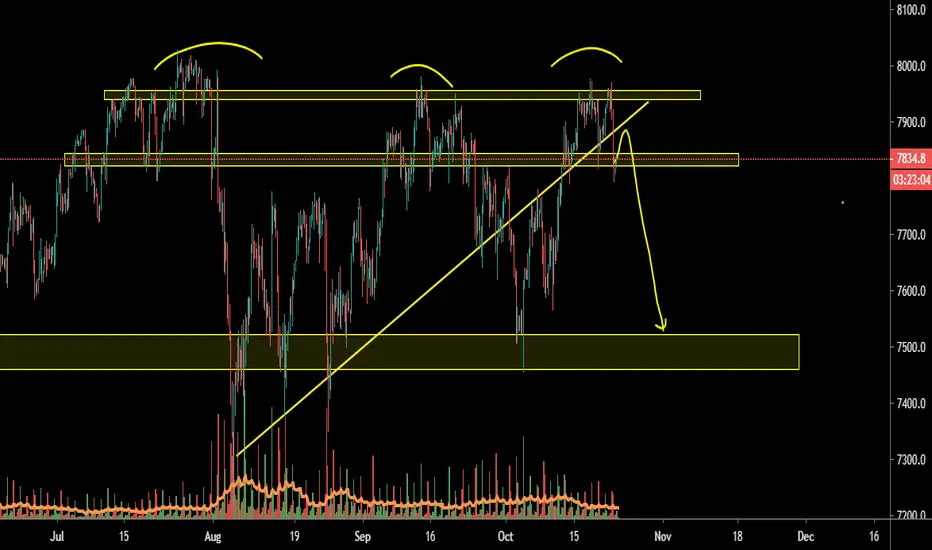
NAS100 Triple top!!Price expected to decline, Wait for the price action to break the support, so open short around 7800
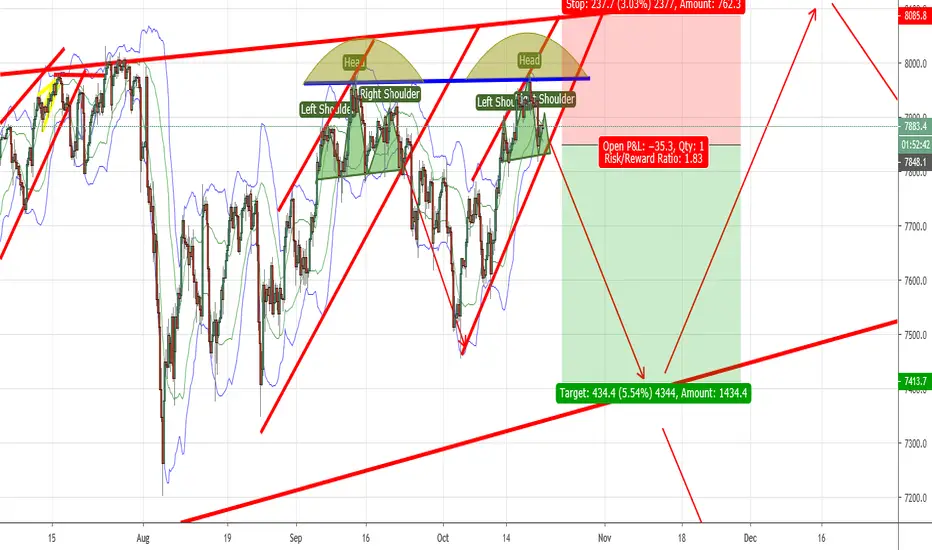
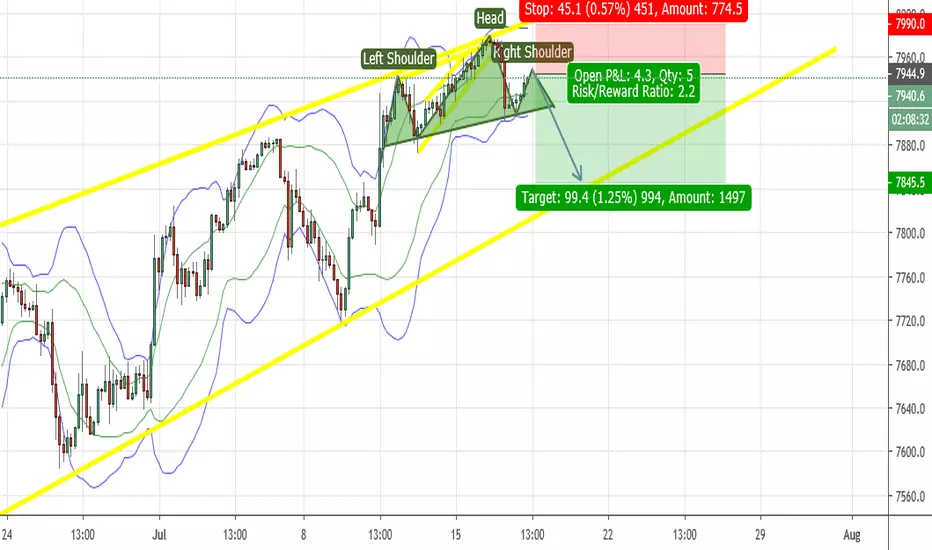
NAS100 - Short Other than the fragile state of the current global economy, I am only using very basic analytical tools such as H&S, Double Top and Rising Wedge. These coupled with recent ATH's give me enough indication that the edge is in favour of a decline rather than another rally. NAS100 is a fickle beast so I could be way off, however it has been a while since I've posted so I thought I'd give it a crack. I haven't entered yet, however I have setup an alert for the top right shoulder, where I'll be watching closely to see if it's likely to make one last push towards 8,000, or if the drop will begin. If it does drop, I will wait for confirmation by way of break of the neckline and big red pin bar.
Appreciate all comments, feedback and varying opinions. Please make any criticisms as constructive as possible!
Thanks :)
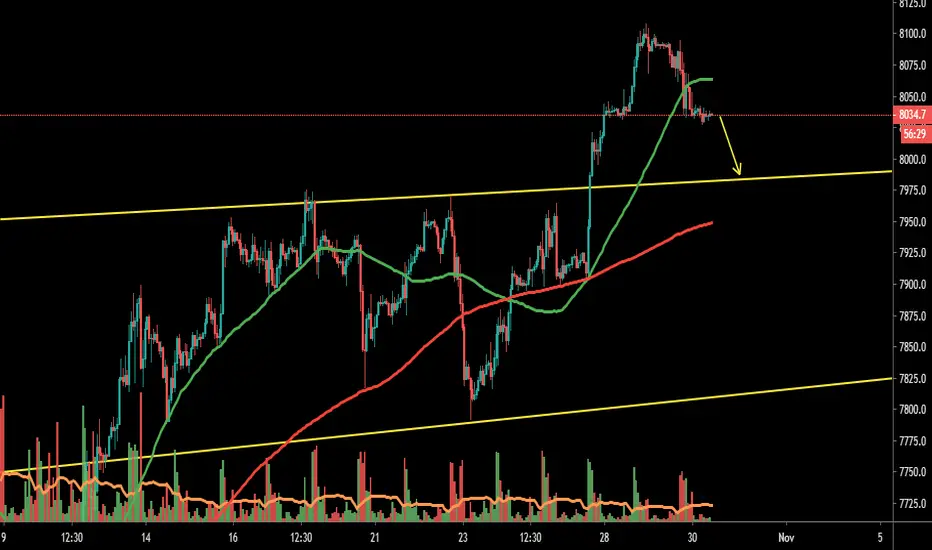
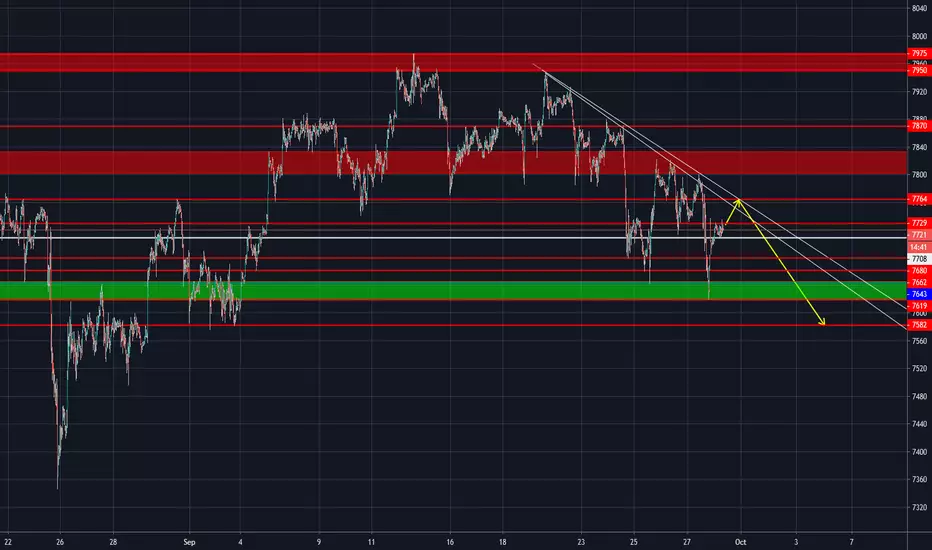
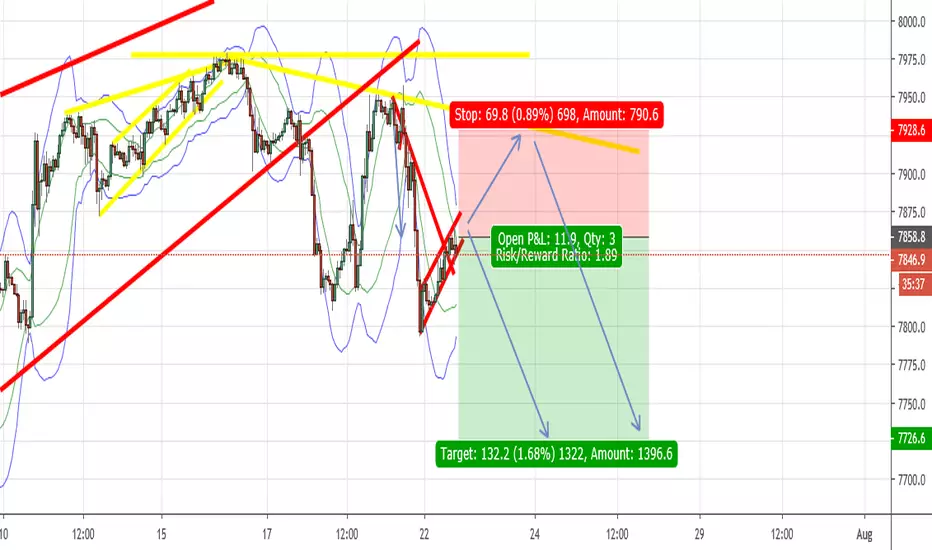
NAS100 next move!!A move towards downside indicated that it is going down very soon, however, a retest at the Resistance is expected before going further down
NAS100 new High ?? or pullback??In this scenario if the price breaks the chart pattern we can likely see a fall to 7000$ or if it stays above 8000 soon a new high could be seen

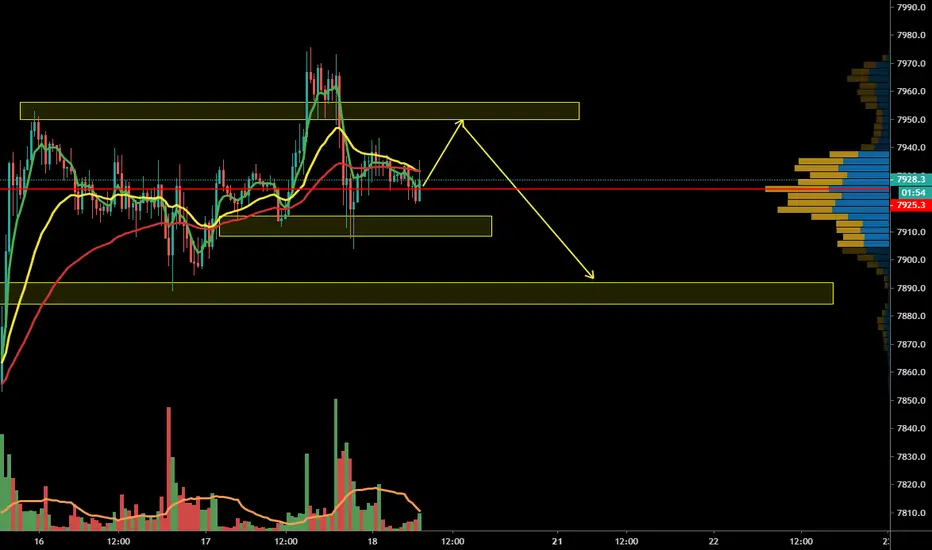
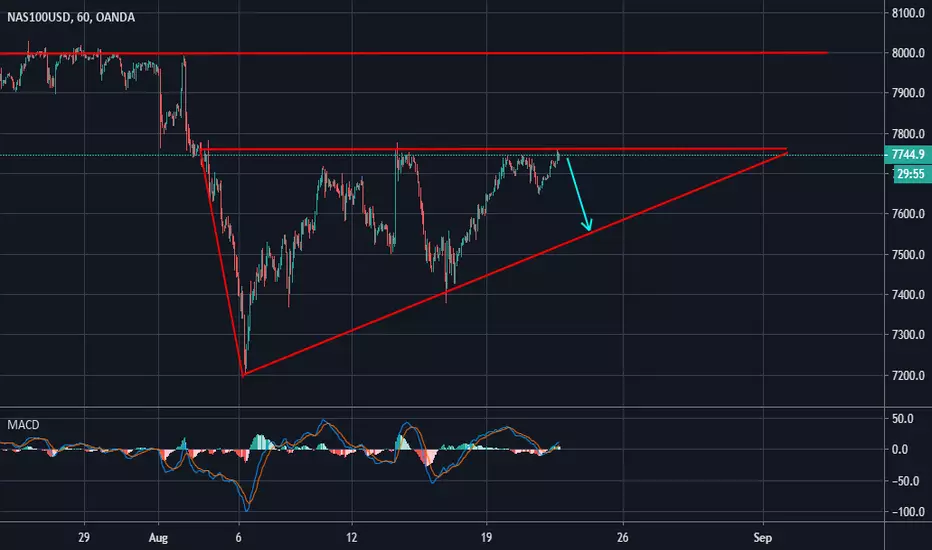
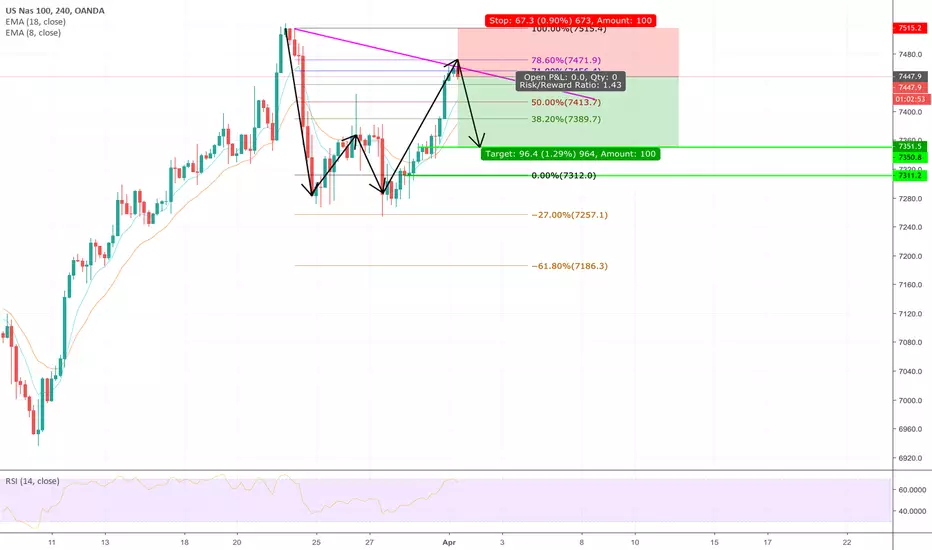
Possible Short on Nas100Price is at an important flipzone. Nearing the end of a rising wedge and in reach of a diagonal resistance.

nas100 bearish indicationwaiting for nas100 to give us perfect confirmation for a sell we currently predicting that nas100 will sell in the future we waiting for that retest to finish and will look for sell opportunities to the down side.

Sell NASDAQOANDA: NAS100USD SEll the NASDAQ with stop loss at 7895.5 and the final take profit at 7721.7, all the best

SEll nas100I am selling OANDA: NAS100USD at the current price than taking my profit at 7588.00 and my stop loss at 7675.6


i am selling nasdaq at 7713.00OANDA:NAS100USD I Have checked my index and finally came to conclusion that I am going to sell, looking at the 1D chart a formation of a bearish movement seems to be continuing, though there is a possible retest to the 7773.00 area, my final confirmation to this pair is to sell it and hope for the best until my target at 7465.20

NASDAQOANDA:NAS100USD Looking at the Nas100 4Hour chart, I see the indices has finally reached the level of its resistance which is at 7722.6, it will now dip down to a level of support around 7619.6, with my final target at 7440 I am selling nas100 now

GARTLY FORM ON H4 NAS100 GARTLY FORM ON H4 NAS100 (NASDAQ100) SHORT ENTRY 8024.... SL.... 8040.... TP...7902

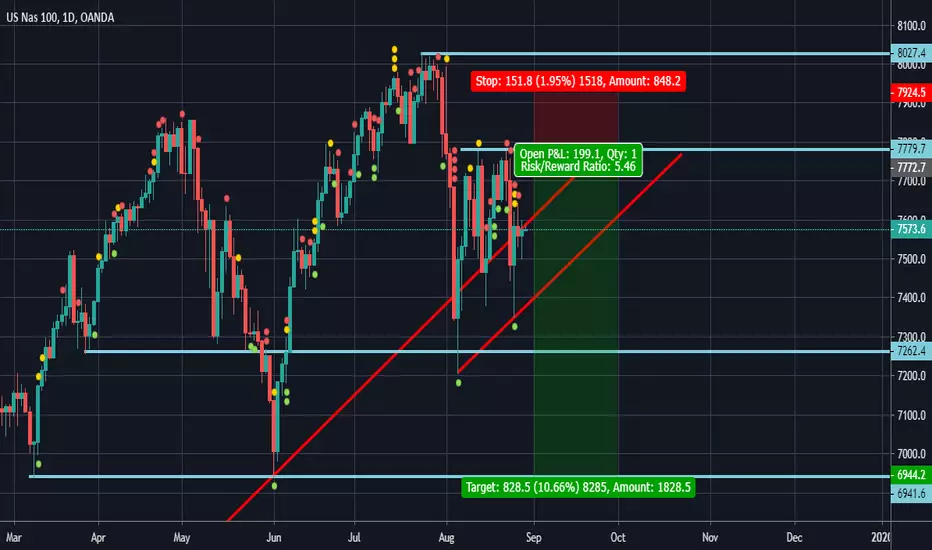
NAS100USD Head And Sholders - ShortAnticipating this H&S for drop to lower trend line of channel. Many others are calling for a push up to new ATHs above the 8000 resistance area so be careful and trade with caution. Don't risk more than you can afford to lose. Good luck!
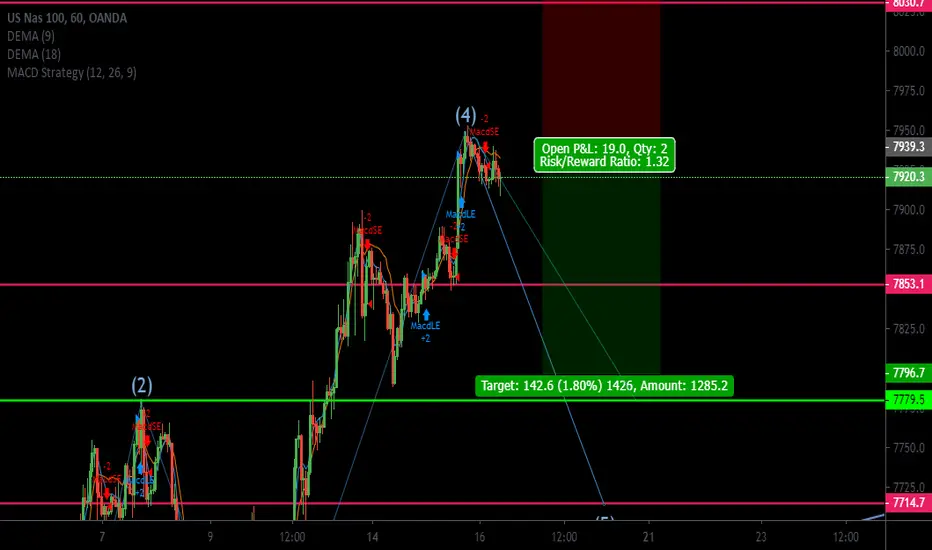
NAS100 - Indices Trading | Elliott Wave Structures | Q2 2019*Please support this idea with a LIKE if it helps you. Thanks!
More details about me in my signature.
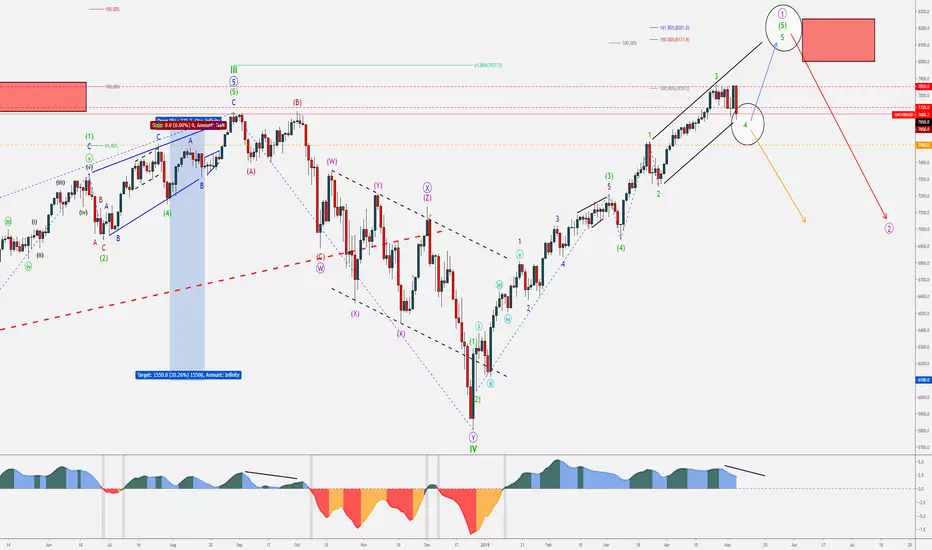
NAS100 - Elliott Wave Outlook
Bearish Swings - Patterns:
Complex Flat in Cycle Wave (IV) (green)
Primary W (purple) - Zig-Zag
Primary X (purple) - Complex Triple Three
Primary Y (purple) - Simple ABC Swing
Bullish Swings - Patterns:
Bullish Impulse in Primary 1 (pink)
Intermediate (1) (green) - Impulse
Intermediate (2) (green) - Complex Correction
Intermediate (3) (green) - Bullish Extension
Intermediate (4) (green) - Sharp Correction
Intermediate (5) (green) - Extended Ending Diagonal
Next expected swing:
Bearish sequence in Primary (2) (pink)
Structure change:
Breach of the lower trend-line could lead towards Primary (2) (pink) already unfolding.
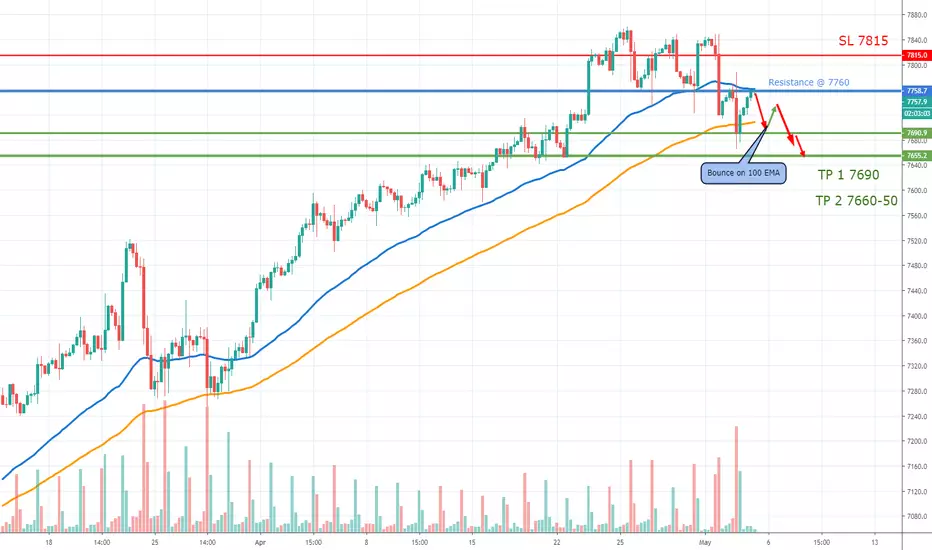
Lets Short NAS100Chart shows weakness at the 50 EMA resistance, large probability of a pullback anytime soon.
Price might bounce off of the 100 EMA, but support is weak as shown earlier.
Short near 7760 or wait for market open.
SL 7815
TP 1 7690
TP 2 7660-50
Let's make that money!
Best regards, WidTrade
NASDAQ: NAS100 Keep Buying Continue !!BUY & SELL Above Given Chart or
You Can Also set Own Risk reward.
Let see what Will be Next Move.
Warning- I m Not a Financial Advisor this idea Only For Educational Purpose Only.
Thank You !!
