NAS100
simple trading - follow the trend
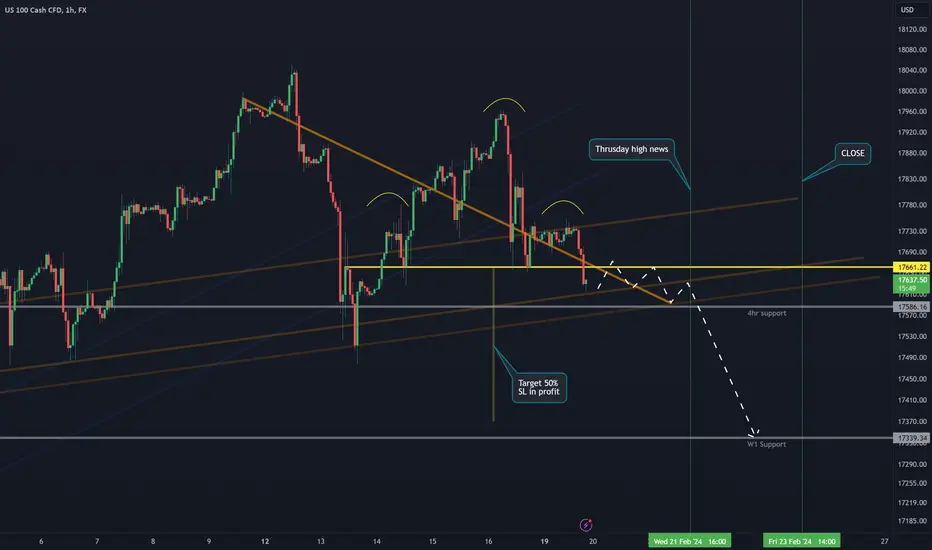
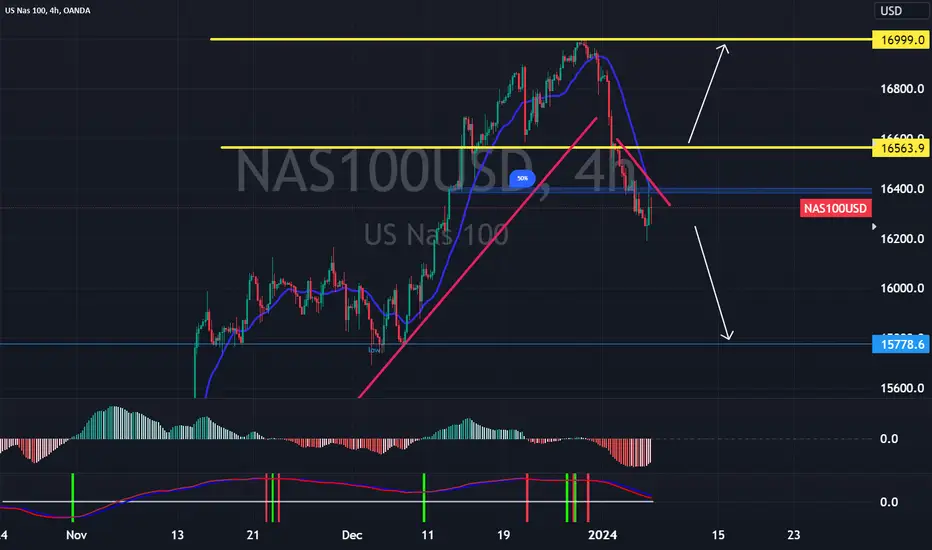
A very bullish market always needs a pullback. What a great Head and Shoulders pattern for a reversal to the downside. NAS100 has officially broken below all bullish trend lines on the Daily. NAS100 is looking to create more sell pressure. With NAS100 being at the top of its weekly trend, look for a correction. Massive sell if NAS100 cannot remain above the 4hr support zone.
BULLS :
Buy at 17588 4hr support,
If candles remain above this area and create bullish momentum, look for a target at 17661. A new higher lower should be a confirmation for continuation to the upside.
BEARS :
Wait for a retest to 17661 with bearish candles, Do NOT sell now but wait for a retest
*Previous sell opportunity:
17730
17665
This week's trading:
Look for NAS100 to consolidate and respect market support and resistance areas. Once the market has made a decision, then we trade!
Nas100short
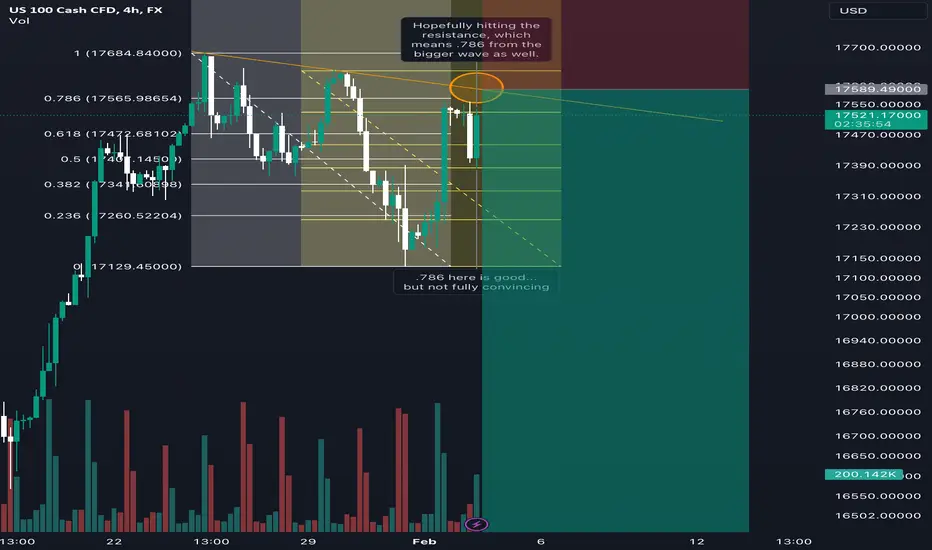
NAS100 - Shorts0.786 from the previous high is a good shorting entry in my opinion. Magnificent 7 is done with their earnings(except NVDA), so I am not seeing much stimulus from big tech. Most tech stocks are not doing well, and I am seeing some extent of selloff in 1-2 months.
NAS100 - WHAT THE F*** IS GOING ON? (KEY LEVELS)Hey Traders, yesterday’s market shake-up wasn’t just about the Fed's chess moves. A trifecta of less-than-stellar employment data, lukewarm tech earnings, and regional bank jitters sent the NAS100 on a rollercoaster, underscoring the fragile nature of our current economic landscape.
The Fed's stance was the talk of the town, maintaining a rate plateau between 5.25% and 5.5%. But here's the kicker: the Fed's not just playing hard to get with rate cuts—they want to be absolutely sure inflation is well-tamed before making a move. The puzzle? Inflation's at a tame 1.9%, yet they're still holding out for a clearer sign.
Powell's cool-headed presser post-meeting hinted at a 'wait and see' approach, calming fears of economic overheating or cooling. The good news? Inflation's behaving, and growth is chugging along. But the markets are twitchy, and the odds of a March rate cut have edged down from 'likely' to 'let's talk later.'
Now, let's bring in New York Community Bancorp’s plunge into the mix. Was it a one-off, or a canary in the coal mine for the banking sector? Concerns over credit quality and margins are in the air, with all eyes on whether this spells broader banking woes or just a case of merger indigestion.
As we gear up for our NAS100 price action analysis, these economic plot twists are crucial. They're the backdrop to every candlestick and trend line we're about to dissect. Stay tuned as we unravel the price story against this economic saga.
Based on the provided chart of the US 100 index and considering the backdrop of the latest economic news, here is an analysis that blends market sentiment with price action analysis:
What is on the chart? (key levels to look out for)
1) We have our retracement levels + the 4 hour FVG and BOS level. This area is a key resistance zone.
2) The order block that might provide us with a temporary (or permanent) bottom. You can consider it as a support level and it will determine the next step in our price action story.
3) Key daily level that is a great support area. You have the FVG + BOS level (previous ATH so significant) + discounted area.
4) This is a significant sellside level that I doubt will be broken with the current outlook which is more uncertain than bearish but still important to outline.
CONCLUSIVE SENTIMENT: Given the current economic context where the Fed is cautiously optimistic yet not ready to lower rates, the failure to break the ATH in the index could reflect a market that is wary of overextension and preparing for a period of consolidation or retracement. Investors may be taking a more defensive posture, awaiting further economic indicators before committing to a direction.
In essence, the sentiment appears to be one of caution, as reflected in the index's price behaviour and recent economic developments. Traders are advised to watch the key technical levels and stay informed on economic updates, as these could significantly impact market direction in the near term.
As always, stay cold headed and keep your money close! HAPPY TRADING!!!!

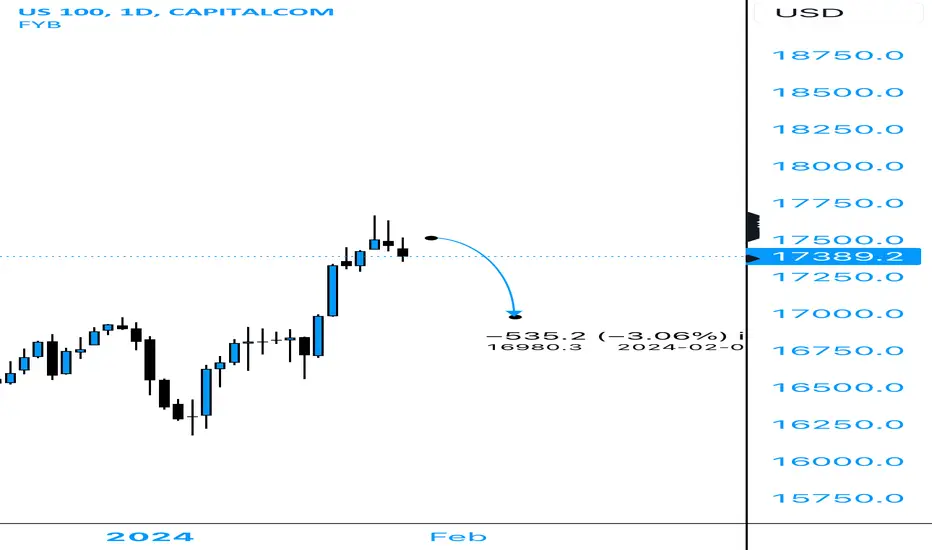
Nas100 HTF Analysis I expect Nas to reach 17k in the next few weeks. Nas has been pushing up relentlessly last few weeks so expecting ATLEAST a nice pullback. Once we hit 17k tho we could see all time highs again!
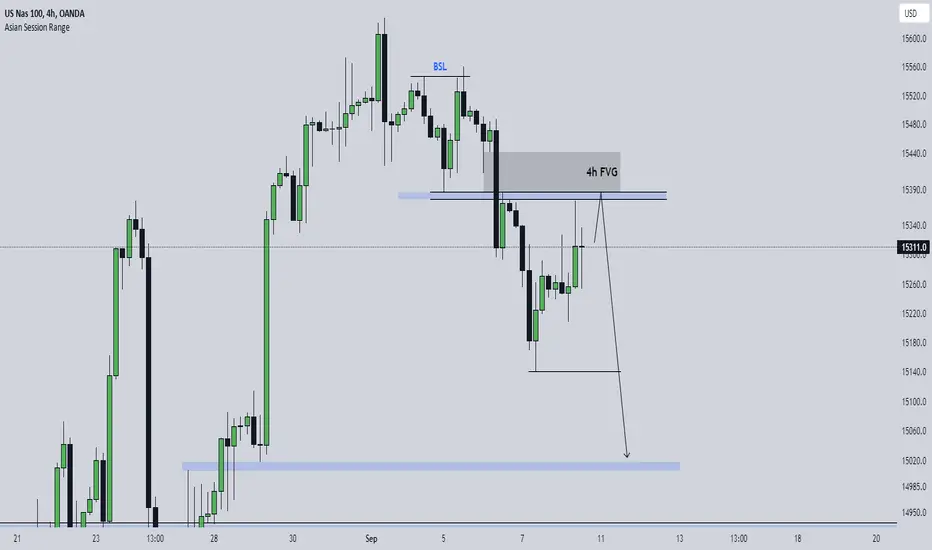
NAS100 - MY DAILY AND INTRADAY ANALYSES (TARGET 17300)Yes this is contrarian, markets are booming but it's quite overextended and going long at a top is the most monkey trader thing to do. I'll do a reverse analysis where I start with the intraday and follow up with the daily. So here's my take on things:
What's on the intraday chart? (Follow the steps)
1) A 4 hour bearish FVG. This will serve as my entry zone.
2) Our 'support line'. You'll notice price keeps on making lower lows.
3) Our liquidity target. This is the price magnet. We know for certain (discretionary) that price will take this out.
4) The entry point. Again, do your own research. Do not follow the analysis from some random stranger on the internet and go all in (you degenerate).
5) The intraday target. The order of things matter. If we hit this before hitting the short entry then you might wanna reverse the idea but I do not like the idea of longing in an overextended market!
What's on the daily chart? (Follow the steps)
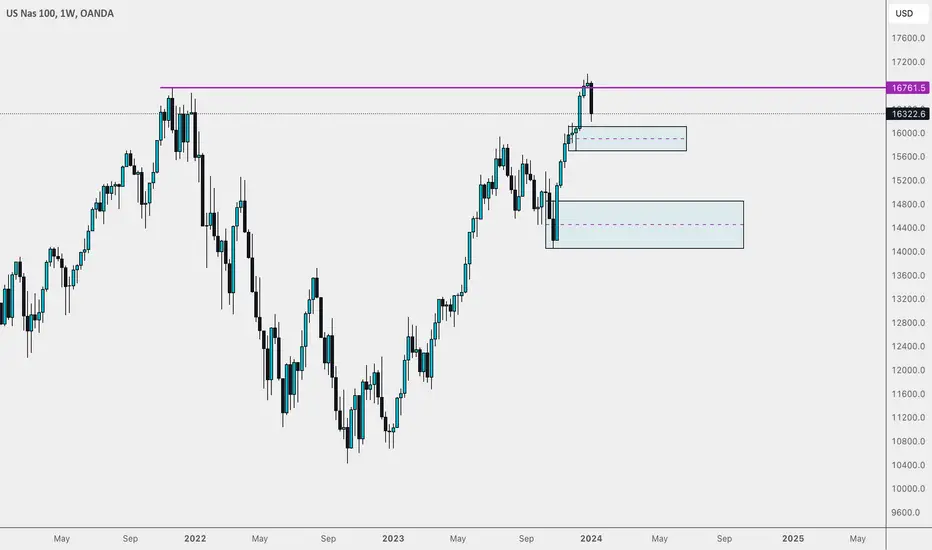
1) The previous all time high that was violently broken.
2) Our swing extension target area. This is great to know where to take partials or close entire positions in new price territories. Of course price can always go further towards 2 or 2.618 or anything else (it's up to you where you wanna take partials).
3) The bearish candle pattern: kind-of a mix between a gravestone, a spinning top, a shooting star and whatever other label I can muster to justify my bias lol. To me this is the main driver of the bearish bias!
4) Maximum target. I do not see price going any lower and the intraday target is more sane so I don't really expect price to go that low either.
5) The continuation of the rally. People love buying. I do not see that changing anytime soon.
As always, have a lovely day and happy trading! ;)

Nas100 Short SetupExpecting H4 to change to bearish after taking the previous day’s low so anticipating the H4 making a LH here and dropping. Possibly seeing a move down during Asian session, although this is rare. Risking .5% of my account and targeting 3R.
NAS100 Shorts Id much prefer to look to go long because Im more bias towards USD weakness, however the chart is indicating that there may be more potential downside. So in order to validate an entry I would be looking for two bearish 4h closes 6am GMT
NAS100 Trapped Buyers?We can see price has broken the high and pushed back down. If this is a liquidity trap trapping buyers could be a potential. As seen above I have 2 zones of interest, if the higher zone is broken I can see the price easily pushing down to the 14500 area.
We will need to check this on lower timeframes over the upcoming week and see if we have a true shift in structure across all timeframes which will once again give us more of a reason to believe it was a buyers trap.
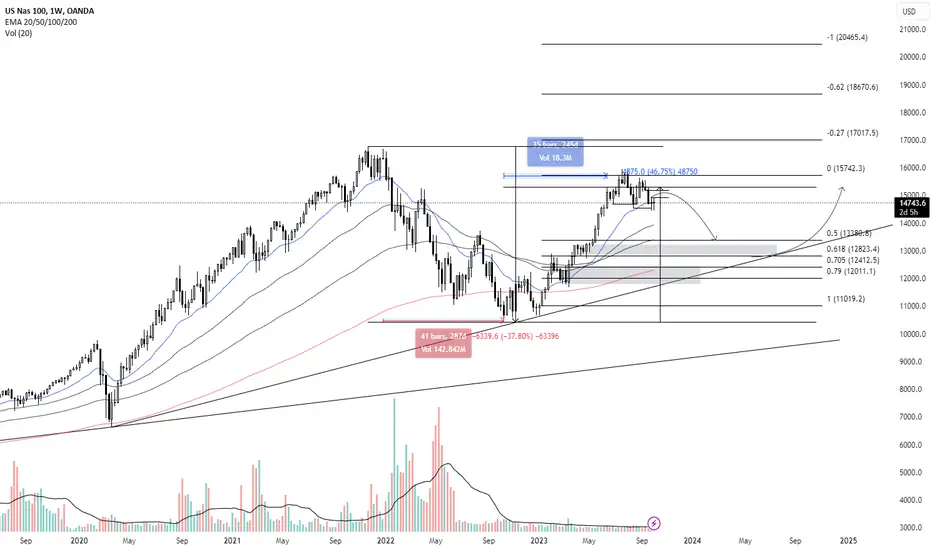
NAS100 US100 Technical Analysis London Open / NY OpenThis video provides a detailed analysis of the NASDAQ. Presently, it has reached a robust resistance level on the weekly timeframe. The market appears quite stretched, presenting a potential counter-trend trading opportunity around the London Open. If missed, there might be another chance around the New York Open later today. Throughout the video, we delve into essential technical aspects such as price action, market structure, and the prevailing trend. It's crucial to note that this content is purely educational and should not be interpreted as financial advice.

POSSIBLE TEMPORARY BEARISH ENTRY FOR NAS100PEPPERSTONE:NAS100 BLACKBULL:NAS100 VANTAGE:NAS100 OANDA:NAS100USD
Hello everyone, upon watching closely multiple timeframes where I combine a few types of chart analysis (support & resistance, candlestick patterns, breakout strategy, etc.) I'm thinking NAS100 will go bearish, at least temporarily, because ultimately the price movement in the charts tell us all, and my goal is always to read it right.
That chart I'm sharing with you is pretty self explanatory.
Make sure to comment your thoughts below and let me know any questions you might have if you have any.
My goal is to try and always be helpful, and while I sometimes fail (I'm a human not a robot) I do my best to always be better, and I never see failure as the final destination.
If you got to this point, happy profiting!

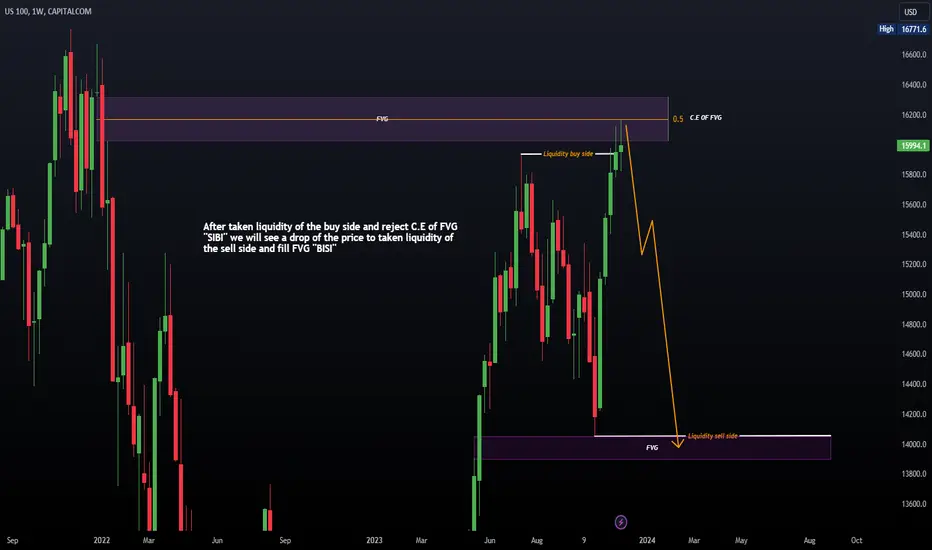
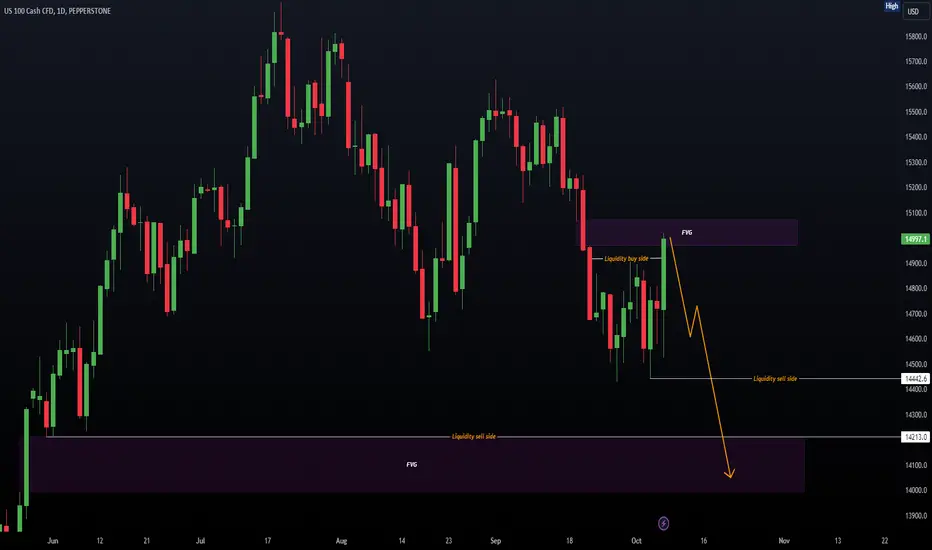
US100 Daily Analysis After taken liquidity of the buy side and reject C.E of FVG ''BISI'' we will see a drop of the price to taken liquidity of the sell side and fill FVG ''BISI''
- Tading is probability control your risk management.
Good luck !
NAS100 - SHORTSelling only after the retest of the HMA
**This is just my trading thought process and does not constitute as financial advice.
**Please trade with proper risk management**

US100 ANALYSIS After taken liquidity of the buyside and shift market structure and retest of Breaker and FVG we will see a drop of the price

Nasdaq sellOANDA:NAS100USD
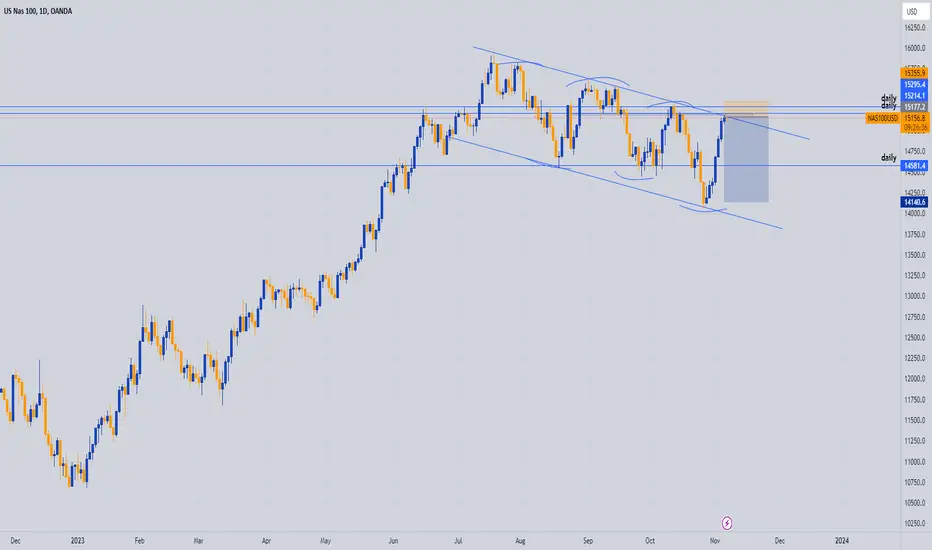
Swing trade idea on Nasdaq. Key resistance zone around the 15214.1 area is a potential reversal zone to the downside
US100 NAS100 Technical Analysis And Trade IdeaIn this presentation, we undertake a thorough analysis of the NASDAQ US100, concentrating on the prevalent bullish sentiment within the 1-month (1M) and 1-week (1W) timeframes. Significantly, our charts reveal that the US100 is currently approaching a critical resistance level, marking a pivotal juncture. Throughout this discourse, we delve into the fundamental principles of technical analysis, encompassing essential elements such as assessing the existing market trend, price dynamics, market structure, and other crucial facets of technical analysis. As we proceed through the video, we meticulously examine a potential trading opportunity within the NAS100.
It is crucial to emphasize that the insights shared in this content are intended exclusively for educational purposes and should not be interpreted as financial advice. Engaging in foreign exchange market trading carries a substantial level of risk. Therefore, it is imperative to judiciously incorporate robust risk management strategies into your trading plan to effectively navigate these challenges.

Will NAS100 break below 14400?As it is clear from the chart the NAS100 is going down but there is a rejection block at 14460 to 14440. It has been activated once before and i think this time it will break the block below that range

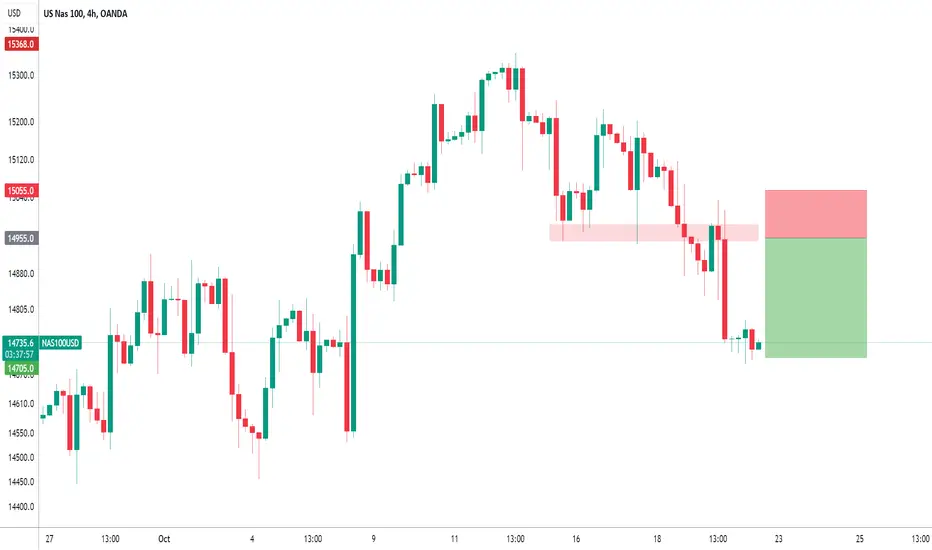
NASDAQ to see a temporary move higher?US100 - Intraday
Levels close to the 61.8% pullback level of 15365 found sellers.
There is no clear indication that the downward move is coming to an end.
A Fibonacci confluence area is located at 14546.
Further downside is expected although we prefer to set shorts at our bespoke resistance levels at 14955, resulting in improved risk/reward.
The medium-term bias is neutral.
We look to Sell at 14955 (stop at 15055)
Our profit targets will be 14705 and 14655
Resistance: 14955 / 14995 / 15348
Support: 14636 / 14546 / 14445
Risk Disclaimer
The trade ideas beyond this page are for informational purposes only and do not constitute investment advice or a solicitation to trade. This information is provided by Signal Centre, a third-party unaffiliated with OANDA, and is intended for general circulation only. OANDA does not guarantee the accuracy of this information and assumes no responsibilities for the information provided by the third party. The information does not take into account the specific investment objectives, financial situation, or particular needs of any particular person. You should take into account your specific investment objectives, financial situation, and particular needs before making a commitment to trade, including seeking advice from an independent financial adviser regarding the suitability of the investment, under a separate engagement, as you deem fit.
You accept that you assume all risks in independently viewing the contents and selecting a chosen strategy.
Where the research is distributed in Singapore to a person who is not an Accredited Investor, Expert Investor or an Institutional Investor, Oanda Asia Pacific Pte Ltd (“OAP“) accepts legal responsibility for the contents of the report to such persons only to the extent required by law. Singapore customers should contact OAP at 6579 8289 for matters arising from, or in connection with, the information/research distributed.
NAS100 SHORT TRADE IDEA, NOW THE TIME TO JUMP TO LOWER TIMEFRAMEHello Traders, i Already done the Full Analysis on the FX:NAS100 and it played perfectly now we all know what gonna happen it the time for the :
- DISTRIBUTION, exactly what that means it means a big move so we have to find our Entry to do so we have to jump on LOWER timeframe LIKE 15MIN or 1H and Enter, this is just the UPDATE for the ANalysis if you want me to do a lower timeframe Setup entry let me know on the comment section!

NAS100 DAILY ANALYSIS After taken liquidity of the buy side of this week and fill FVG we will see a continuation of down trend to taken liquidity sell side and fill FVG of up trend so that's just a retaracement we are still in brearish move.
-- Tading is probability control your risk management.
Good luck !
NAS100When you understand the game, you don't panic.
.
.
.
.
.
.
🧅Disclaimer :There are risks associated with investing in securities. Investing in stocks, bonds, exchange traded funds, mutual funds, and money market funds involve risk of loss. Loss of principal is possible. Some high risk investments may use leverage, which will accentuate gains & losses. Foreign investing involves special risks, including a greater volatility and political, economic and currency risks and differences in accounting methods. This is Not Financial Advice
🧅JUST AN OPINION OF THE ONION.🧅
NAS100 and US30 Top-down analysis Hello traders, this is a complete multiple timeframe analysis of this pair. We see could find significant trading opportunities as per analysis upon price action confirmation we may take this trade. Smash the like button if you find value in this analysis and drop a comment if you have any questions or let me know which pair to cover in my next analysis.

NAS100 - Short Bias for next weekHey traders, here is the analysis for the NAS100U. If you guys like my analysis please hit like👍 and follow. Thanks. DISCLAIMER:- This is not financial advice.
US100 NASDAQ Technical Analysis and Trade IdeaThe NAS100 has encountered a significant support level followed by a minor retracement. Although the prevailing trend is undeniably bearish, the pivotal question revolves around the depth of the potential pullback, which could serve as an entry point for us. Within the video, we comprehensively address multiple facets of technical analysis, encompassing the trend's dynamics, price action, market structure, and more. I want to emphasize that the video provides a thorough explanation of all these elements, however, should not be interpreted as financial advice.
