NASDAQ RiskyRisk 0.5%
TP1 = 1:1 RR
Disclaimer:
The contents in this Idea are intended for information purpose only and do not constitute investment recommendation or advice. Nor are they used to promote any specific products or services. They serve as an integral part of a case study to demonstrate fundamental concepts in risk management under given market scenarios. A full version of the disclaimer is available in our profile description.
Nas100short

NQ Aiming for 14420.00..?As NQ have Provided with Sellside Delivery, Next Draw on Liq Should be that
14420.00 Even Fig, And the Weekly Discounted FVG Below

SHORT - NAS100 (2 Jul 2023)Position Trade - NAS100
Monthly:
- Monthly chart presents a MEGA opportunity to short from the fresh monthly supply zone.
Weekly:
- To proceed with caution as price has retested the supply zone that holds. Hence to look for SELLS only with confirmation, when price has broken the demand zone near Curve
Daily:
- Same for Daily Chart; price needs to break the demand before looking for SELLS

US100 NAS100 Technical Analysis and Trade IdeaIn this video, we closely examine the US100 NASDAQ, which is currently experiencing a distinct downtrend. We don't see any indications of the trend shifting in the near future. Additionally, we delve into the potential of a pullback and identify an optimal entry point short for the NAS100.
Please note: This content is intended solely for educational purposes and should not be interpreted as financial advice.

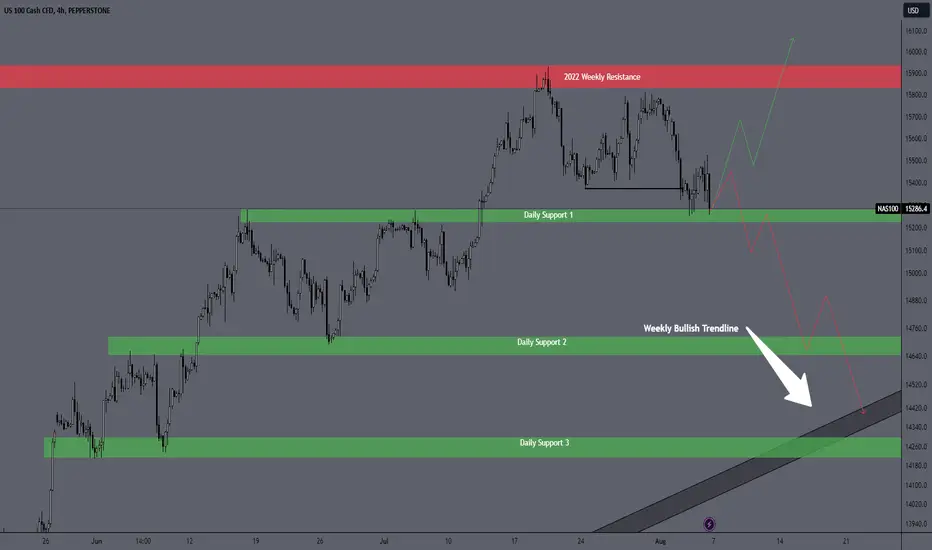
NAS100 Analysis. New LOW Coming!Hello Everyone. I want share my idea about NAS100.
On that index we saw pretty bullish trend, but after touch of 2022 weekly support we had some bearish movements which gave me signal it coming for show us new weekly low. That is normal all trend has this moment after strong movement.
Trend is still strong bullish for long term but at the moment what i see and my price prediction is short but not for long term, i think bearish trend will be only few days until it touch weekly trendline or daily support 3, then i think we will see another big bullish movement which i will share.
Couple days ago i tried to short this index but it didn't touch my entry point ( i will link in this idea ).
Now i dont have any entry point yet because price is at strong support zone, i think i will open my trade if price will go up slowly from the support or after brake that support and retest it at low timeframe ( 15m, 30m ).
Here is my 2 scene what price can do next week.
1 Bullish - price has strong reaction at support zone 15275 LVL brake weekly resistance and going up.
2 Bearish - price is not strong at support 15275 LVL, its coming down retest broken support and continue downtrend until it touch weekly trendline.
If i will be right i will update that idea when i will open position.
BE PATIENT!!!!
NAS100 could be headed a touch lower NAS100 might still have some juice left for a continuation to the downside.

NAS100 Potential DOWNSIDEHi TRADERS , Nas100 gave us a couple of confluences, first by forming an "M" Double Top to Forming Head & Shoulders. Now lets wait for the final confirmation a break on the support, Please use proper RM

SHORT - NAS100 (D) (26 May 2023)SWING TRADE - NAS100
Weekly Price reaching its Supply Zone soon
= Possible for a MEGA SHORT trade as Weekly Supply zone is FRESH
Daily Trade/s
- Potential SELL zone in Daily TF nested within Weekly Supply
H4 Trade/s
H1 Trades/s
- Consider to have small risk trades too in H1
NAS100 Top-down analysis Hello traders, this is a complete multiple timeframe analysis of this pair. We see could find significant trading opportunities as per analysis upon price action confirmation we may take this trade. Smash the like button if you find value in this analysis and drop a comment if you have any questions or let me know which pair to cover in my next analysis.

NAS100 Top-down analysis Hello traders, this is a complete multiple timeframe analysis of this pair. We see could find significant trading opportunities as per analysis upon price action confirmation we may take this trade. Smash the like button if you find value in this analysis and drop a comment if you have any questions or let me know which pair to cover in my next analysis.

NASTY100Pure Technical
.
.
.
.
.
.
🧅Disclaimer :There are risks associated with investing in securities. Investing in stocks, bonds, exchange traded funds, mutual funds, and money market funds involve risk of loss. Loss of principal is possible. Some high risk investments may use leverage, which will accentuate gains & losses. Foreign investing involves special risks, including a greater volatility and political, economic and currency risks and differences in accounting methods. This is Not Financial Advice
🧅JUST AN OPINION OF THE ONION.🧅
NAS100 SHORT RESISTANCEDear fellow aliens.
Short position on NAS100 RESISTANCE TOUCH
Wait for breakout trendline and retest of broken BoS wick candle. 4hr
TP 1day chart recent highest swing as seen support zone.
RSI MULTIPLE 1D OVERBOUGHT AREAS.
MARKET SENTIMENT BULLISH. Do opposite
Inflation rates probably will decrease so expect xauusd to go bullish. Everyone expects gold to drop, do opposite eliminate retail amateur traders.
comment for 4000 pips scalping strategy for nas100.
mentoring is free . dedication and full time concetration is required.
of course wait NY market open session for best entry.
looking into expand my business for interest only 1000% dedication no guru alike indians fokes or similair.
comment for interest and contact details will be shared.

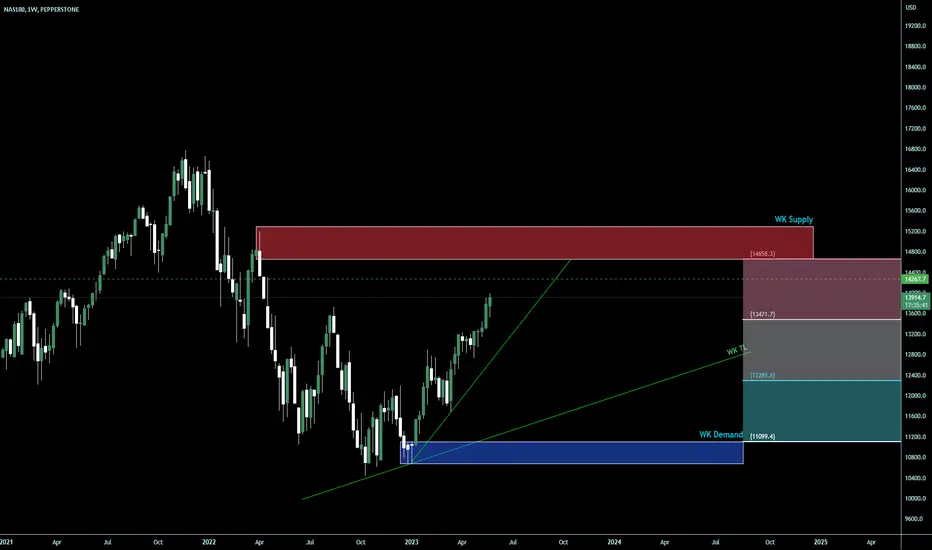
Nasdaq -> When Does It StopHello Traders,
welcome to this free and educational multi-timeframe technical analysis.
On the weekly timeframe you can see that the Nasdaq is currently retesting important previous weekly structure at the psychological $15.000 level which is now turned resistance.
You can also see that over the past couple of weeks, the Nasdaq created a rally of about 30% towards the upside, breaking a lot of resistance towards the upside but now we are a little bit overextended so I am simply waiting for a rejecion away from the resistance area.
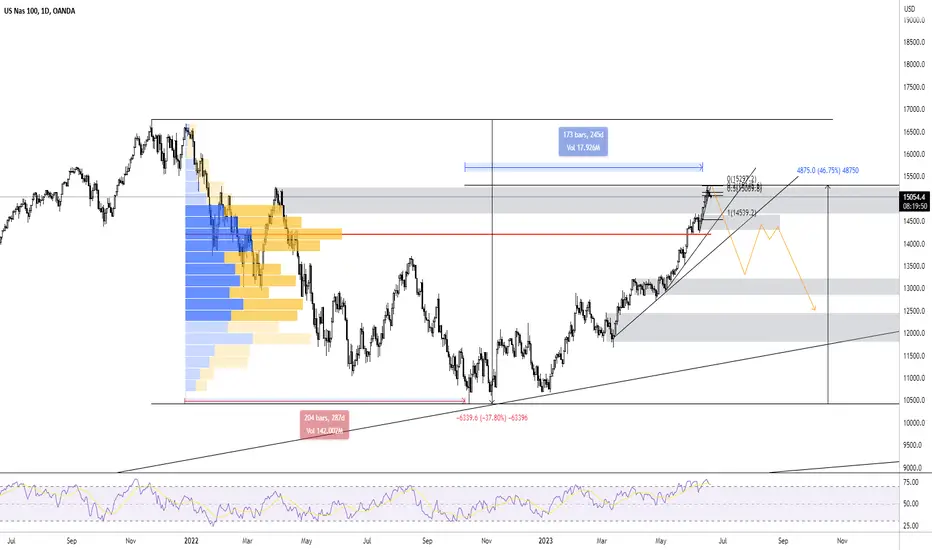
On the daily timeframe you can see that market structure is still bullish overall, there is no sign of the Nasdaq slowing down so I am still waiting for some bearish selling pressure before I then do expect also a daily retracement after this agressive pump recently.
Thank you for watching and I will see you tomorrow!
You can also check out my previous analysis of this asset:

NAS100 Sell ConsensusLooking for a drop off to occur in the market soon.
Seasonality wise speaking June tends to be negative. Thus, I would like to see a drop in the next couple of weeks.
There are two levels above which I have drawn out and will watch price once we clear either of those highs looking for bearish price action.
The targets are also outlined, and once reached, will re-evaluate the scenario to see if we get further downside.

NAS100 Top-down analysis Hello traders, this is a complete multiple timeframe analysis of this pair. We see could find significant trading opportunities as per analysis upon price action confirmation we may take this trade. Smash the like button if you find value in this analysis and drop a comment if you have any questions or let me know which pair to cover in my next analysis.

NAS100 Top-down analysisHello traders, this is a complete multiple timeframe analysis of this pair. We see could find significant trading opportunities as per analysis upon price action confirmation we may take this trade. Smash the like button if you find value in this analysis and drop a comment if you have any questions or let me know which pair to cover in my next analysis.

I sell a big sell !!!Nasdaq has reached a high, and it has just retested, so I am seeing a big sell, and all place your stops about 10 pips away from the highs.
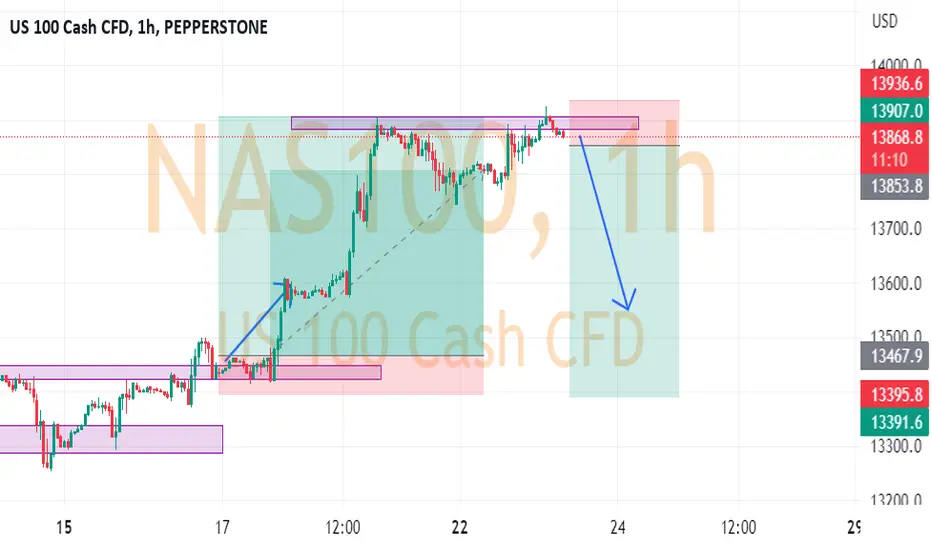
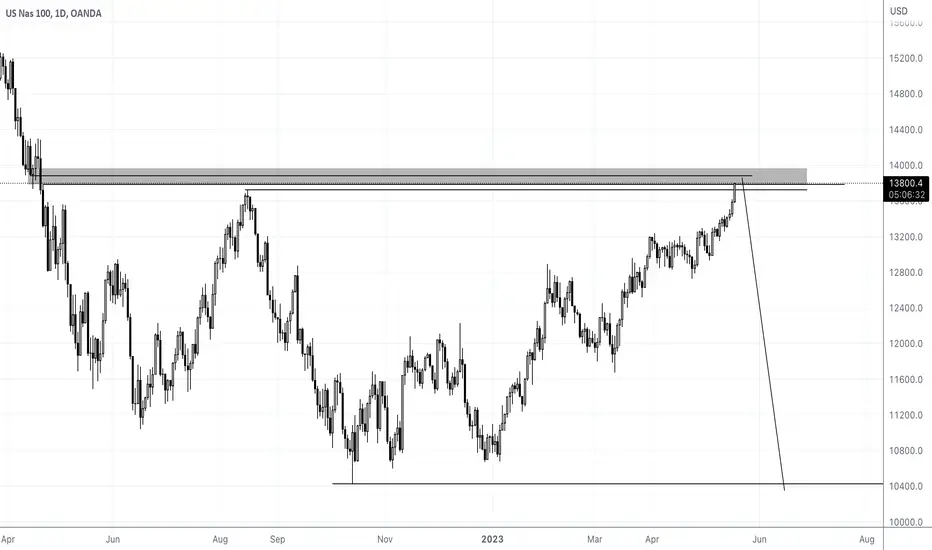
Nasdaq -> Obvious Top FormationHello Traders,
welcome to this free and educational multi-timeframe technical analysis .
On the weekly timeframe you can see that Nas100 is currently approaching a quite obvious previous weekly structure area which is now turned resistance exactly at the $13.500 level.
You can also see that from a weekly perspective, Nas100 is a little bit overextended towards the upside and in my opinion we are ready for a short term correction before we will then see more continuation towards the upside.
On the daily timeframe you can see that Nas100 is currently forming a rising wedge formation which is always considered a reversal sign, so I am now just waiting for some bearish selling pressure before I will then enter a short to capitalize on the next dump towards the downside.
Thank you for watching and I will see you tomorrow!
You can also check out my previous analysis of this asset:


Nasdaq -> Bearish Then BullishHello Traders,
welcome to this free and educational multi-timeframe technical analysis .
On the weekly timeframe you can see that Nas100 just recently perfecly broke above a major previous weekly resistance area at the HKEX:12 ,500 level which is now turned quite strong support.
You can also see that weekly market structure and moving averages are both bullish, indicating that we definitely have more upside potential long term so I am now just waiting for a deep retest of the previous resistance zone before I then do expect more weekly continuation towards the upside.
On the daily timeframe it seems like Nas100 actually formed a top formation over the past couple of days so I am now very interested in a short term short opportunity back to the weekly support at the HKEX:12 ,500 area before I then also do expect a next daily rally towards the upside.
Thank you for watching and I will see you tomorrow!
You can also check out my previous analysis of this asset:

Nasdaq descending triangle setuphello traders Nasdaq is making a descending triangle we was in a diamond shape on a 4hr we have a break on it lets wait the break of our pattern you can wait a retest to even conform but sometimes no retest

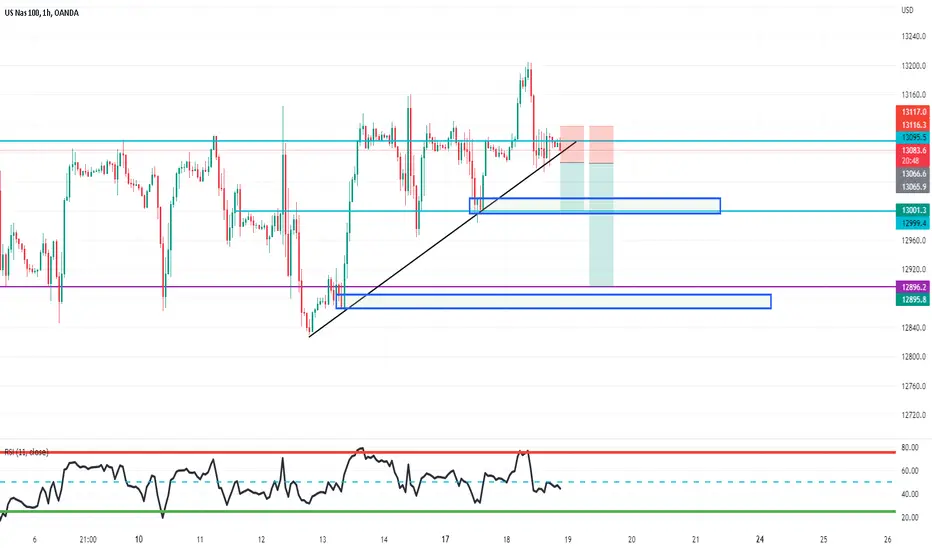
NAS About To Make A Move?whats up TV Family!
quick question ? are yall loving the ideas being shared? if so Share some feed back with me on what i can do better to improve your experience!!
In this Analysis i'm looking at NAS100 and i am seeing a Significant rejection starting to take place here, i also see that we have respected this Beautiful uptrend for some time now, and once we see PRICE ACTION CLOSE BELOW the trend i wouldn't be surprised if we didn't see a very quick decline in price towards projected target areas i have drawn up that are high probability reaction areas as its not just a simple support but rather a strong area of interest with A Bullish engulfing OB that have been formed ( both blue boxes show the Bullish Engulfing OB ORder Block on the 1 hour time frame where i anticipate price to come!
Disclaimer - trading is risky and you can loose 100% of your trading balance with incorrect risk management! this is why it is important to master and manage your risk management plan before you even think of taking your first trade!!
i am not a financial advisor and this is not financial advice, please do your own due diligence and market analysis as this is shared for educational and demo purposes!!