Nasdaq trading insights: 12-Feb-2025Nasdaq trading insights: Not signals, but informative zones to aid your decision-making. Please note: These zones are not trading advice. Use them as a starting point for your own analysis.
US NAS 100

Nasdaq market analysis: 11-Feb-2025Good morning. Welcome to today's Nasdaq market analysis and educational insights for price action traders.

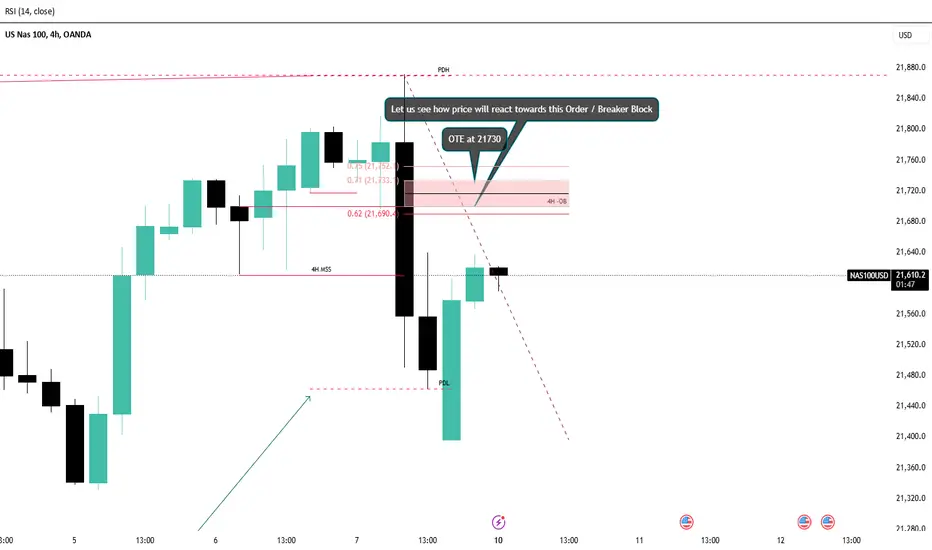
NASDAQ ShortBased on the previous analysis, I am still bearish biased and my entry might be based around the 4H Order / Breaker lock at around 21730.
If it respects it, then we will be on a bearish run. If not, we might look for a buy setup towards the All Time High
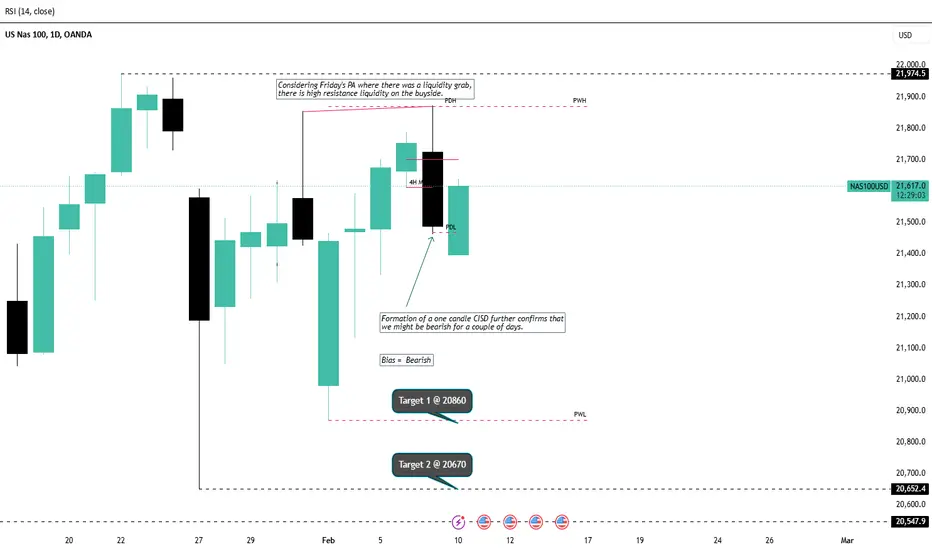
NASDAQ SHORTConsidering Friday's PA where there was a liquidity grab,there is high resistance liquidity on the buyside. Formation of a one candle CISD further confirms that we might be bearish for a couple of days.
We will delve into the smaller timeframe (4H & 1H) to have our entry position and our targets will be at 20860 and 20670
Nasdaq market analysis: 10-Feb-2025Good morning Dear Traders! Join me for the first Nasdaq market analysis for the week. Share your charts, ask questions, and let's discuss trading strategies.

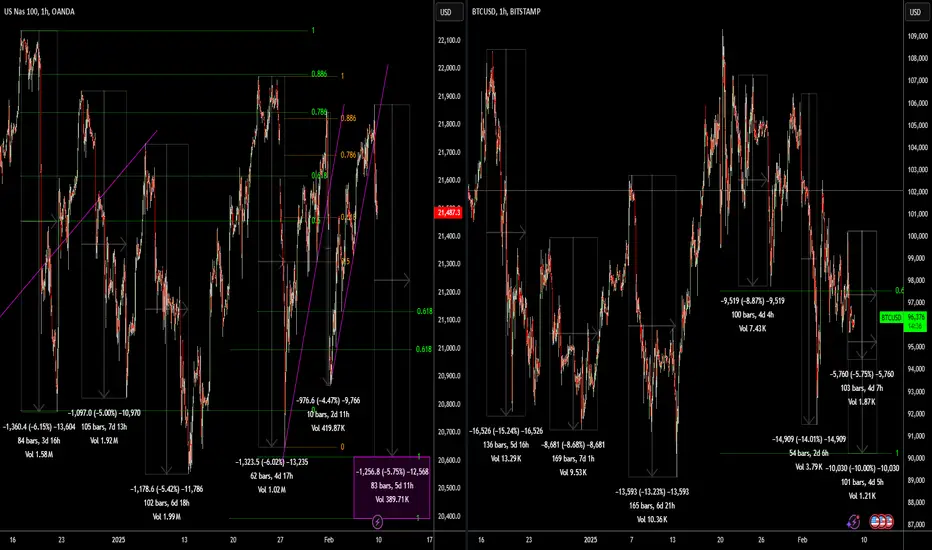
NAS100USD and BTCUSD correlationJust been recapping on the SPXUSD and NAS100USD charts, both look like they could head lower in the short term at least. Not sure crypto has proven it can trade independently from that just yet, at least based on the short term. Plus if things get disorderly then everything could get wacked. I'll be monitoring my positions over the weekend (BTCUSD, HBAR, XRPUSD), but I may reduce them again irrespective of how crypto moves in anticipation of potential downside in the wider markets. Looking at the recent declines on NAS100USD compared to BTCUSD, BTCUSD tends to overperform to the downside in % terms, you can see the percentages on the charts of the past declines. The recent decline which has just started sees there NAS100USD declining by -1.76% and BTCUSD by -4%, no guarantee that pace will continue, but assuming NAS100USD declines to the first target area and BTCUSD matches the drop in % terms BTCUSD could be looking at $94,500 and if it overperforms then it could reach $90,000 which is a potential measured move target based on how the NAS100USD could decline.
XRPUSD thread here which gives some background to recent positioning.
Nasdaq market analysisGood morning Dear Traders! Join me for the last Nasdaq market analysis for the week. Share your charts, ask questions, and let's discuss trading strategies.

Falling towards pullback support?NAS100 is falling towards the support level which is a pullback support that is slightly below the 23.6% Fibonacci retracement and could bounce from this level to our take profit.
Entry: 21,526.66
Why we like it:
There is a pullback support level that is slightly below the 23.6% Fibonacci retracement.
Stop loss: 21,287.96
Why we like it:
There is a pullback support that is slightly below the 50% Fibonacci retracement.
Take profit: 21,910.11
Why we like it:
There is a pullback resistance level.
Enjoying your TradingView experience? Review us!
Please be advised that the information presented on TradingView is provided to Vantage (‘Vantage Global Limited’, ‘we’) by a third-party provider (‘Everest Fortune Group’). Please be reminded that you are solely responsible for the trading decisions on your account. There is a very high degree of risk involved in trading. Any information and/or content is intended entirely for research, educational and informational purposes only and does not constitute investment or consultation advice or investment strategy. The information is not tailored to the investment needs of any specific person and therefore does not involve a consideration of any of the investment objectives, financial situation or needs of any viewer that may receive it. Kindly also note that past performance is not a reliable indicator of future results. Actual results may differ materially from those anticipated in forward-looking or past performance statements. We assume no liability as to the accuracy or completeness of any of the information and/or content provided herein and the Company cannot be held responsible for any omission, mistake nor for any loss or damage including without limitation to any loss of profit which may arise from reliance on any information supplied by Everest Fortune Group.

Nasdaq market analysis: 06-Feb-2025Good morning Dear Traders! Join me for Nasdaq market analysis. Share your charts, ask questions, and let's discuss trading strategies.

Nasdaq insights: 05-Feb-2025Good morning, traders! As a seasoned price action trader, I'll share my Nasdaq insights to help you improve your trading skills.

Nasdaq analysis: 04-Feb-2025Good morning, trading community! Today's Nasdaq analysis is for you. Share your thoughts, ask questions, and let me help you grow.

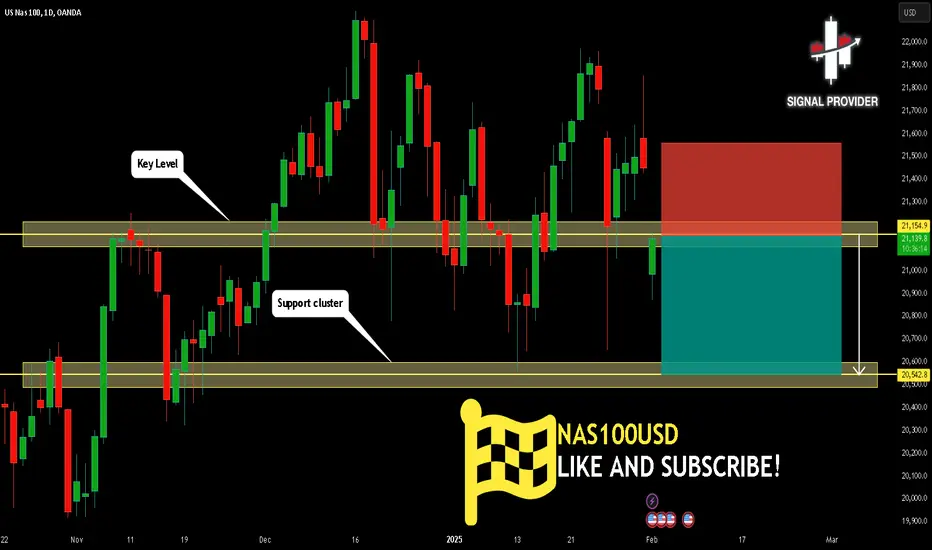
NAS100USD Will Fall! Sell!
Take a look at our analysis for NAS100USD.
Time Frame: 1D
Current Trend: Bearish
Sentiment: Overbought (based on 7-period RSI)
Forecast: Bearish
The market is trading around a solid horizontal structure 21,154.9.
The above observations make me that the market will inevitably achieve 20,542.8 level.
P.S
Please, note that an oversold/overbought condition can last for a long time, and therefore being oversold/overbought doesn't mean a price rally will come soon, or at all.
Like and subscribe and comment my ideas if you enjoy them!
Nasdaq market analysis: 03-Feb-2025Good morning! Happy New Week! Happy New Month! Here's your daily Nasdaq market analysis. Learn, grow, and trade wisely.

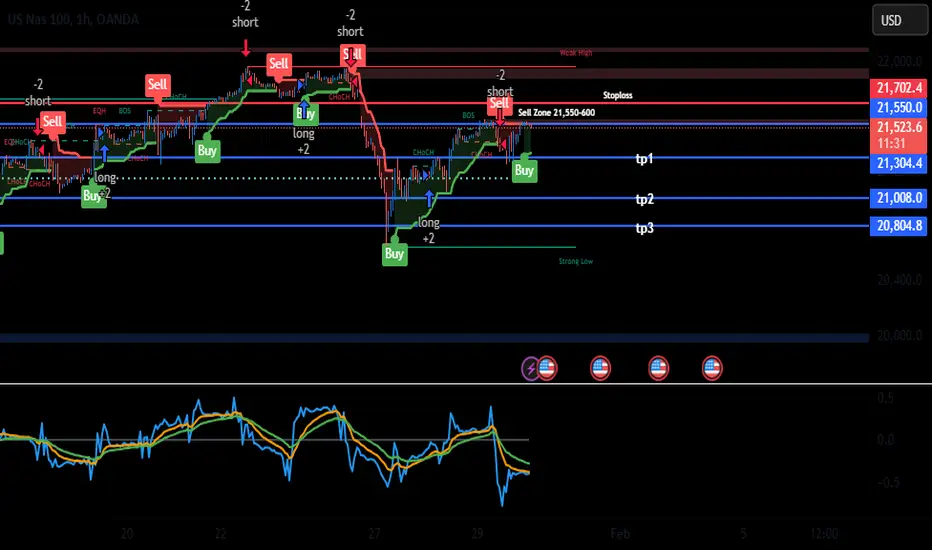
Navigating NAS100 with Key Levels and Market SentimentKey Levels:
Resistance remains at 21,600–21,700, where price is struggling to sustain higher levels.
Support lies around 20,800–21,000, a strong buy zone on higher timeframes.
Fundamental Outlook:
With upcoming key data (FOMC and GDP), markets are likely to remain volatile.
A hawkish FOMC statement may lead to bearish pressure, pushing NAS100 lower toward the 20,800–21,000 support zone.
Conversely, dovish commentary or weak GDP figures could provide a bullish breakout above 21,600, targeting 21,800–22,000.
Rationale:
The price is testing a major resistance zone (21,600–21,700) but shows signs of hesitation and rejection on multiple timeframes.
A hawkish FOMC decision or commentary could trigger a sell-off, aligning with the probability of bearish momentum.
Action:
If price fails to break and hold above 21,600, short near 21,550–21,600.
Stop Loss: 21,700
Take Profits:
TP1: 21,300
TP2: 21,000
TP3: 20,800
Focus on a short position, especially if price fails to sustain above 21,600 during the London or New York sessions
Nasdaq market analysis: 31-Jan-2025Let’s dive into today's Nasdaq market analysis. Share insights, and potentially spot opportunities for good pips.

Nasdaq analysis: 30-Jan-2025Good morning, everyone! Today's Nasdaq analysis is designed to educate and empower. Use these insights to refine your price action trading strategy.

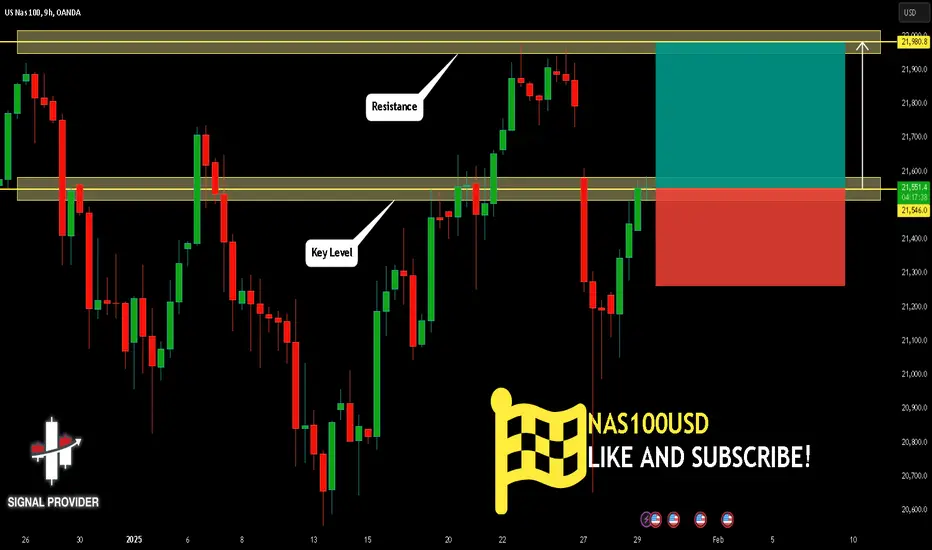
NAS100USD Will Grow! Long!
Here is our detailed technical review for NAS100USD.
Time Frame: 9h
Current Trend: Bullish
Sentiment: Oversold (based on 7-period RSI)
Forecast: Bullish
The price is testing a key support 21,546.0.
Current market trend & oversold RSI makes me think that buyers will push the price. I will anticipate a bullish movement at least to 21,980.8 level.
P.S
The term oversold refers to a condition where an asset has traded lower in price and has the potential for a price bounce.
Overbought refers to market scenarios where the instrument is traded considerably higher than its fair value. Overvaluation is caused by market sentiments when there is positive news.
Like and subscribe and comment my ideas if you enjoy them!
Actionable Nasdaq insights: 29-Jan-2025Rise and shine, traders! Start your day with actionable Nasdaq insights. Let's grow your skills together, one chart at a time.

Nasdaq market analysis: 28-Jan-2025Good morning, traders! Welcome to today's Nasdaq market analysis. Compare my price action insights with your own charts and enhance your trading skills.

#NAS100USD 4HNAS100USD (4H Timeframe) Analysis
Market Structure:
The price has formed a sell engulfing candlestick pattern in a key resistance area, indicating increased selling pressure. This bearish reversal pattern suggests that sellers are gaining control, and the price may start moving lower from this area.
Forecast:
A sell opportunity is expected as the sell engulfing pattern signals a potential bearish reversal. The price is likely to target nearby support levels if the selling momentum continues.
Key Levels to Watch:
- Entry Zone: Near the sell engulfing area after confirmation of continued bearish pressure.
- Risk Management:
- Stop Loss: Placed above the high of the sell engulfing candlestick to manage risk.
- Take Profit: Target significant support levels below for potential downside movement.
Market Sentiment:
The sell engulfing candlestick pattern reflects bearish sentiment, suggesting a potential reversal from the current resistance area. Proper confirmation is recommended before entering the trade to align with market momentum.

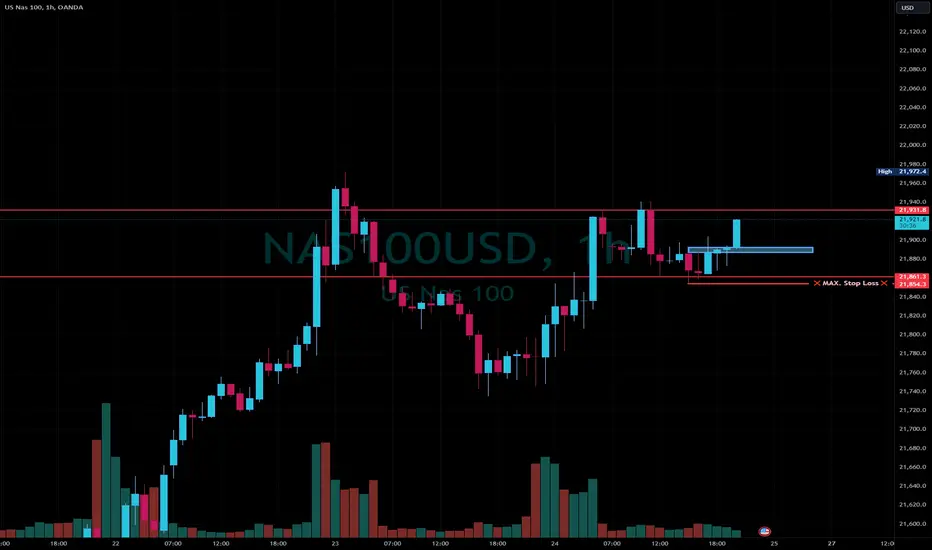
NAS100USD, Long Setup H1 chart👋Hello Traders,
Our 🖥️ AI system detected that there is an H1 timeframe ICT Long setup in
NAS100USD for session trade (a couple of Hours)
Cup and Handle Breakout!
Here is a session trade idea Sell limit order level for reference, TP and SL in pips
Cancel limit order before any great news in Forex.
For more ideas, you are welcome to visit our profile in tradingview.
Have a good day!
Please give this post a like if you like this kind of simple idea, your feedback will bring our signal to next better level, thanks for support!
Nasdaq trading insights: 24-Jan-2025Nasdaq trading insights: Not signals, but informative zones to aid your decision-making. Please note: These zones are not trading advice. Use them as a starting point for your own analysis.

Nasdaq market analysis: 23-Jan-2025Good morning. Welcome to today's Nasdaq market analysis and educational insights for price action traders.
#Nasdaq
#StockMarket
#Trading
#Investing
#DayTrading
#SwingTrading
#TechnicalAnalysis
#MarketAnalysis
#FinancialNews
#WallStreet
#NasdaqToday
#NasdaqAnalysis
#NasdaqTrading
#StockMarketNews
#MarketTrends
#InvestmentStrategies
#FinancialMarkets
#TradingTips
#NasdaqForecast
#MarketInsights
#Nasdaq100
#TechStocks
#GrowthStocks
#IndexFunds
#ETFs
#StockMarketAnalysis
#TradingStrategies
#RiskManagement
#InvestorEducation
#FinancialLiteracy
#EarningsSeason
#FederalReserve
#EconomicIndicators
#MarketVolatility
#GlobalMarkets
