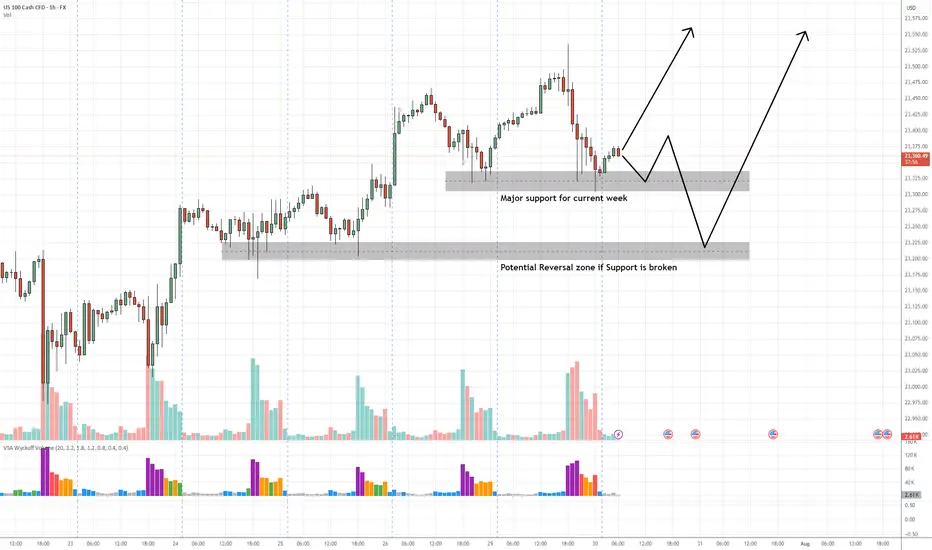
NAS100 Buy Setup – VSA & Multi-Zone Demand Analysis✅ Primary Entry Zone: Major support for current week (around 23,325–23,350)
✅ Secondary Entry Zone: Potential reversal zone if primary support is broken (around 23,200–23,230)
🎯 Target 1 (TP1): Previous swing high near 23,500
🎯 Target 2 (TP2): Extension above 23,550
🛑 Stop Loss (SL): Below 23,170 (beyond secondary reversal zone to avoid false breaks)
📊 Technical Insight (VSA & Price Action Structure)
Support Structure:
The current major support zone has been tested multiple times with no follow-through selling, indicating strong buying interest from larger players.
Volume Spread Analysis Observations:
On the recent decline into the major support zone, we see wider spreads on high volume followed by narrow range candles on lower volume, a classic sign of stopping volume and supply exhaustion.
Within the secondary reversal zone, historical reactions show climactic volume spikes leading to sharp reversals, suggesting this level is watched closely by smart money.
Any test back into the zone on low volume would confirm the No Supply (NS) condition.
Trade Pathways:
Scenario 1: Price respects the major support and begins to climb, confirming demand dominance → target TP1 then TP2.
Scenario 2: Support is temporarily breached, triggering a liquidity grab into the secondary reversal zone, followed by a bullish reversal bar on high volume → strong buy signal with potentially faster move toward TP levels.
📍 Bias: Bullish as long as price holds above the secondary reversal zone.
📌 Execution Tip: Wait for a wide spread up-bar on increased volume from either zone to confirm the start of the markup phase.
Nas100usdidea
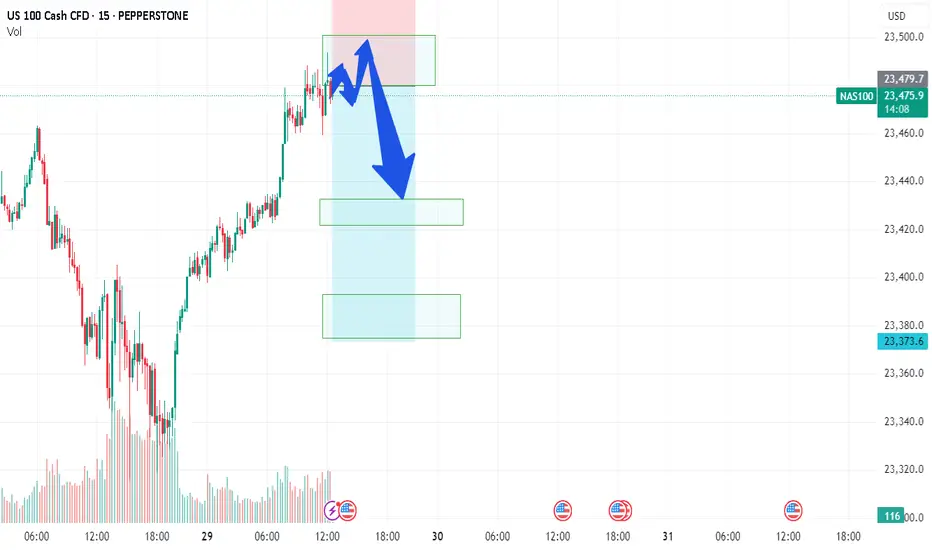
NAS/TEC100 - LETS GET NASTY ON NAS100Team, NAS currently sitting at 23480, before the US market open
however during the market open, please be aware of the volatility that may hit your stop loss
You have 2 options to trade on this NAS- NASTY
Option 1: wait for market open, if it hits 23500-23515 - then short with stop loss at 23580
Option 2: Short at the current market with small volume - and if the market open with volatile, you can take another advantage of shorting more volume as per option 1 instructed.
OK, pick your strategy! do NOT be shy.
I am going to have small short position and will consider adding more during US market opening after 5-10 minutes, much easier to see the direction of the market - we do LIVE trading everyday. Please note: if NAS fall below 23450-40 bring stop loss to BE (Break even)
1st TARGET range: 23435-23416 - make sure take 70% volume
2nd target at 23390 to 23376
Why do I short on NAS when tomorrow rate decision, i think this quarter report, market will not be the same as last quarter, even rate cut!
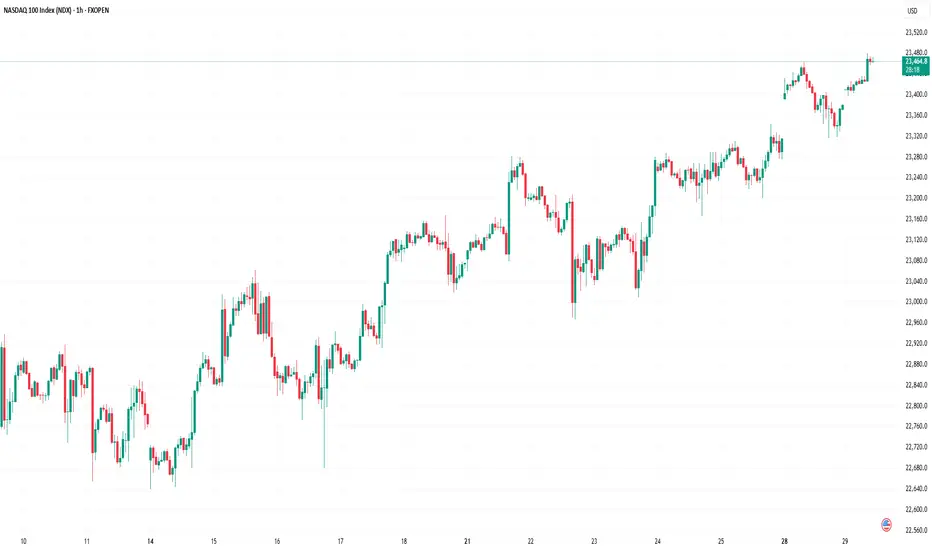
Nasdaq 100 Index Hits New Highs Ahead of Big Tech EarningsNasdaq 100 Index Hits New Highs Ahead of Big Tech Earnings
Earlier, we noted signs of optimism in the Nasdaq 100 index as the market anticipated earnings reports from major tech firms.
Now, companies such as Alphabet (GOOGL) and Tesla (TSLA) have already released their results (we previously covered their charts → here and here). Up next are the most highly anticipated earnings reports: this week, tech giants including Microsoft (MSFT), Amazon (AMZN), Meta Platforms (META), and Apple (AAPL) are set to publish their results. The combined market capitalisation of these four companies exceeds $11 trillion, and their reports could have a significant impact on a stock market that is already showing strong bullish sentiment:
→ The Nasdaq 100 index has climbed to an all-time high, surpassing the 23,400 mark.
→ The signing of trade agreements between the US and Europe (and earlier, Japan) has eased concerns about the negative impact of tariff barriers.
Technical Analysis of Nasdaq 100
The chart supports growing signs of optimism: earlier in July, the price remained within a rising channel (marked in blue). However, towards the end of the month, price action has begun to follow a steeper upward trajectory (marked in purple).
What could happen next? Much will depend on the earnings results and forward guidance from these tech giants.
On the one hand, continued enthusiasm around AI adoption could accelerate further growth. The stronger the optimism, the more fuel it may add to discussions around a potential bubble — with some analysts already drawing parallels to the dot-com era of the early 2000s.
On the other hand, earnings could temper market excitement and prompt a correction. For example, the index may retreat to the support level around 23,020, which is reinforced by the lower boundary of the blue trend channel.
This article represents the opinion of the Companies operating under the FXOpen brand only. It is not to be construed as an offer, solicitation, or recommendation with respect to products and services provided by the Companies operating under the FXOpen brand, nor is it to be considered financial advice.
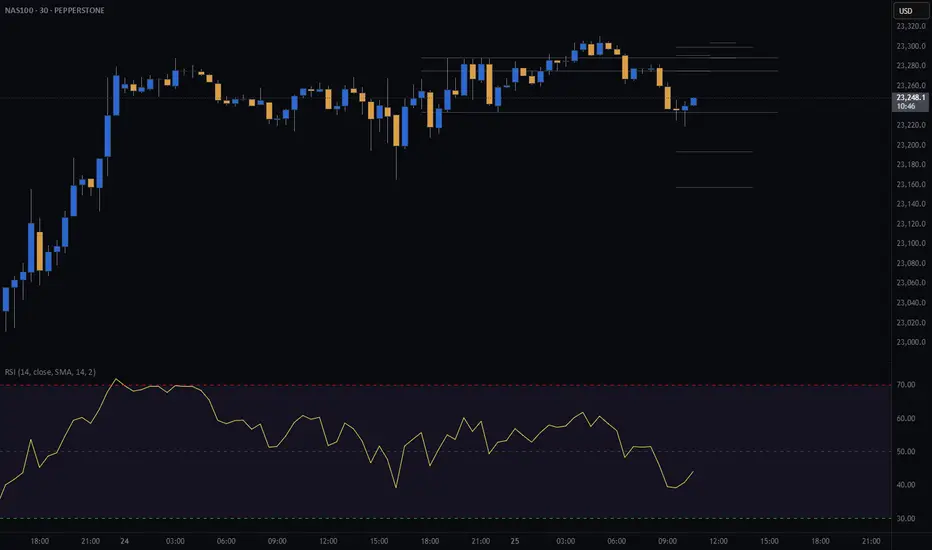
NDX (NASDAQ) CASH500 SHORT - Head and shoulders 30minRisk/reward = 3.2
Entry price = 23 275.7
Stop loss price = 23 303.9
Take profit level 1 (50%) = 23 193
Take profit level 2 (50%) = 23 157
Waiting on confirmation on a number of variables before entering the trade.
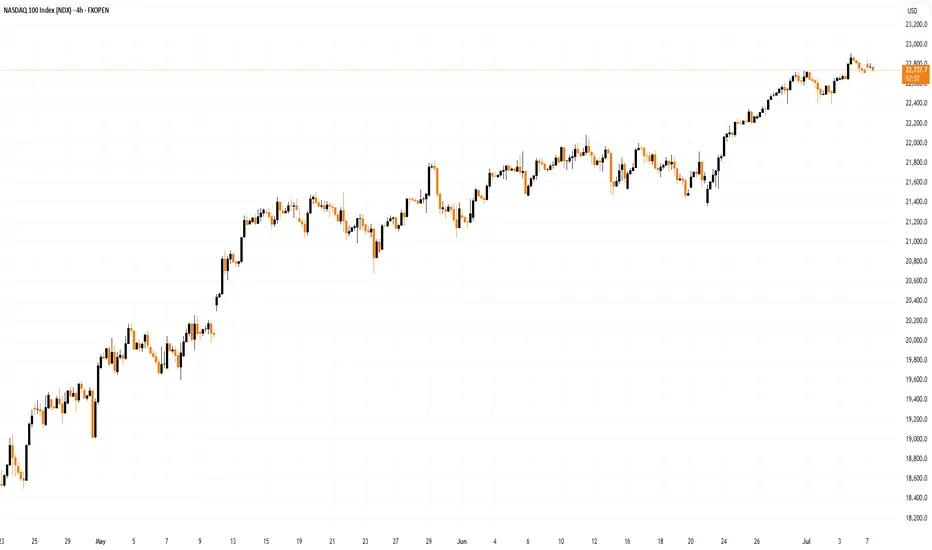
Nasdaq 100: Bearish Signals Near the All-Time HighNasdaq 100: Bearish Signals Near the All-Time High
As the 4-hour chart of the Nasdaq 100 (US Tech 100 mini on FXOpen) shows, the index reached a new all-time high last week. However, the price action suggests that the current pace of growth may not last.
Last week’s strong labour market data triggered a significant bullish impulse. However, the upward momentum has been entirely retraced (as indicated by the arrows).
The tax cut bill signed on Friday, 4 July, by Trump — which is expected to lead to a significant increase in US government debt — contributed to a modest bullish gap at today’s market open. Yet, as trading progressed during the Asian session, the index declined.
This suggests that fundamental news, which could have served as bullish catalysts, are failing to generate sustainable upward movement — a bearish sign.
Further grounds for doubt regarding the index's continued growth are provided by technical analysis of the Nasdaq 100 (US Tech 100 mini on FXOpen) chart, specifically:
→ a bearish divergence on the RSI indicator;
→ price proximity to the upper boundary of the ascending channel, which is considered resistance.
It is reasonable to suggest that the market may be overheated and that bullish momentum is waning. Consequently, a correction may be forming — potentially involving a test of the 22,100 level. This level acted as resistance from late 2024 until it was broken by strong bullish momentum in late June.
This article represents the opinion of the Companies operating under the FXOpen brand only. It is not to be construed as an offer, solicitation, or recommendation with respect to products and services provided by the Companies operating under the FXOpen brand, nor is it to be considered financial advice.
NASDAQ Potential Bearish Reversal Analysis NASDAQ Potential Bearish Reversal Analysis 🧠🔻
The chart illustrates a potential bearish setup forming after a recent uptrend in NASDAQ. Let's break it down professionally:
🔍 Technical Overview:
Ascending Trendline Break ✅
Price had been respecting a steady ascending trendline.
A break below this trendline indicates a possible momentum shift from bullish to bearish.
Bearish Pattern Formation 🔷
A bearish flag/pennant-like formation can be observed after the sharp rise.
This consolidation followed by a breakdown could be a continuation pattern, hinting at further downside.
Resistance Rejection 🔴
A red arrow marks a clear rejection from the resistance zone near 22,800 USD.
Strong wick rejections and bearish candles suggest selling pressure at that level.
Support Turned Resistance (SUPPOT 🛑)
The previously broken support zone is now acting as resistance (note: "SUPPOT" appears misspelled—should be "SUPPORT").
Bearish Target Zone 🎯
The chart marks a "TAEGET" zone (should be "TARGET") near the 21,900 – 22,000 USD range.
This aligns with prior consolidation and demand zones, making it a likely area for price to retrace.
📌 Key Zones:
Resistance (Rejection Area): 22,800 USD
Current Price: 22,739.7 USD
Bearish Target Zone: 21,900 – 22,000 USD
⚠️ Conclusion:
The market shows signs of a bearish reversal with a confirmed trendline break, resistance rejection, and bearish pattern formation. If the price fails to reclaim the 22,800 level, there’s a high probability of downward continuation toward the 22,000 target.

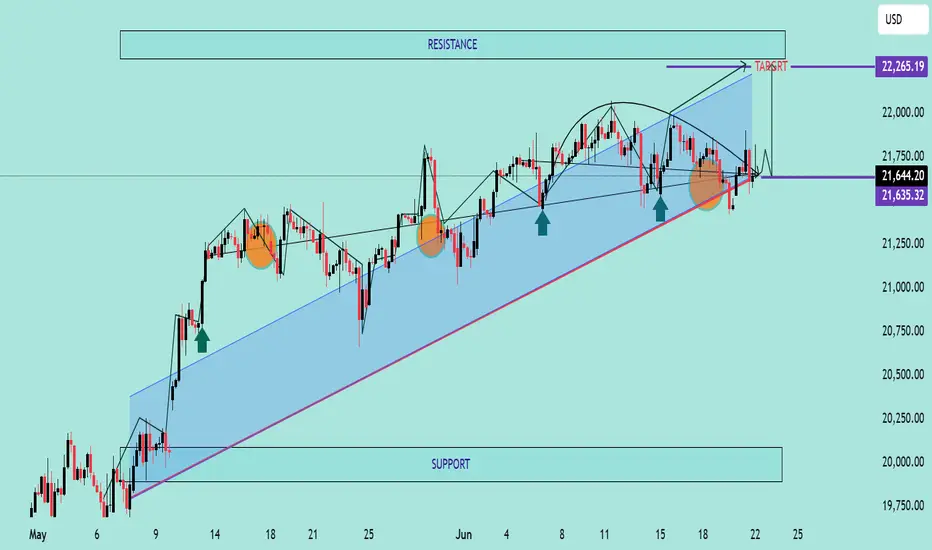
NAS100 Bullish Breakout SetupNAS100 Bullish Breakout Setup 🚀
🧠 Chart Analysis (H4 timeframe)
🔹 Ascending Channel:
Price has been trending inside a clear ascending channel (blue zone), supported by higher highs and higher lows.
🔹 Support & Resistance:
Support: Around 21,635.32 – tested multiple times (highlighted by 🔵 arrows).
Resistance: Around 22,265.19 – recent highs and psychological barrier.
🔹 Double Bottom Formation 👣:
Near support zone, a potential double bottom (bullish reversal pattern) is visible. The neckline has been challenged.
🔹 Breakout Confirmation 🟢:
Price has broken above the descending neckline of the double bottom and is hovering near 21,644, indicating potential bullish continuation if sustained.
🔹 Target 🎯:
Projected breakout target lies at 22,265.19, aligning with the previous resistance zone.
🔹 Volume & Momentum 📊:
While not shown, a breakout above the neckline generally needs strong volume confirmation to validate the move.
📌 Conclusion:
If price sustains above the 21,635 – 21,644 area and gains momentum, the path to 22,265 looks likely ✅. However, a false breakout could drag the price back into the channel.
-(update)- Opportunity for buying NASDAQ After careful observation and relying on support and resistance, I see an upward movement from the support represented in front of you.
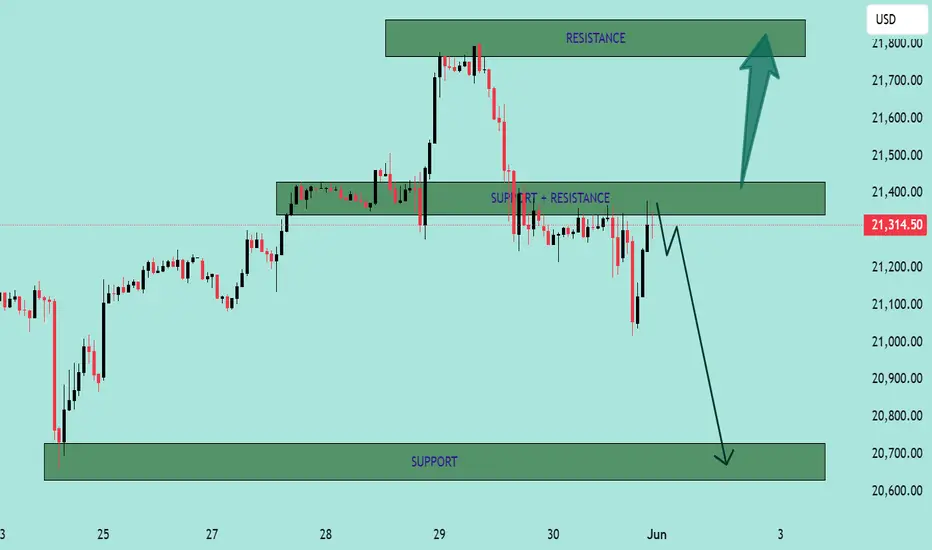
NASDAQ100 Analysis – Key S/R Zones & Price Reaction Incoming! NASDAQ100 Analysis – Key S/R Zones & Price Reaction Incoming! 🚨
🔍 Chart Breakdown:
This is a technical chart analysis of NASDAQ100 (NAS100) with defined Support and Resistance zones. The price is currently at 21,314.50, sitting below a critical decision area.
🧱 Key Zones:
🔵 Resistance Zone:
‣ 21,640 – 21,800
‣ Strong supply area where price sharply reversed previously.
‣ If price breaks above the mid resistance zone, a bullish move towards this level is likely.
🟩 Support + Resistance Flip Zone:
‣ 21,280 – 21,420
‣ Former support, now acting as resistance.
‣ Price is struggling to reclaim this zone.
‣ Acts as a key decision level.
🟢 Support Zone:
‣ 20,630 – 20,750
‣ Strong demand zone from which previous rallies initiated.
‣ Target if bearish rejection continues.
🔄 Price Action Insight:
Price is currently rejecting the Support-turned-Resistance zone.
There’s a clear bearish rejection at the mid-zone (S/R flip), forming a lower high structure.
📉 A breakdown from current levels could lead to a retest of the support zone at 20,700 area.
🟢 However, a successful reclaim and bullish confirmation above 21,420 could see price target the upper resistance at 21,800.
📌 Outlook:
🔽 Bearish Bias if price fails to break above 21,420 – possible drop to 20,700.
🔼 Bullish Reversal above 21,420 could drive price to 21,800.
📅 Date: June 1, 2025
🕒 Timeframe: Likely 1H or 4H chart
💬 “Respect the levels, not the noise.”
Trade safe! ✅
"NAS100/US100" Index Market Money Heist Plan (Day / Scalping)🌟Hi! Hola! Ola! Bonjour! Hallo! Marhaba!🌟
Dear Money Makers & Robbers, 🤑💰✈️
Based on 🔥Thief Trading style technical and fundamental analysis🔥, here is our master plan to heist the "NAS100/US100" Index CFD Market. Please adhere to the strategy I've outlined in the chart, which emphasizes short entry. Our aim is the high-risk Green MA Zone. Risky level, oversold market, consolidation, trend reversal, trap at the level where traders and bullish robbers are stronger. 🏆💸"Take profit and treat yourself, traders. You deserve it!💪🏆🎉
Entry 📈 : "The heist is on! Wait for the MA breakout then make your move at (16400) - Bearish profits await!"
however I advise to Place sell stop orders above the Moving average (or) after the Support level Place sell limit orders within a 15 or 30 minute timeframe most NEAREST (or) SWING low or high level.
📌I strongly advise you to set an "alert (Alarm)" on your chart so you can see when the breakout entry occurs.
Stop Loss 🛑: "🔊 Yo, listen up! 🗣️ If you're lookin' to get in on a sell stop order, don't even think about settin' that stop loss till after the breakout 🚀. You feel me? Now, if you're smart, you'll place that stop loss where I told you to 📍, but if you're a rebel, you can put it wherever you like 🤪 - just don't say I didn't warn you ⚠️. You're playin' with fire 🔥, and it's your risk, not mine 👊."
📌Thief SL placed at the nearest/swing High or Low level Using the 4H timeframe (17300) Day/Scalping trade basis.
📌SL is based on your risk of the trade, lot size and how many multiple orders you have to take.
Target 🎯: 15300 (or) Escape Before the Target
"NAS100/US100" Index CFD Market Heist Plan (Scalping / Day Trade) is currently experiencing a Bearish trend.., driven by several key factors.👇👇👇
📰🗞️Get & Read the Fundamental, Macro, COT Report, Geopolitical and News Analysis, Sentimental Outlook, Intermarket Analysis, Index-Specific Analysis, Positioning and future trend targets... go ahead to check 👉👉👉🔗🔗
Detailed Explanation 📝
Fundamentals: Growth stalls 📉, valuations adjust—bearish shift 🐻.
Macro: Cooling economy 🌍, sticky inflation 🔥—downward pressure.
COT: Speculators flee 📉, hedgers dig in—bearish signal 🐻.
Index: Correction deepens 📉, support tests near—technical bear 🐻.
Intermarket: Yields/USD crush risk assets 💪—bearish tide.
Geopolitical: Trade wars ⚔️, regulation 🔍—negative catalysts pile up.
Sentiment: Fear takes hold 😟—bearish consensus builds.
Trends: Near/medium-term declines 📉, long-term hinges on recovery ⚖️.
Outlook: Moderately bearish 🌩️—tough sledding ahead.
⚠️Trading Alert : News Releases and Position Management 📰 🗞️ 🚫🚏
As a reminder, news releases can have a significant impact on market prices and volatility. To minimize potential losses and protect your running positions,
we recommend the following:
Avoid taking new trades during news releases
Use trailing stop-loss orders to protect your running positions and lock in profits
💖Supporting our robbery plan 💥Hit the Boost Button💥 will enable us to effortlessly make and steal money 💰💵. Boost the strength of our robbery team. Every day in this market make money with ease by using the Thief Trading Style.🏆💪🤝❤️🎉🚀
I'll see you soon with another heist plan, so stay tuned 🤑🐱👤🤗🤩

"NAS100 / US100" Index CFD Market Heist Plan (Day or Swing)🌟Hi! Hola! Ola! Bonjour! Hallo! Marhaba!🌟
Dear Money Makers & Robbers, 🤑 💰💸✈️
Based on 🔥Thief Trading style technical and fundamental analysis🔥, here is our master plan to heist the "NAS100 / US100" Index CFD Market. Please adhere to the strategy I've outlined in the chart, which emphasizes long entry. Our aim is the high-risk Red Zone. Risky level, overbought market, consolidation, trend reversal, trap at the level where traders and bearish robbers are stronger. 🏆💸"Take profit and treat yourself, traders. You deserve it!💪🏆🎉
Entry 📈 : "The heist is on! Wait for the MA breakout (20000) then make your move - Bullish profits await!"
however I advise to Place Buy stop orders above the Moving average (or) Place buy limit orders within a 15 or 30 minute timeframe most recent or swing, low or high level.
📌I strongly advise you to set an alert on your chart so you can see when the breakout entry occurs.
Stop Loss 🛑:
Thief SL placed at the recent/swing low level Using the 1H timeframe (19400) swing trade basis.
SL is based on your risk of the trade, lot size and how many multiple orders you have to take.
🏴☠️Target 🎯: 20800 (or) Escape Before the Target
🧲Scalpers, take note 👀 : only scalp on the Long side. If you have a lot of money, you can go straight away; if not, you can join swing traders and carry out the robbery plan. Use trailing SL to safeguard your money 💰.
"NAS100 / US100" Index CFD Market Heist Plan (Swing/Day) is currently experiencing a bullishness,., driven by several key factors.
📰🗞️Get & Read the Fundamental, Macro, COT Report, Geopolitical and News Analysis, Sentimental Outlook, Intermarket Analysis, Index-Specific Analysis, Positioning and future trend targets.. go ahead to check 👉👉👉
📌Keep in mind that these factors can change rapidly, and it's essential to stay up-to-date with market developments and adjust your analysis accordingly.
⚠️Trading Alert : News Releases and Position Management 📰 🗞️ 🚫🚏
As a reminder, news releases can have a significant impact on market prices and volatility. To minimize potential losses and protect your running positions,
we recommend the following:
Avoid taking new trades during news releases
Use trailing stop-loss orders to protect your running positions and lock in profits
💖Supporting our robbery plan 💥Hit the Boost Button💥 will enable us to effortlessly make and steal money 💰💵. Boost the strength of our robbery team. Every day in this market make money with ease by using the Thief Trading Style.🏆💪🤝❤️🎉🚀
I'll see you soon with another heist plan, so stay tuned 🤑🐱👤🤗🤩

NASDAQ 100 (NAS100) Technical Outlook
NAS100 is currently in a corrective phase, trading at $18,900, with bearish momentum suggesting a potential move toward the $18,300 support level in the coming week. If this level holds, a rebound could push the index back up toward $20,300, creating a temporary recovery phase.
However, if the price struggles at $20,300 and fails to sustain bullish momentum, it would confirm the formation of a descending channel, reinforcing the broader downtrend. In this scenario, NAS100 could extend its decline toward $16,100, where the price may find support.
Key structural levels to watch:
Support Levels: $18,300 → $16,100 → $14,600 (Major support from 2021)
Resistance Levels: $20,300 → $16,000 (Resistance from 2023)
If the index reaches $16,100, this could serve as a critical level where a strong reaction may occur, as it aligns with historical price zones and previous sell-off extensions. The $14,600 support from 2021 remains a last defense level, potentially preventing deeper declines.
Traders should monitor volume and price action confirmations at key levels to assess whether the index is setting up for a reversal or further downside continuation.

Nasdaq market analysis: 01-APRIL-2025Good morning! Happy New Day! Here's your daily Nasdaq market analysis. Learn, grow, and trade wisely.

"NAS100/US100" Indices Market Heist Plan (Scalping / Day Trade)🌟Hi! Hola! Ola! Bonjour! Hallo! Marhaba!🌟
Dear Money Makers & Robbers, 🤑 💰💸✈️
Based on 🔥Thief Trading style technical and fundamental analysis🔥, here is our master plan to heist the "NAS100/US100" Indices Market. Please adhere to the strategy I've outlined in the chart, which emphasizes long entry. Our aim is the high-risk Red Zone. Risky level, overbought market, consolidation, trend reversal, trap at the level where traders and bearish robbers are stronger. 🏆💸"Take profit and treat yourself, traders. You deserve it!💪🏆🎉
Entry 📈 : "The vault is wide open! Swipe the Bullish loot at any price - the heist is on!
however I advise to Place buy limit orders within a 15 or 30 minute timeframe most recent or swing, low or high level. I Highly recommended you to put alert in your chart.
Stop Loss 🛑:
Thief SL placed at the recent/swing low level Using the 30m timeframe (19700) swing trade basis.
SL is based on your risk of the trade, lot size and how many multiple orders you have to take.
🏴☠️Target 🎯: 20350 (or) Escape Before the Target
🧲Scalpers, take note 👀 : only scalp on the Long side. If you have a lot of money, you can go straight away; if not, you can join swing traders and carry out the robbery plan. Use trailing SL to safeguard your money 💰.
"NAS100/US100" Indices Market Heist Plan (Scalping / Day Trade) is currently experiencing a bullishness,., driven by several key factors.
📰🗞️Get & Read the Fundamental, Macro, COT Report, Geopolitical and News Analysis, Sentimental Outlook, Intermarket Analysis, Index-Specific Analysis, Positioning and future trend targets.. go ahead to check 👉👉👉
📌Keep in mind that these factors can change rapidly, and it's essential to stay up-to-date with market developments and adjust your analysis accordingly.
⚠️Trading Alert : News Releases and Position Management 📰 🗞️ 🚫🚏
As a reminder, news releases can have a significant impact on market prices and volatility. To minimize potential losses and protect your running positions,
we recommend the following:
Avoid taking new trades during news releases
Use trailing stop-loss orders to protect your running positions and lock in profits
💖Supporting our robbery plan 💥Hit the Boost Button💥 will enable us to effortlessly make and steal money 💰💵. Boost the strength of our robbery team. Every day in this market make money with ease by using the Thief Trading Style.🏆💪🤝❤️🎉🚀
I'll see you soon with another heist plan, so stay tuned 🤑🐱👤🤗🤩

Will NASDAQ Rally Continue? Technical Analysis & Trade Idea.NASDAQ NAS100 (4H Chart) Analysis 📊📈
The NASDAQ NAS100 is showing strong bullish momentum on the 4-hour chart. The chart suggests a continuation of the uptrend, with a potential move toward the 21,013.0 target. 🚀
Key Levels to Watch 👀
Support Levels:
19,750.9: Near the 61.8% Fibonacci retracement, this level has seen strong buying interest.
19,405.8: The 100% Fibonacci retracement, marking the swing low and a critical support zone.
Resistance Levels:
20,209.4: The 0% Fibonacci retracement, acting as immediate resistance.
20,611.2: The 50% Fibonacci extension, a key target for bullish continuation.
21,013.0: The 100% Fibonacci extension, representing the ultimate bullish target in this trend.
Volume Profile Insights 📉
The Volume Profile shows heavy trading activity between 19,800–20,000, confirming strong support in this range. Above 20,200, trading volume thins out, suggesting that a breakout could lead to a quick rally toward 21,000.
Momentum and Indicators ⚡
Trend: The index is in a clear uptrend, forming higher highs and higher lows since the recent swing low.
Fibonacci Confluence: The alignment of the 50% retracement and Volume Profile support strengthens the bullish outlook.
Curved Arrow Projection: A pullback to the 19,800–19,750 zone is likely before the next leg higher toward 21,013.0.
Social Media Sentiment 🌐
Twitter: Analysts are optimistic, citing strong tech sector performance and easing interest rate fears. Many traders are eyeing the 21,000 level as the next milestone.
Reddit: Discussions emphasize the importance of the 19,800 support zone, warning that a break below this level could invalidate the bullish setup.
Conclusion 📝
The NASDAQ NAS100 is set for a bullish continuation, with key support at 19,750–19,800 and resistance at 20,209.4 and 21,013.0. Watch for a potential pullback to the 50% Fibonacci retracement before the next upward move. A break below 19,750 could signal a shift in momentum, while a breakout above 20,209.4 would confirm the bullish trend. 🚀
Disclaimer: This analysis is for informational purposes only and not financial advice. Always do your own research and consult a professional before trading. 📢

Nasdaq analysis: 21-MAR-2025Good morning, traders! Today's Nasdaq analysis will help you achieve your trading goals. Let's work together towards success.

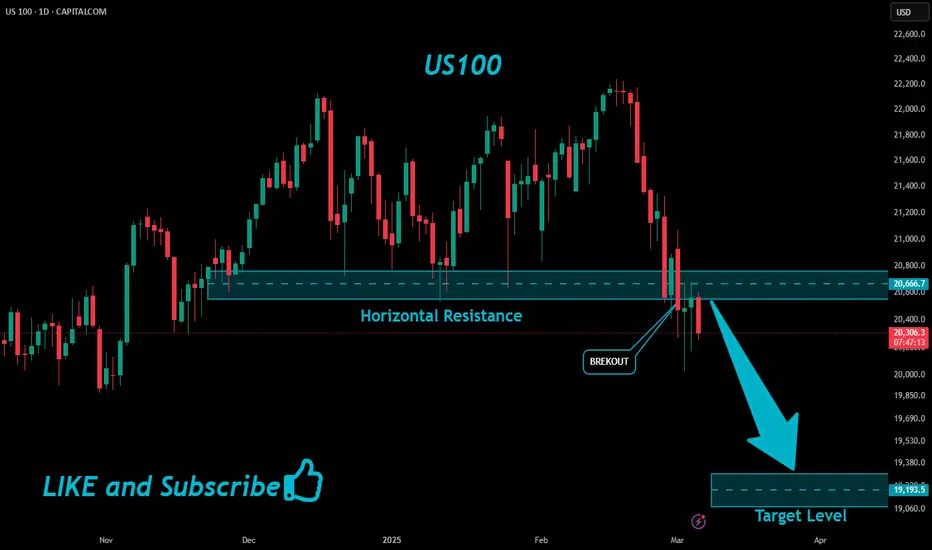
US100 Short From Resistance!
HI,Traders !
US100 has retested a
A horizontal resistance
Of 20669.2 from where
A bearish reaction can be
Observed already and so
We will be expecting a
Further bearish correction !
Comment and subscribe to help us grow !
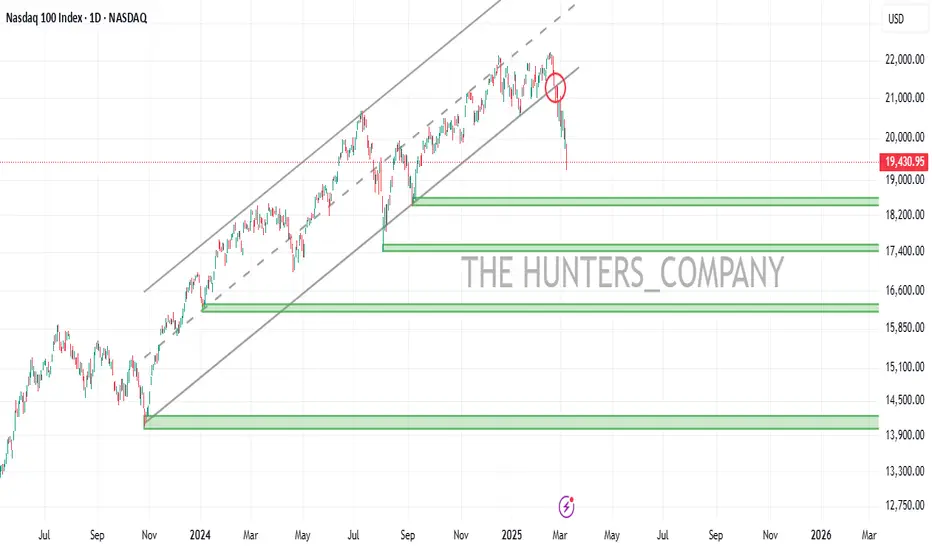
NASDAQ100Hello friends
Our ascending channel had a strong break and considering the negative news, how far do you think the decline will continue?
The support levels identified can help you trade, but we need to see where the price will go with the news that will be announced this week...
*Trade safely with us*
Nasdaq analysis: 06-MAR-2025Good morning, everyone! Today's Nasdaq analysis is designed to educate and empower. Use these insights to refine your price action trading strategy.

#NAS100USD 4HNAS100USD (4H Timeframe) Analysis
Market Structure:
The price has formed a sell engulfing candlestick pattern in a key resistance area, indicating increased selling pressure. This bearish reversal pattern suggests that sellers are gaining control, and the price may start moving lower from this area.
Forecast:
A sell opportunity is expected as the sell engulfing pattern signals a potential bearish reversal. The price is likely to target nearby support levels if the selling momentum continues.
Key Levels to Watch:
- Entry Zone: Near the sell engulfing area after confirmation of continued bearish pressure.
- Risk Management:
- Stop Loss: Placed above the high of the sell engulfing candlestick to manage risk.
- Take Profit: Target significant support levels below for potential downside movement.
Market Sentiment:
The sell engulfing candlestick pattern reflects bearish sentiment, suggesting a potential reversal from the current resistance area. Proper confirmation is recommended before entering the trade to align with market momentum.

#NAS100USD 4HNAS100USD (4H Timeframe) Analysis
Market Structure:
The price is consolidating within a symmetrical triangle pattern, indicating indecision in the market. This pattern reflects a balance between buyers and sellers, with the potential for a breakout in either direction.
Forecast:
A breakout on either side of the triangle will determine the next directional move. Traders are advised to wait for confirmation before entering a position.
Key Levels to Watch:
Entry Zone: Wait for a confirmed breakout above the resistance or below the support of the triangle.
Risk Management:
Stop Loss: Placed beyond the opposite side of the breakout to manage risk.
Take Profit: Target measured moves based on the height of the triangle, projected from the breakout point.
Market Sentiment:
The symmetrical triangle suggests neutral sentiment, with the potential for significant movement depending on the breakout direction.

Nasdaq analysis: 09-Jan-2025Good morning, everyone! Today's Nasdaq analysis is designed to educate and empower. Use these insights to refine your price action trading strategy.

NAS100 Overextended? Anticipating a Retracement to Re-BalanceThe NAS 100 has seen a sharp move to the downside and, in my view, is overextended. It has reached previous lows on the daily timeframe, sweeping southside liquidity. Considering the extreme nature of this move and the presence of significant gaps or imbalances above, I anticipate a retracement as the market seeks to rebalance. Additionally, there is buy-side liquidity resting above that could serve as a target. I’m watching for a potential buying opportunity if the conditions outlined in the video materialize. This is not financial advice.
