#202523 - priceactiontds - weekly update - nasdaq e-mini futuresGood Day and I hope you are well.
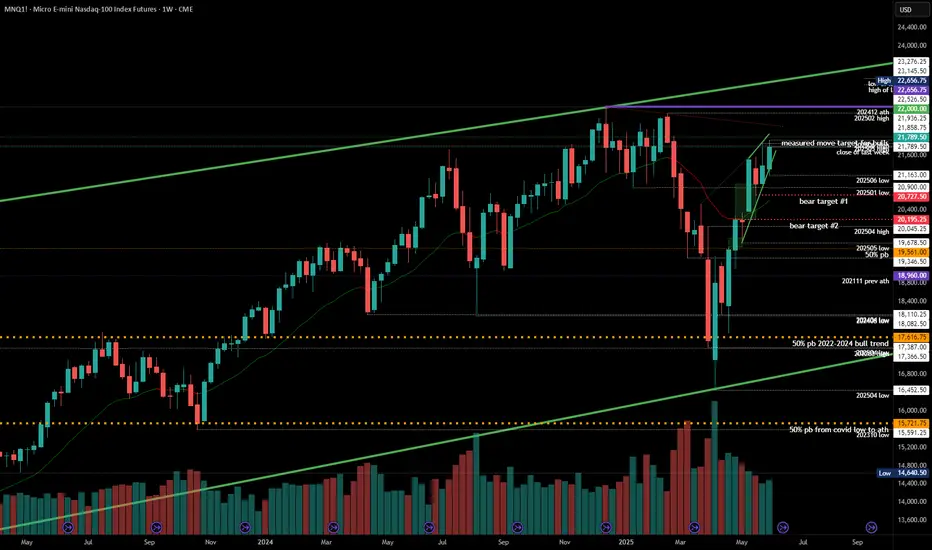
comment: Same as last week, markets are all very similar. Nq is also in a wedge right under the big round number. I doubt bears can prevent the bulls from printing 22000 but bulls have certainly tried long enough now. Either they get it next week, or it won’t happen for couple of weeks/months.
current market cycle: trading range on the weekly tf, bull wedge on the daily tf
key levels for next week: 20700 - 22000
bull case: Can bulls find enough buyers above 21900 next week to push for 22000 or even a new ath above 22656? Right now bulls are still favored for everything but that does not mean buying above 21500 is a good trade. If you were to buy right now at 21789, your stop has to be 21720 or better 21655. You would be buying at the very top of an ascending triangle we have been in since Thursday. It’s certainly not a good short but I wouldn’t buy it either.
Invalidation is below 21300
bear case: Bears need to close the gap down to 21300 and then we can talk about the highs being in, maybe. For now they fail at making lower lows and letting the bulls make higher highs. They are selling new highs but market is still grinding higher. For couple of weeks now I have been writing that for bears to change the character of the market, they would need a strong gap down or sell spike and leave an open gap. I do think it’s not bad by the bears that we have still not printed 22000, which everyone expected on Thursday but instead bulls had to give up again and we sold for 700 points. Long story short, bears have nothing and no one would be surprised if we print 23000 next week.
Invalidation is above 22100
short term: Neutral around 21800. Longs closer to the wedge trend line 21600 are likely decent. I expect at least 22000 to get hit before we could maybe turn. Most insane thing would be to see a giant melt-up next week and continuing for 23000 over the next 2-3 weeks. Certainly much higher possibility of that happening than a weekly close below 21000.
medium-long term - Update from 2024-06-07: Market is refusing to go down but I can not see this going much more up. Maybe we hit 22000 maybe we don’t. My assumption is still that latest around mid/end of July we begin to decline over the summer.
Nasdaq
NQ tumbles?Good day traders, I don't know why but I get a bit scared when it comes to analyzing NQ. I always doubt myself with it.
On the weekly TF price is trading inside an order block and for the past two weeks price has visited the order block two times. In the two times that price revisited the order block it failed to close above the midpoint indicating the strength of the order block, going into the new week I am going to use the discount zone of the OB+ as my resistance.
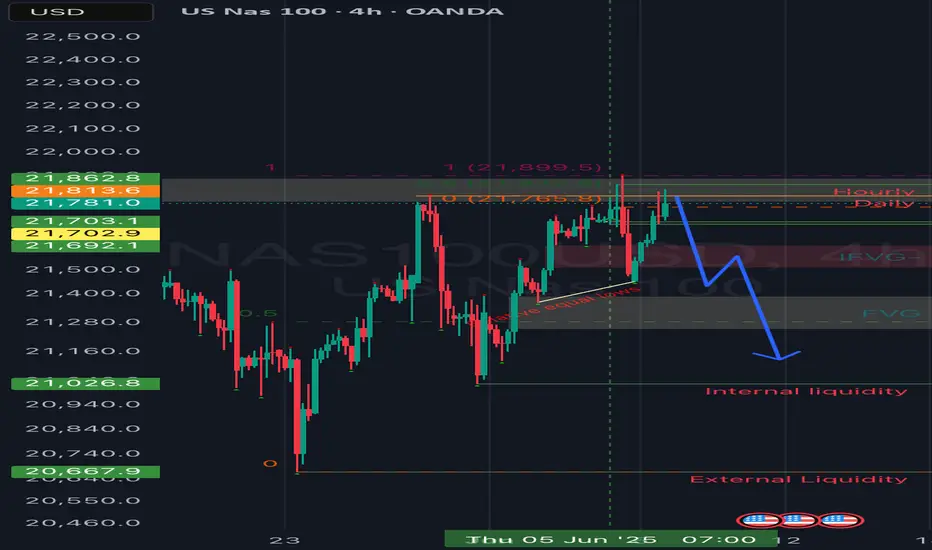
On the daily TF before I say much, THERE IS A GAP, and price did not trade to it since opening high on the 12th May. That gap is my target and I want to see price go and fill that volume imbalance as ICT calls it.
Still on the daily TF...when you read price for past two weeks on NQ, you'll quickly come to a realization that price has been expanding higher since Tuesday 3rd June, but expanding to where?...well liquidity resting above the high of the candle booked on the 29th of May.
Now on the 4 hour TF things are opening up and price is becoming clearer and it goes to show the importance of multi time frame analysis. The lows of Tuesday and Thursday make the relative equal lows that are shown on the chart. The internal liquidity shown below is my short term target or TP1. The red triangle represents that 4H inverse FVG and once price is trading below the inverse any movement inside that inverse should show weakness!
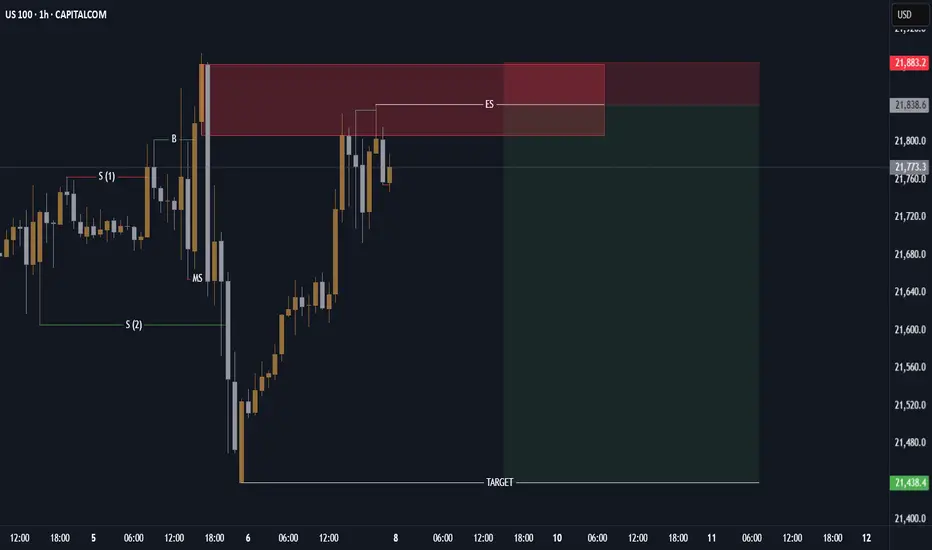
NASDAQBearish structure has formed, Waiting for further confirmation before looking for short positions.
SolarFX
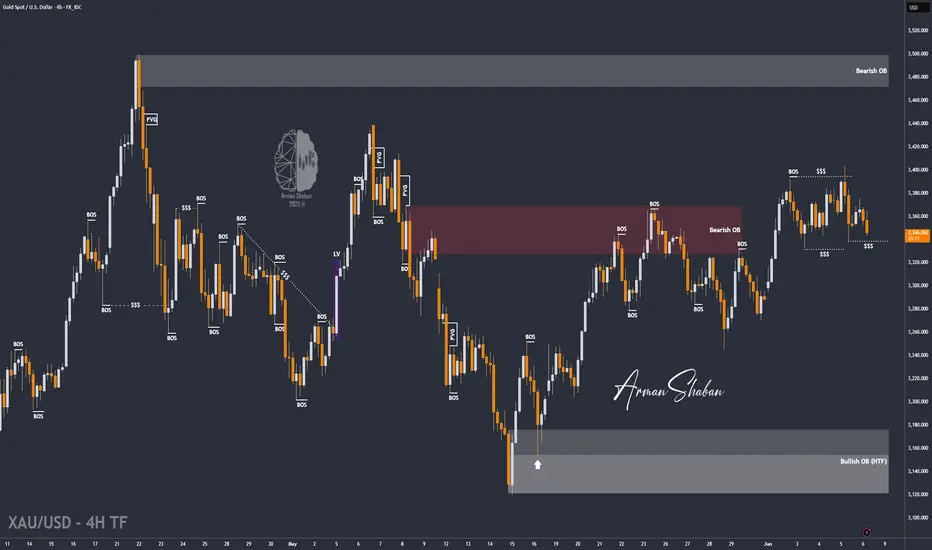
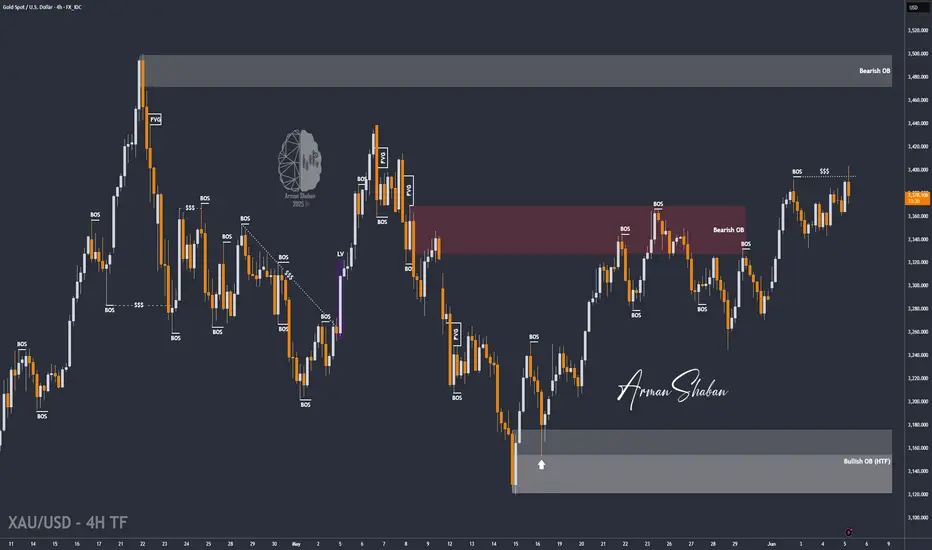
Gold Rejected Below $3370 — Eyes on Lower Demand Zones! (READ)By examining the gold chart on the 4-hour timeframe, we can see that after our previous analysis, the price climbed to $3388, giving us nearly 150 pips of return. However, gold was rejected from that level and failed to hold above $3370, eventually dropping below $3360.
Currently, gold is trading around $3348, and we may likely see further decline toward lower levels. The potential downside targets are $3338, $3332, $3326, and $3317.
Key demand zones to watch are:
→ $3327
→ $3311
→ $3298–$3300
→ $3278
Please support me with your likes and comments to motivate me to share more analysis with you and share your opinion about the possible trend of this chart with me !
Best Regards , Arman Shaban
Tesla Update Longs and shorts At the start of the video I recap my previous video and then bring us up to date with the present price action .
In this video I cover Tesla from the higher time frame and breakdown both a long term bullish scenario as well as a local bearish scenario .
Both of these scenarios present longs and short entries for day trade opportunities and swing positions .
Tools used Fibs , TR pocket , Volume profile , Pivots , and vwap .
Any questions ask in the comments
Safe trading and Good luck

US & Global Market Breakdown | Profits, Losses & Bearish TradesIn this video, I break down the current state of the US and global economy, and why I believe we’re heading into a bearish phase.
📉 Fundamentals:
I cover the key macroeconomic factors influencing the markets — including Trump’s proposed new tariffs, slowing GDP growth, and ongoing supply chain constraints. These all point toward increasing pressure on the global economy.
📊 Technical Analysis:
I go over the major indexes and highlight their recent behavior. We’ve seen reactions from resistance levels, contraction patterns forming, and a significant volume dry-up — followed by today’s spike in volume, which occurred right at resistance. These are potential signs that the market may be shifting toward a bearish trend.
That said, we could still just be witnessing a deeper pullback within a longer-term uptrend. Markets are unpredictable, and no one knows for sure — which is why it’s important to always do your due diligence.
💰 I also review the profits and losses I’ve taken on recent bullish trades, and why I’ve now positioned myself in select short opportunities based on what I’m seeing.
If I’m sharing this, it’s because I’m personally investing my capital based on my conviction — so always use your own judgment and risk management when making decisions.
If you found value in the breakdown, leave a like, comment, and subscribe for more timely updates.

A Nasdaq Black Hole - Unprecendented yes, Impossible no Before anyone says anything...yes Elliot Waves are completely subjective BUT IMHO i have drawn these correctly....
The NAS made a violent move from 22100 down 16300 in a very short space of time. So what? It will just make another ATH right?
Well, of course. It almost certainly will, the real question is when. If this pattern plays out, it won't be in 2025.
After every impulse on any timeframe, long or short, you'd naturally expect a pullback.
However, not all pullbacks are the same. Usually, the first significant pullback for a corrective wave is no more than 50%.
However, if you have a pullback that is 61.8% or more, it is usually considered an impulsive wave.
What the difference? Corrective waves have3 waves, ultimately trending in one direction, and impulsive waves have 5 waves trending in one direction.
If the Nasdaq falls beneath 20900, with increasing volume, this will signify confirmation to me at least, that we could be starting one of the most violent impulsive bearish waves in the history of financial markets.

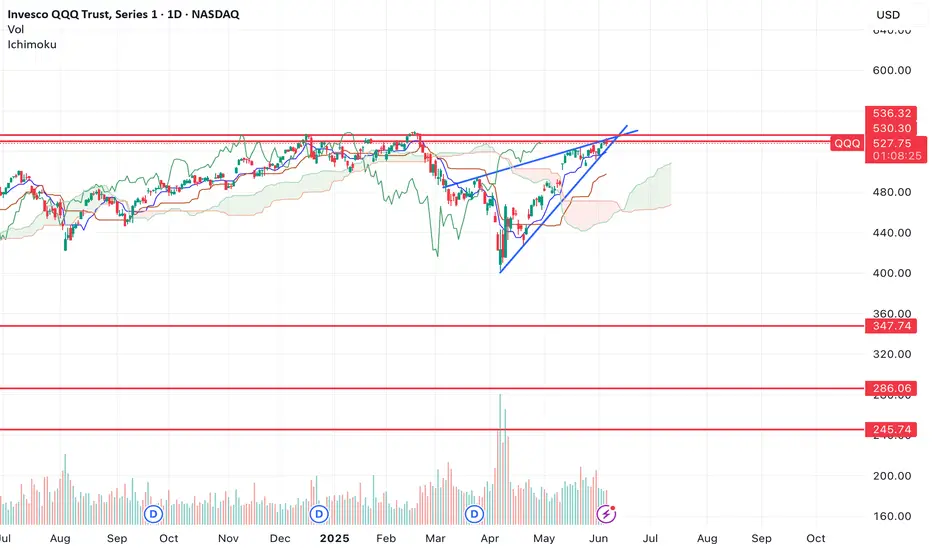
QQQ new lows incoming?QQQ has been consolidating in a massive rising wedge and looks set to break down from it.
Unless price can get back above previous highs, then new lows is the most likely outcome here.
I've marked off support levels on the downside that might be good opportunities to scale in on the long side.
Let's see how low we go.
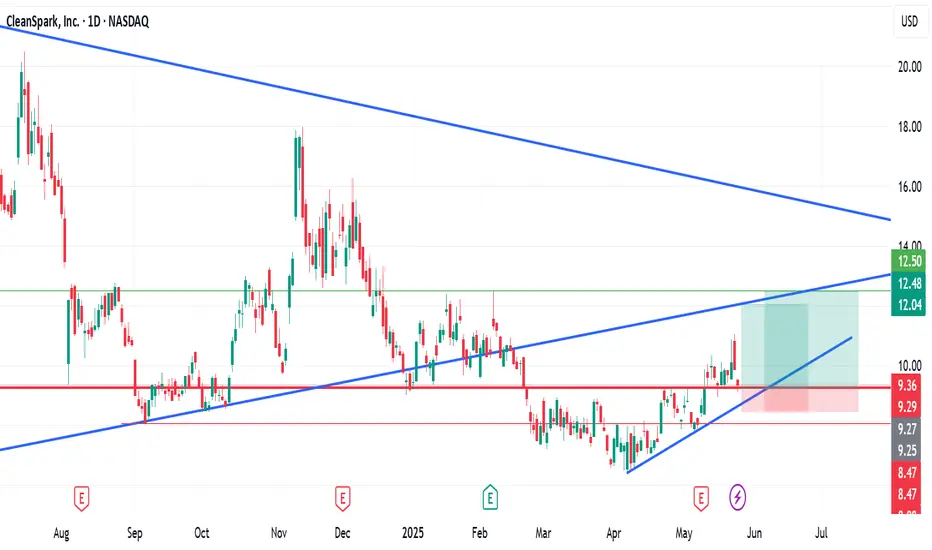
CleanSpark Inc. (NASDAQ: CLSK) Stock Analysis and ForecastCleanSpark Inc. (CLSK) recently experienced a pullback from the $11.09 level, closing at approximately $9.36 at the end of last week’s trading session. This movement may indicate the formation of another lower low, aligning with the current broader market sentiment.
Upon reviewing the technicals, particularly the ascending trendline, the following entry strategy is proposed for potential trading opportunities:
Entry: $9.36
Stop Loss: $8.47
Take Profit 1: $12.00
Take Profit 2: $12.50
As always, it’s crucial to approach trading decisions with caution and implement appropriate risk management strategies.
Reason: The analysis is based on recent price action and technical patterns, but market conditions and external factors can shift trends unexpectedly.
If you found this analysis helpful, please like, comment, and share.
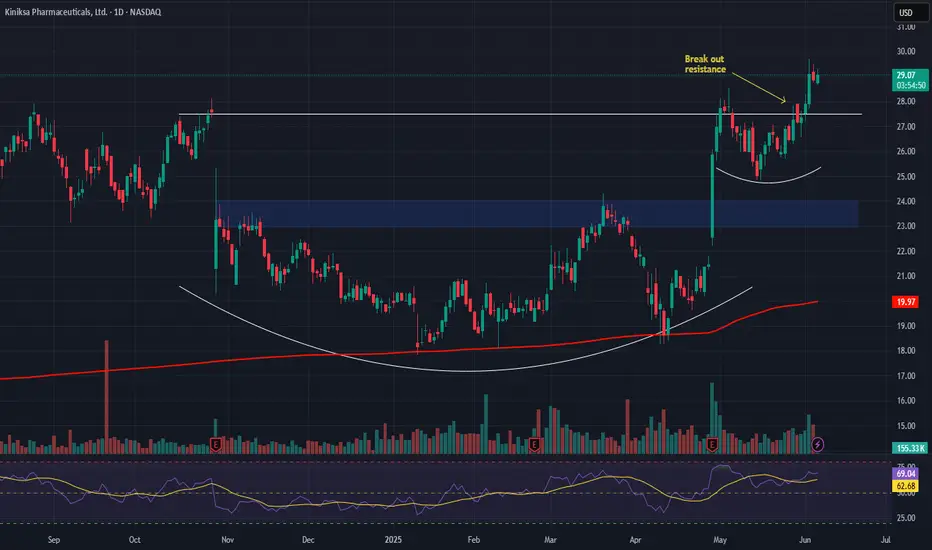
Kiniksa (KNSA) – Rare Disease Revenue & Pipeline Momentum Company Overview:
Kiniksa NASDAQ:KNSA is establishing itself as a high-growth biopharma player, with a sharp focus on autoimmune and inflammatory diseases. The company’s strategy is paying off through commercial execution and a robust, de-risked pipeline.
Key Catalysts:
🏆 Arcalyst Commercial Success
Core driver in recurrent pericarditis treatment
Delivering double-digit YoY revenue growth
Expanding potential in broader inflammatory indications
🧬 Deep Clinical Pipeline
KPL-404 (anti-CD40): Targets autoimmune diseases like lupus and rheumatoid arthritis
Mavrilimumab: Late-stage potential in rare inflammatory conditions
Orphan Drug & Breakthrough Therapy designations → accelerated approvals + exclusivity
📊 Strong Earnings Momentum
Recent beat on both revenue and EPS
Reinforces credibility in commercial & clinical execution
May attract institutional investors and technical breakout traders
Investment Outlook:
✅ Bullish Above: $23.00–$24.00
🎯 Target Price: $38.00–$40.00
📈 Thesis Drivers: Proven revenue engine (Arcalyst), high-potential pipeline, regulatory tailwinds, and institutional attention
🔬 Kiniksa is not just a clinical-stage story—it's a commercial growth engine with rare disease upside. #KNSA #BiotechStocks #RareDisease
Gold Hits All Targets with 500+ Pips – Eyes Now on $3420By examining the gold chart on the 4-hour timeframe, we can see that after our previous analysis, the price moved exactly as expected and successfully hit all four targets — $3367, $3380, $3391, and $3400 — reaching as high as $3403 and delivering over 500 pips of return.
After sweeping the liquidity above $3400, the price corrected back to around $3370. Currently, gold is trading around $3380. If the price can hold above the $3370 level, we can expect a continuation of the bullish move toward the $3420 area.
Please support me with your likes and comments to motivate me to share more analysis with you and share your opinion about the possible trend of this chart with me !
Best Regards , Arman Shaban
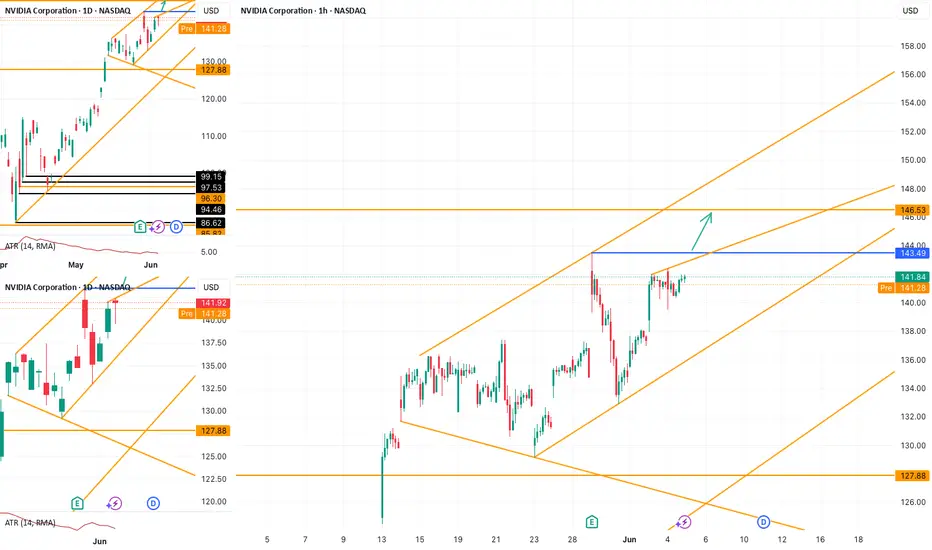
NVDA Setup: Clean Path to 146.53 If 143.49 Gives WayNASDAQ:NVDA continues to move within a rising channel. On the 1H chart, no major trendline currently limits further upside. If price breaks above the key swing high at 143.49 , the next potential target lies around 146.53 .
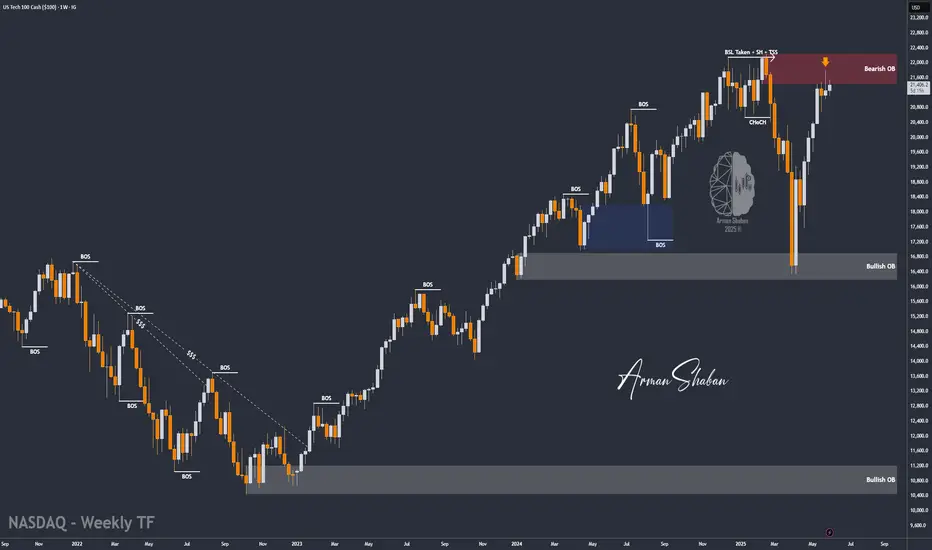
NASDAQ at Weekly Supply Zone – Bearish Breakdown Ahead? (READ)By examining the #Nasdaq chart on the weekly timeframe, we can see that the price is currently trading within the supply zone around 21,400. If it manages to close and stabilize below 21,100, we can expect further downside for this index. The potential bearish targets are 21,000, 20,700, 20,200, and 19,150. The key supply zone ranges from 21,400 to 22,200.
Please support me with your likes and comments to motivate me to share more analysis with you and share your opinion about the possible trend of this chart with me !
Best Regards , Arman Shaban
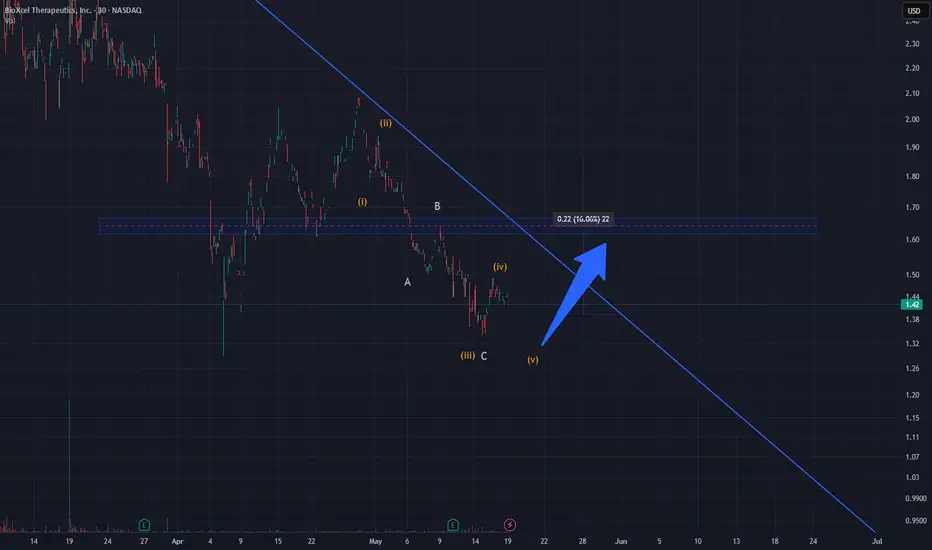
Ending Diagonal Complete? Bounce Toward 1.60 AheadBTAI has likely completed an impulsive 5-wave decline followed by an ABC corrective structure. The final leg (v) of the downtrend appears to have ended near $1.35, where price action shows a reversal signal.
Currently, price is attempting to recover and may retest the descending trendline and previous structure zone near $1.60 — a level that served as strong support previously and now acts as resistance.
If the price breaks this zone with volume confirmation, it could trigger a short-term bullish breakout. Until then, this is considered a corrective rally within the broader downtrend.
Key Levels:
Support: $1.35
Resistance: $1.60
Target: $1.60 (potential +16%)
Conclusion:
A short-term bounce is unfolding. Watch $1.60 for reaction — rejection or breakout will determine the next leg.
Nasdaq-100 H1 | Falling toward a pullback supportThe Nasdaq-100 (NAS100) is falling towards a pullback support and could potentially bounce off this level to climb higher.
Buy entry is at 21,516.72 which is a pullback support that aligns close to the 38.2% Fibonacci retracement.
Stop loss is at 21,340.00 which is a level that lies underneath an overlap support and the 50.0% Fibonacci retracement.
Take profit is at 21,803.01 which is a swing-high resistance.
High Risk Investment Warning
Trading Forex/CFDs on margin carries a high level of risk and may not be suitable for all investors. Leverage can work against you.
Stratos Markets Limited (tradu.com ):
CFDs are complex instruments and come with a high risk of losing money rapidly due to leverage. 63% of retail investor accounts lose money when trading CFDs with this provider. You should consider whether you understand how CFDs work and whether you can afford to take the high risk of losing your money.
Stratos Europe Ltd (tradu.com ):
CFDs are complex instruments and come with a high risk of losing money rapidly due to leverage. 63% of retail investor accounts lose money when trading CFDs with this provider. You should consider whether you understand how CFDs work and whether you can afford to take the high risk of losing your money.
Stratos Global LLC (tradu.com ):
Losses can exceed deposits.
Please be advised that the information presented on TradingView is provided to Tradu (‘Company’, ‘we’) by a third-party provider (‘TFA Global Pte Ltd’). Please be reminded that you are solely responsible for the trading decisions on your account. There is a very high degree of risk involved in trading. Any information and/or content is intended entirely for research, educational and informational purposes only and does not constitute investment or consultation advice or investment strategy. The information is not tailored to the investment needs of any specific person and therefore does not involve a consideration of any of the investment objectives, financial situation or needs of any viewer that may receive it. Kindly also note that past performance is not a reliable indicator of future results. Actual results may differ materially from those anticipated in forward-looking or past performance statements. We assume no liability as to the accuracy or completeness of any of the information and/or content provided herein and the Company cannot be held responsible for any omission, mistake nor for any loss or damage including without limitation to any loss of profit which may arise from reliance on any information supplied by TFA Global Pte Ltd.
The speaker(s) is neither an employee, agent nor representative of Tradu and is therefore acting independently. The opinions given are their own, constitute general market commentary, and do not constitute the opinion or advice of Tradu or any form of personal or investment advice. Tradu neither endorses nor guarantees offerings of third-party speakers, nor is Tradu responsible for the content, veracity or opinions of third-party speakers, presenters or participants.

Nasdaq - The final bullrun breakout!Nasdaq - TVC:NDQ - might break above all structure:
(click chart above to see the in depth analysis👆🏻)
It is quite incredible how volatile stocks have been lately, especially considering that fact that the Nasdaq is about to create new all time highs again. Consequently, we are about to witness a significant structure breakout, which would ultimately lead to another rally of about +30%.
Levels to watch: $21.000
Keep your long term vision!
Philip (BasicTrading)

NASDAQ INDEX (US100): More Growth Ahead
For some unknown reason, I was asked by a dozen
of my subscribers to provide the update for US100.
Since early May, the index successfully updates the highs on a daily.
Such a tendency will remain at least till a test of a current ATH.
I think that the market is going to grow and reach at least 22100 level soon.
❤️Please, support my work with like, thank you!❤️
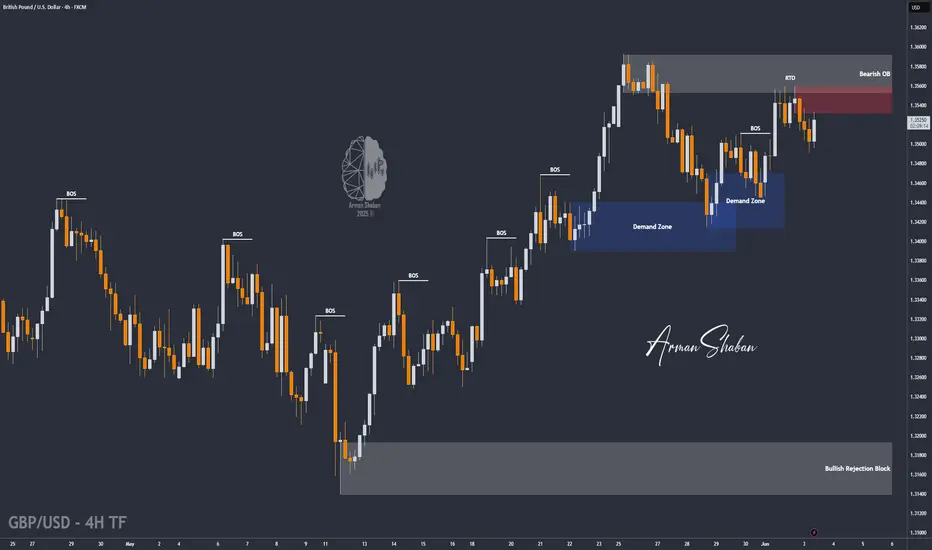
GBP/USD : Ready for Fall (READ THE CAPTION)By examining the GBP/USD chart on the 4-hour timeframe, we can see that the price is currently trading within the 1.35 supply zone. If a strong rejection occurs from this level, we can expect further downside movement. The potential bearish targets are 1.34915 and 1.34500. Other key supply zones are located at 1.35520, 1.35730, and 1.35930.
Please support me with your likes and comments to motivate me to share more analysis with you and share your opinion about the possible trend of this chart with me !
Best Regards , Arman Shaban
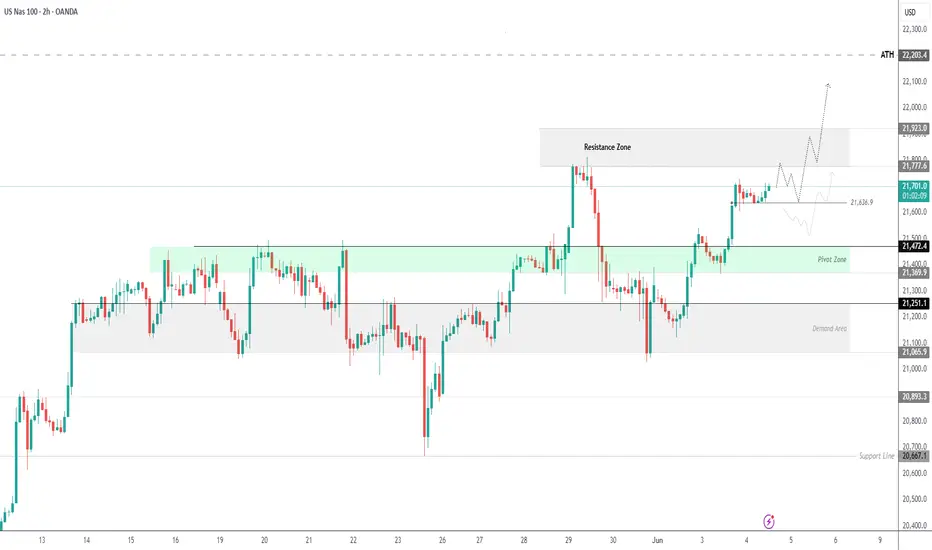
USNAS100 – Bullish Scenario Valid Above 21640, Targeting 21920USNAS100 | Technical Analysis
The price initiated a bullish trend after breaking above 21470, as previously mentioned. It is now continuing toward the target at 21770.
Currently, price is approaching the resistance at 21775.
If it fails to break above and stabilizes below 21775, we may see a consolidation within the range of 21775–21640.
🔺 A 1H close above 21775 may trigger a continued bullish move toward 21920 and 22100.
🔻 A 1H close below 21640 could lead to a correction down to 21475.
Resistance: 21775, 21920, 22100
Support: 21640, 21510, 21370
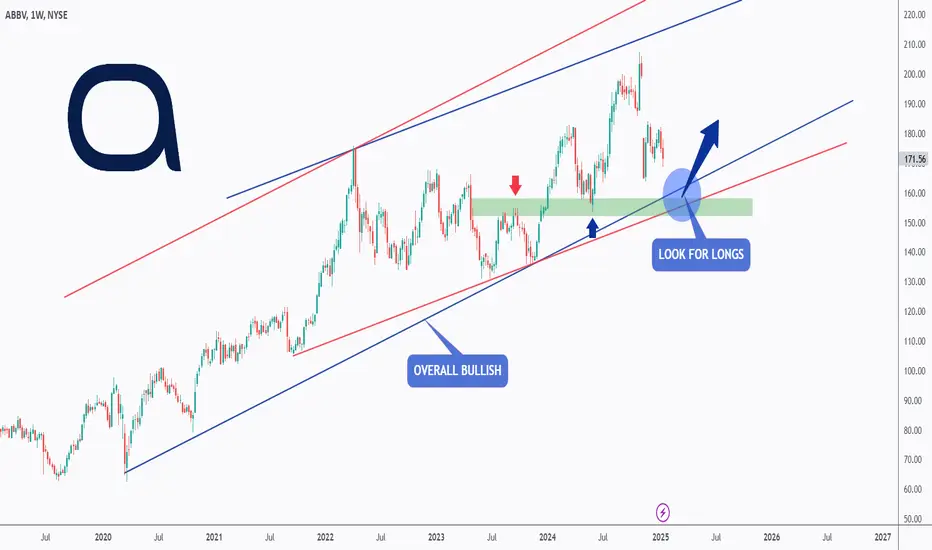
ABBV - Are you Ready?Hello TradingView Family / Fellow Traders. This is Richard, also known as theSignalyst.
📈ABBV has been in a correction phase and it is currently approaching the lower bound of the red and blue channels.
Moreover, the green zone is a strong round number $150 and structure!
🏹 Thus, the highlighted blue circle is a strong area to look for buy setups as it is the intersection of structure and lower trendlines acting as non-horizontal support.
📚 As per my trading style:
As #ABBV approaches the blue circle, I will be looking for bullish reversal setups (like a double bottom pattern, trendline break , and so on...)
📚 Always follow your trading plan regarding entry, risk management, and trade management.
Good luck!
All Strategies Are Good; If Managed Properly!
~Rich
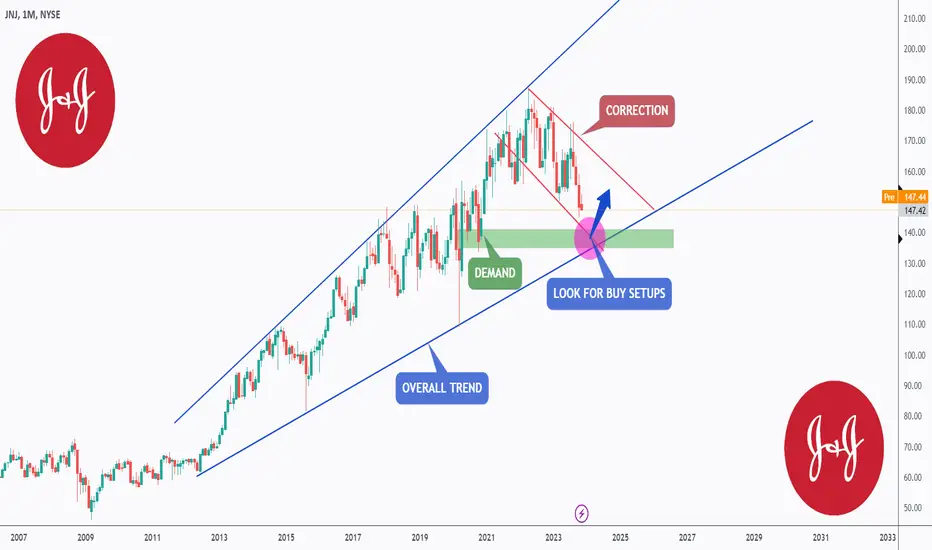
JNJ - Macro View 🌐Hello TradingView Family / Fellow Traders. This is Richard, also known as theSignalyst.
📈 JNJ has exhibited an overall bullish trend, trading within the ascending wedge pattern outlined in blue. It is presently nearing the lower boundary/blue trendline.
At present, JNJ is undergoing a correction phase and is trading within the descending red channel. It is currently approaching the lower limit and a highlighted demand zone in green.
🏹 Thus, the highlighted purple circle is a strong area to look for buy setups as it is the intersection of the green demand and lower blue and red trendlines acting as a non-horizontal support.
📚 As per my trading style:
As JNJ approaches the lower purple circle zone, I will be looking for bullish reversal setups (like a double bottom pattern, trendline break , and so on...)
📚 Always follow your trading plan regarding entry, risk management, and trade management.
Good luck!
All Strategies Are Good; If Managed Properly!
~Rich
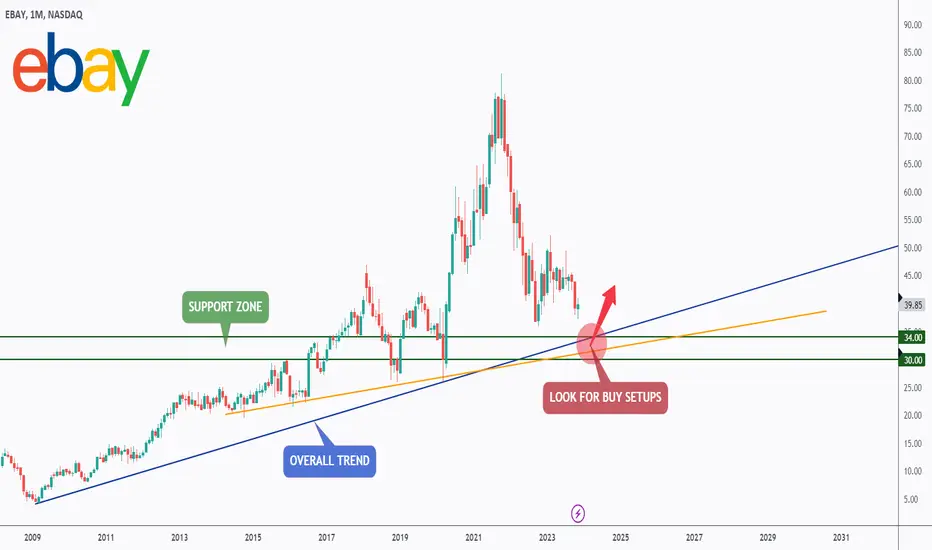
ebay is on sale 🛒Hello TradingView Family / Fellow Traders. This is Richard, also known as theSignalyst.
📈 EBAY has exhibited an overall bullish trend , trading above the orange and blue trendlines.
At present, EBAY is undergoing a correction phase and it is currently approaching a strong support zone 30 - 34
🏹 Thus, the highlighted red circle is a strong area to look for buy setups as it is the intersection of the green support and lower blue and orange trendlines acting as a non-horizontal support.
📚 As per my trading style:
As #EBAY approaches the lower red circle zone, I will be looking for bullish reversal setups (like a double bottom pattern, trendline break , and so on...)
📚 Always follow your trading plan regarding entry, risk management, and trade management.
Good luck!
All Strategies Are Good; If Managed Properly!
~Rich
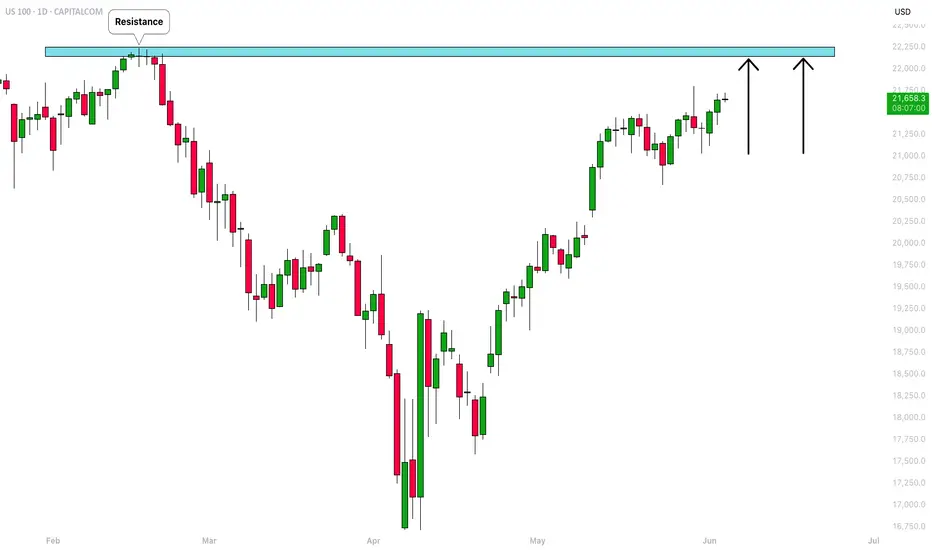
Can Tech Strength Still Drive Markets Amid Trade Tensions?Macro approach:
The Nasdaq 100 (USTEC) began Jun with strong momentum after its best monthly performance since 2023, fueled by robust tech earnings and a brief lull in tariff concerns.
- However, renewed US-China trade tensions resurfaced early in the week, briefly weighing on sentiment before a market rebound restored cautious optimism.
- Nvidia (NVDA) surged due to the continued demand for AI chips. At the same time, Tesla (TSLA) drew investor focus ahead of its 12 Jun robotaxi launch, helping maintain positive momentum in the face of geopolitical uncertainty.
Technical approach:
- USTEC is now testing the previous swing high near 218000, staying above both EMAs, a sign of ongoing bullish strength.
- A clear break above 21800 would likely open the path toward the record-high zone near 22200.
- Failure to do so may trigger a pullback toward the nearest support of around 20700.
Analysis by: Dat Tong, Senior Financial Markets Strategist at Exness
