MSTR - The Saylor in the Storm!Hello TradingView Family / Fellow Traders. This is Richard, also known as theSignalyst.
📈MSTR has been overall bullish trading within the rising channel marked in blue. (log chart)
Currently, it is in a correction phase within the falling red channel.
Moreover, the red zone is a strong demand.
🏹 Thus, the highlighted blue circle is a strong area to look for buy setups as it is the intersection of demand and lower trendlines acting as non-horizontal support.
📚 As per my trading style:
As #MSTR approaches the blue circle, I will be looking for bullish reversal setups (like a double bottom pattern, trendline break , and so on...)
📚 Always follow your trading plan regarding entry, risk management, and trade management.
Good luck!
All Strategies Are Good; If Managed Properly!
~Rich
Nasdaq

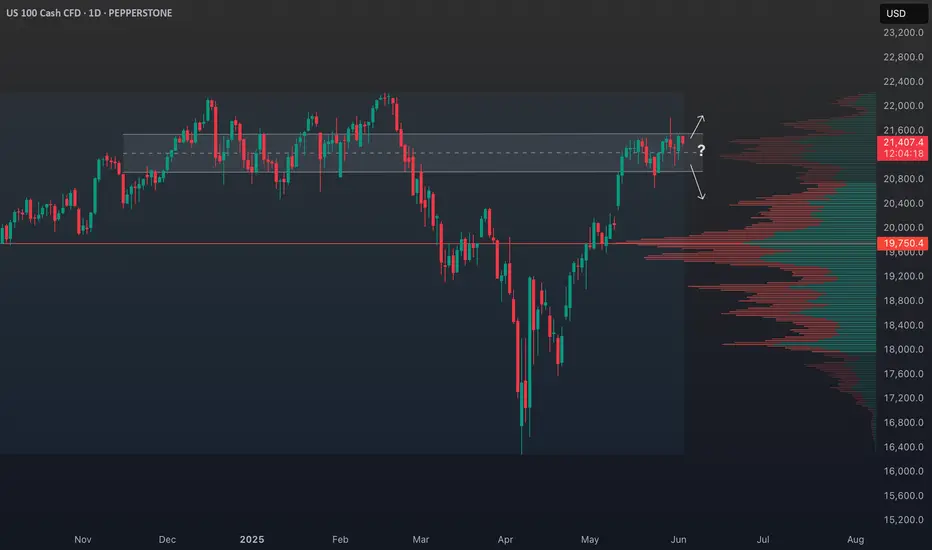
NASDAQ Outlook: Waiting for a Catalyst in a Range-Bound Market!The NASDAQ NAS100 has shown impressive gains recently 📈, but overall sentiment remains cautious 😐 as the market consolidates and trades sideways in the short term 🔄. Investors seem to be waiting for a new catalyst—such as major economic data or policy announcements 📰—before committing to a clear direction.
Ongoing political and economic uncertainties, including trade negotiations 🤝, interest rate outlooks 💸, and valuation concerns 💰, are keeping market participants on edge. Given these factors, the near-term environment is likely to remain choppy and range-bound 🌊. As traders, it’s important to approach the markets with caution ⚠️, especially as equities approach key resistance areas 🚧. This uncertainty may also impact currency and other financial markets 💱. While tech stocks could eventually break out of the current range 💻, the direction is still unclear. Prioritize risk management and protect your capital during this period of heightened uncertainty 🛡️.
Political and economic uncertainties—like ongoing trade negotiations, interest rate expectations, and concerns about valuations—are keeping investors on edge.
The near-term outlook for the US100 is for choppy, range-bound trading as the market works through these uncertainties.
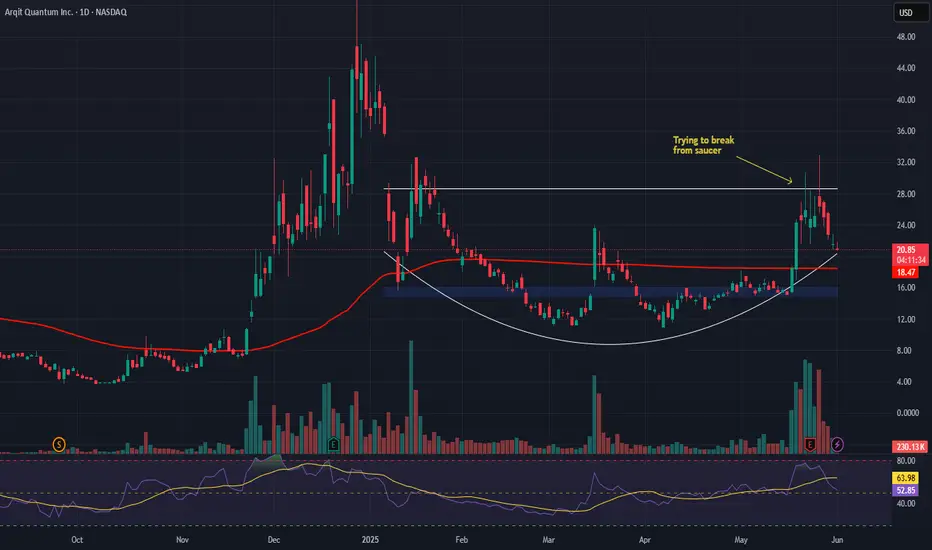
Arqit Quantum Inc. (ARQQ) – Securing the Future of DataCompany Overview:
Arqit NASDAQ:ARQQ is redefining cybersecurity by offering quantum-resilient encryption solutions—future-proofing critical communications infrastructure for governments, enterprises, and hyperscale cloud networks.
Key Catalysts:
Strategic Acquisition of Ampliphae 📡
Adds a powerful risk management suite + experienced innovation team
Expands Arqit’s capability to serve end-to-end encryption needs across cloud, edge, and IoT systems
Government Validation & Traction 🏛️
Multi-year license deal with a government client in EMEA
Signals institutional confidence, even with deferred revenue accounting
Quantum Threat = Rising Demand 📈
As quantum computing advances, the need for quantum-safe encryption becomes urgent
Arqit’s cloud-based QKD platform is uniquely suited to meet these demands at scale
Enterprise-Grade Solutions 🌐
Positioned to become a go-to cybersecurity partner for mission-critical infrastructure in a post-quantum world
Targeting global clients across finance, defense, telecom, and more
Investment Outlook:
✅ Bullish Above: $15.00–$16.00
🚀 Upside Target: $43.00–$44.00
🔒 Key Drivers: Strategic M&A, government adoption, quantum-resilient tech, first-mover advantage
Arqit isn’t just building encryption—it’s building the cybersecurity foundation for the quantum era. #ARQQ #QuantumSecurity #FutureProof
Nasdaq Bullish Speed is expected.Nasdaq (and indexes) are expected to rally with speed after FED release and perform towards the target 22,250.00.
We're going to allow for potential wicks lower on FED release though.

NQ's next targetCME_MINI:NQ1! looks to be in a 50/50 probability...maybe
I am only expecting price to reach $21557
This is the clearest target so far. This is subject to Sundays open also.
But looking for price to reach this level and then we will get a better understanding on the next draw.

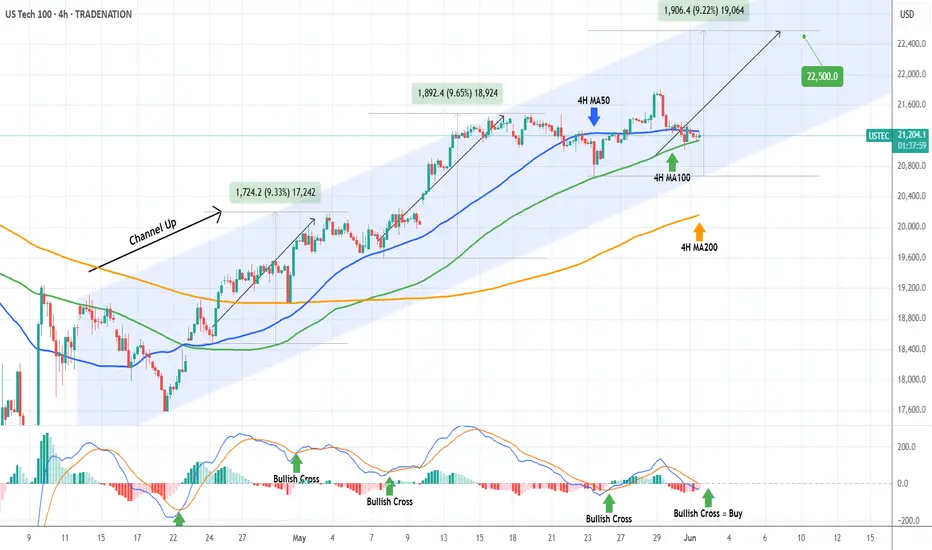
NASDAQ Will the 4H MA100 come to the rescue?Nasdaq (NDX) is trading within a 3-week Channel Up, which is currently supported by the 4H MA100 (green trend-line). In fact, the price is being squeezed in the last three 4H candles within the 4H MA100 and the 4H MA50 (blue trend-line).
This tight compression technically tends to cause violent break-outs either way. As long as the Channel Up holds, we expect that to be upwards and it should be confirmed by the formation of a 4H MACD Bullish Cross.
With the last two major rallies being around +9.50%, we expect to see 22500 on the next Leg Up.
-------------------------------------------------------------------------------
** Please LIKE 👍, FOLLOW ✅, SHARE 🙌 and COMMENT ✍ if you enjoy this idea! Also share your ideas and charts in the comments section below! This is best way to keep it relevant, support us, keep the content here free and allow the idea to reach as many people as possible. **
-------------------------------------------------------------------------------
Disclosure: I am part of Trade Nation's Influencer program and receive a monthly fee for using their TradingView charts in my analysis.
💸💸💸💸💸💸
👇 👇 👇 👇 👇 👇
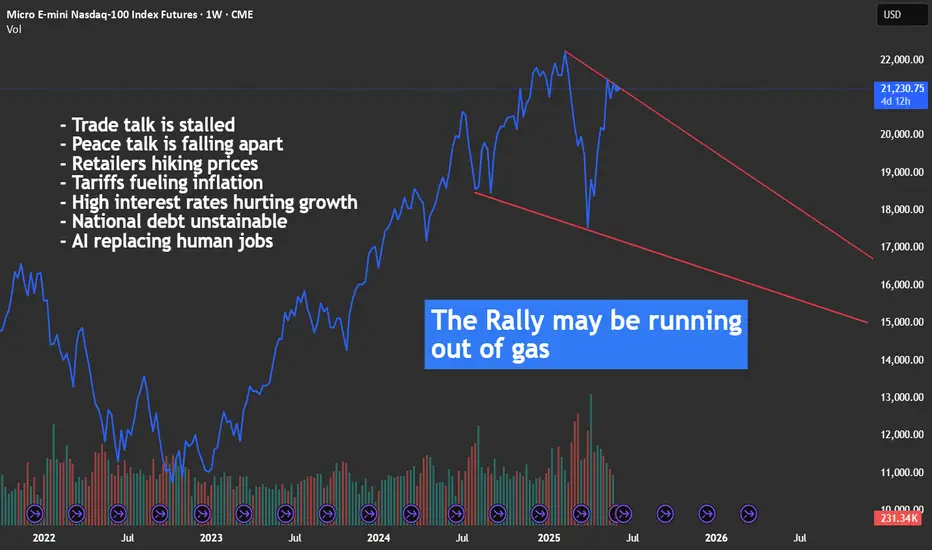
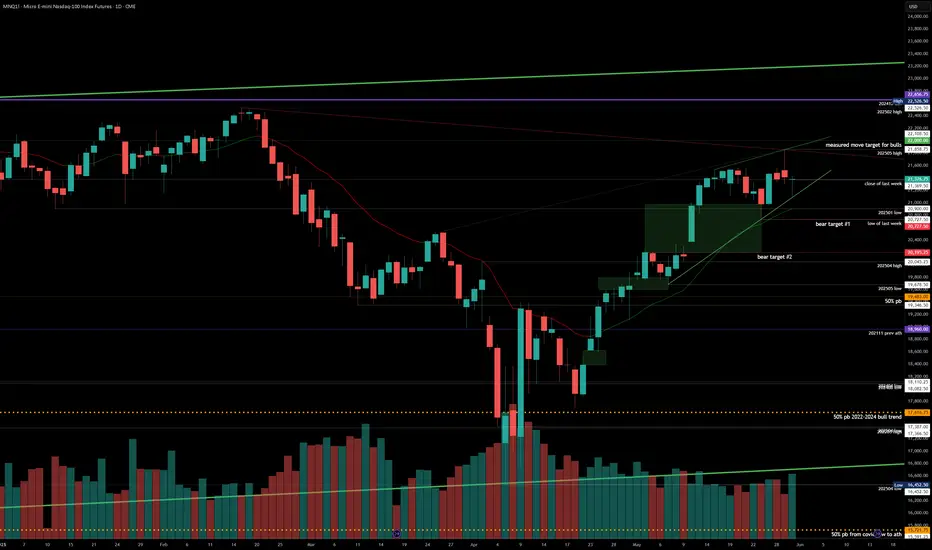
The Last Batch of Good DataCME: Micro E-Mini Nasdaq 100 Index Futures ($MNQ) #TheFuturesLeap #Microfutures
Investors have defied the Wall Street adage of “Sell in May and Go Away”.
The S&P 500 rose by 6.2% in May while the Nasdaq climbed 9.6%. Both indices notched their best monthly results since 2023. The Dow Jones gained 3.9% for the month. The S&P stood out as it recorded its best performance for the month of May since 1990.
Several favorable factors propelled May’s impressive stock index gains:
• Early-May employment data pointed to continued strength, raising risk appetite.
• A temporary U.S.-China tariff reduction for 90 days helped calm trade tensions.
• Robust earnings from Nvidia and Super Micro Computer fueled rally momentum.
Meanwhile, these unfavorable events also occurred in May:
• Moody’s downgraded the US sovereignty rating. By now, the US has lost its AAA ratings from all three major credit agencies.
• The 20-year Treasury bond auction received a cold shoulder in the bond market.
• The trade talk between U.S. and China has been stalled apparently.
In any other time, bad news of such significance would send the stock market into a free fall. But investors turned a blind eye to them. This highlighted a bullish market sentiment, a prevailing appetite for risky assets amid uncertainty in geopolitical and trade tensions.
Underpinning the rising stock prices are solid macroeconomic data for the month of April and strong Q1 earnings from major US corporations. Given that stock prices reflect expected future earnings, it is fair to ask: Will the data stay good?
Import dependency is unlikely to change any time soon
On May 30th, US Census Bureau reported that the U.S. trade deficit in goods narrowed sharply in April, with the gap contracted 46.0% to $87.6 billion. Goods imports decreased by $68.4 billion to $276.1 billion. Exports of goods increased by $6.3 billion to $188.5 billion.
What really happened is that there was a boost in imports in Q1 due to the front-running ahead of tariffs. This ended in April as the higher rates kicked in. If we take March out as an outliner, we will find that the April data is 9.7% higher than February. As a matter of fact, U.S. trade deficits in 2025 rose sharply comparing to 2023 and 2024 levels.
With the US-China interim trade deal in effect from May 14th, we could expect large waves of imports to resume from now through August, pushing trade deficits even higher.
The global supply chain is decades in the making. Its undoing will take years. Meanwhile, imports will pour in, only at higher costs due to the new tariffs and higher freight costs.
My conclusion: U.S. trade deficit will grow bigger, at least for the remainder of 2025.
Retail price hikes could cause inflation to rebound
US retailers largely source their products overseas. Could they just “eat the tariffs?”
• Walmart: FY2024 revenues $681 billion (+5.1% YoY). Net income jumped 25.3% to $19.4 billion, lifting its net profit margin to 2.9%.
• Target: Revenue $107.4b (-1.6%). Net income $4.14b (+49%). Profit margin 3.9%.
• Costco: Revenue $254.5b (+5.0%). Net income $7.37b (+17%). Profit margin 2.9%.
• Walgreens: Revenue $147.66 billion (+6.17%). Net Income -$8.64 billion (-5.9%)
• Amazon: Revenue $638.0b (+11%). Net income $59.2b (+95%). Profit margin 9.3%.
Apparently, even the largest and the most efficiently run retail giants are operating with a razor-thin margin. Retailers really have no choice but to pass on the tariffs to consumers, in the form of higher prices.
On May 15th, Walmart announced to raise prices starting in late April. The price hikes would accelerate in May, and a larger sting will start to be felt in June and July when the back-to-school shopping season goes into high gear.
Other retailers are expected to follow suit. Walmart’s action provides air cover for the tens of thousands of retailers to raise their prices freely.
My conclusion: Inflation will go up from May through the holiday season in December.
Higher interest cost will eat into the bottom line
While stock investors brushed off the Moody’s downgrade, the bond market has been in real trouble. As the US treasury bonds lost their “risk-free” status, debts of all kinds and all durations see a big spike in yield. Bond investors are undergoing a complete makeover of repricing bonds and reassigning a new “risk premium”.
On May 21st, the U.S. Treasury held an auction for 20-year bonds that fell significantly short of expectations. The lack of bidders—an alarming indicator of waning confidence in the U.S. economy—resulted in the yield on these bonds skyrocketing to 5.1%.
The bond yields go up even though the Fed holds rates steady. This indicates that central bank monetary policies are not very effective in shaping the long end of the bond market. Even if the Fed lowers the overnight Fed Funds rates, bond investors would still demand higher yield to compensate for the perceived risk increases for the once “risk-free” instruments. Commercial banks could keep interest rates high for mortgages, corporate bonds, auto loans and credit cards.
As of June 2nd, the futures market puts the odds of the Fed holding rates unchanged at 95.4% for its June 18th FOMC meeting, according to CME Group FedWatch tool.
www.cmegroup.com
My conclusion: The Fed may have little appetite for cutting rates if inflation goes up. When they cut the overnight rates, businesses and households may not get any relief from high interest expenses.
Trade tensions and geopolitical risks may stay elevated
Before the ink dries on a temporary agreement, the trade talk between U.S. and China has been stalled. The minister-level negotiation has gone nowhere, and it may take presidential talk to salvage the agreement. At this point, we could not make any assumption about any trade agreement. Its shape and form and timing are uncertain. If the trade talk breaks down, we will see a new round of tariff reescalation and retaliation.
On June 2nd, breaking news report that Ukraine carried out a large drone attack deep into the Russian territory. Russian retaliation is expected. After months of effort, potential ceasefire and peace negotiation could fall apart.
My conclusion: Trade and geopolitical tensions are both escalating, after early signs of calming down. These would hurt economic growth and dent investor appetite for risk.
Trading with Micro E-Mini Nasdaq 100 Index Futures
Based on my analysis above, I hold the opinion that good data may quickly turn bad in the coming weeks, and correction in the US stock market is imminent. Valuation at the current lofty level completely ignores the risk escalation closer on to us. Anyone sharing this view could express it by shorting the CME Micro E-Mini Nasdaq 100 Index Futures.
The Micro Nasdaq contract has a notional value of $2 times the index. At the Friday closing price of 21,578, each September contract is worth $43,156. The minimum margin for shorting one contract is $3,036 at the time of this writing.
The latest CFTC Commitments of Traders report shows that, as of May 27th, the total open interest for Emini Nasdaq and Micro Nasdaq futures are 275,143 and 204,499 contracts, respectively.
• Leverage Fund has 77,467 in long, 251,452 in short, and 10,472 in spreading
• The long-short ratio of 1-to-3.2 (= 77467/251452) show that the “Smart Money” is very bearish on the Nasdaq while the index gained nearly 10% in May
Hypothetically, if Nasdaq 100 were to pull back 5% before September, a short futures position will gain $2,157.8 (= 21578 * 0.05 * 2).
The risk of shorting the Nasdaq is that the stock index continues to rally. To hedge the downside risk, the trader could set a stop-loss at his order. For example, a stop loss at 23,000 for a short order would set the maximum loss to $2,844 (= (23000-21578) x 2).
Happy Trading.
Disclaimers
*Trade ideas cited above are for illustration only, as an integral part of a case study to demonstrate the fundamental concepts in risk management under the market scenarios being discussed. They shall not be construed as investment recommendations or advice. Nor are they used to promote any specific products, or services.
CME Real-time Market Data help identify trading set-ups and express my market views. If you have futures in your trading portfolio, you can check out on CME Group data plans available that suit your trading needs tradingview.sweetlogin.com
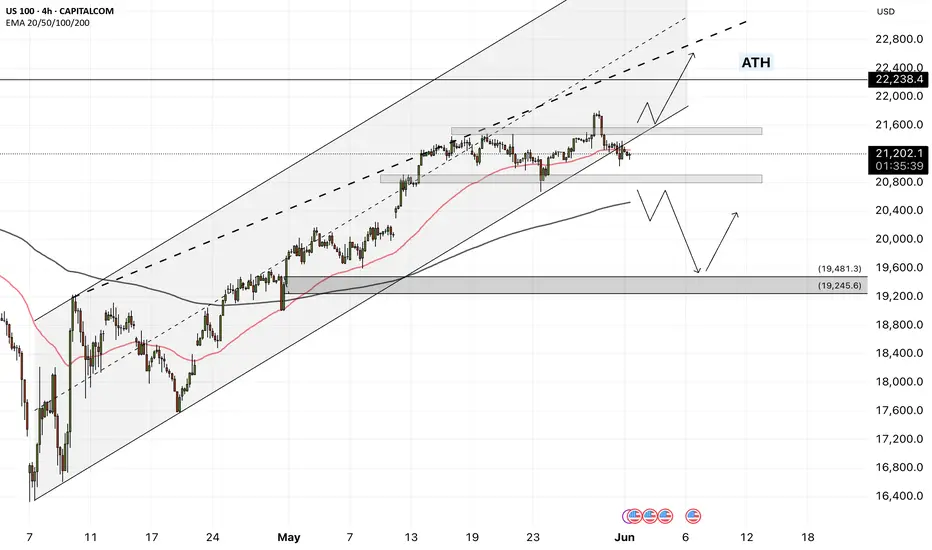
NAS100 - Will the stock market continue to rise!?The index is above the EMA200 and EMA50 on the four-hour timeframe and is trading within the specified range. In case of a valid break of this range, I expect a new trend to form. In case of corrective movements towards the demand zone, we can buy Nasdaq in that range with an appropriate reward for the risk.
A recent report from Bank of America reveals that investors are actively repositioning in global markets. For the second consecutive week, U.S.equities experienced capital outflows, while European stocks saw inflows for the seventh straight week.
Digital assets attracted $2.6 billion in inflows—the largest amount since January. In contrast, Japanese equities recorded the largest weekly outflow in history, while emerging markets equities attracted their highest inflows of 2025. Meanwhile, emerging markets debt also posted its strongest inflows since January 2023.
Jamie Dimon, CEO of JPMorgan, speaking at the 2025 Reagan National Economic Forum, warned that China will not yield to U.S. trade pressure. He urged that the U.S. must first address its internal challenges, including reforming laws, taxes, immigration, education, and healthcare systems. Dimon also underscored the importance of preserving military alliances.
He noted that China is a serious and potential rival, and if the United States fails to maintain its position as the world’s dominant economic and military power over the next 40 years, the dollar will no longer serve as the global reserve currency. Having just returned from China, Dimon added, “The Chinese are not afraid; don’t expect them to bow to America.”
Currently, markets are pricing in two interest rate cuts totaling 50 basis points by the end of 2025—a forecast aligned with the Federal Reserve’s official dot plot projections. Additionally, the latest FOMC minutes, which revealed policymakers’ concerns over persistent inflationary pressures, played a significant role in shaping these expectations.
Federal Reserve Governor Christopher Waller stated that he would support rate cuts later this year if tariffs remain around an average of 10%. However, his support hinges on inflation moving toward the Fed’s 2% target and the labor market maintaining its current strength.
Meanwhile, Morgan Stanley projects that the U.S. dollar could weaken by approximately 9% by mid-2026, citing a slowdown in U.S. economic growth and an anticipated 175 basis point reduction in the Fed’s interest rates. The bank also forecasts that 10-year Treasury yields will reach 4% by the end of 2025 but fall sharply in 2026 as rates decline further. Both Morgan Stanley and JPMorgan hold a bearish outlook on the dollar, expecting safe-haven currencies such as the euro, yen, and Swiss franc to benefit the most from its weakness.
In this context, market participants are closely watching key economic data in the week ahead. The ISM Manufacturing PMI is scheduled for release on Monday, followed by the Non-Manufacturing PMI on Wednesday. However, the main highlight will be Friday’s May Non-Farm Payrolls (NFP) report, which has exceeded expectations over the past two months. A similar result this time would signal continued strength in the labor market.
Given the Fed’s focus on inflation risks, special attention will likely be paid to the average hourly earnings growth. If wage growth remains above 3%, the market may begin to reprice some of its expectations for rate cuts—especially if the ISM reports also indicate improved economic activity in line with strong S&P Global readings. Such a scenario could pave the way for a renewed strengthening of the U.S. dollar.
Alongside the data releases, a series of speeches from key Federal Reserve officials—including Goolsbee (Chicago), Bostic (Atlanta), Logan (Dallas), and Harker (Philadelphia)—are expected. These remarks could further shape market expectations regarding the future path of monetary policy.
25.06.02 nasdaq analysis📊
📌 Friday Price Action Summary
Failed to break above the black resistance box
Repeated rejection at the zone strengthened downward pressure
As long as this zone remains unbroken, bearish bias remains
📉
Price has entered the bullish candle from May 27
If that candle breaks to the downside, a drop toward the 20EMA on the daily chart (20,930p) is likely
Currently seeing low volume and range-bound movement, so trend direction needs confirmation
🔍
If the European session fails to sustain the rebound, it will likely be a temporary move
A break below 21,218p + trendline break would confirm a short setup
🎯 Targets (TP):
TP1: 21,071p (Friday’s low)
TP2: 20,930p (Daily 20EMA)
📌 Strategic Conclusion
Bias: Bearish
However, due to declining volume and range-bound action,
→ It’s better to wait for confirmation before entering
If bearish entry conditions are met, execute with confidence

Nasdaq-100 H4 | Approaching an overlap supportThe Nasdaq-100 (NAS100) is falling towards an overlap support and could potentially bounce off this level to climb higher.
Buy entry is at 20,833.76 which is an overlap support that aligns with the 23.6% Fibonacci retracement.
Stop loss is at 20,100.00 which is a level that lies underneath a pullback support and the 38.2% Fibonacci retracement.
Take profit is at 21,763.98 which is a swing-high resistance.
High Risk Investment Warning
Trading Forex/CFDs on margin carries a high level of risk and may not be suitable for all investors. Leverage can work against you.
Stratos Markets Limited (tradu.com ):
CFDs are complex instruments and come with a high risk of losing money rapidly due to leverage. 63% of retail investor accounts lose money when trading CFDs with this provider. You should consider whether you understand how CFDs work and whether you can afford to take the high risk of losing your money.
Stratos Europe Ltd (tradu.com ):
CFDs are complex instruments and come with a high risk of losing money rapidly due to leverage. 63% of retail investor accounts lose money when trading CFDs with this provider. You should consider whether you understand how CFDs work and whether you can afford to take the high risk of losing your money.
Stratos Global LLC (tradu.com ):
Losses can exceed deposits.
Please be advised that the information presented on TradingView is provided to Tradu (‘Company’, ‘we’) by a third-party provider (‘TFA Global Pte Ltd’). Please be reminded that you are solely responsible for the trading decisions on your account. There is a very high degree of risk involved in trading. Any information and/or content is intended entirely for research, educational and informational purposes only and does not constitute investment or consultation advice or investment strategy. The information is not tailored to the investment needs of any specific person and therefore does not involve a consideration of any of the investment objectives, financial situation or needs of any viewer that may receive it. Kindly also note that past performance is not a reliable indicator of future results. Actual results may differ materially from those anticipated in forward-looking or past performance statements. We assume no liability as to the accuracy or completeness of any of the information and/or content provided herein and the Company cannot be held responsible for any omission, mistake nor for any loss or damage including without limitation to any loss of profit which may arise from reliance on any information supplied by TFA Global Pte Ltd.
The speaker(s) is neither an employee, agent nor representative of Tradu and is therefore acting independently. The opinions given are their own, constitute general market commentary, and do not constitute the opinion or advice of Tradu or any form of personal or investment advice. Tradu neither endorses nor guarantees offerings of third-party speakers, nor is Tradu responsible for the content, veracity or opinions of third-party speakers, presenters or participants.

Nasdaq Signals Economic Instability – Are You Watching CloselyDear traders,
You may be witnessing a “first” — a pivotal moment right before things begin to spiral.
We’re not fortune tellers. We don’t claim to predict the future.
But what you’re about to read is based entirely on publicly available data, interpreted not through speculation, but through a deep, rational analysis of interconnected facts — the kind of connections that most overlook, and few dare to question.
We may not know how the future is being orchestrated behind the scenes...
But one thing seems certain: crisis always comes first... and then we are given a narrative to justify it — be it war, a pandemic, or a "global emergency."
This is the correct sequence... and it’s the one they never teach you.
Yet for those of us who navigate the financial markets, one question matters more than all others:
How do we profit from this?
We recently shared an important setup on the Nasdaq index, the benchmark that reflects — to a large extent — the true state of the U.S. economy.
As a proxy for the 100 largest American corporations, the Nasdaq plays a critical role in signaling macro trends.
And while some are just now waking up to the storm ahead, our outlook has been clear since October 2022:
A major economic crisis was not only probable… it was inevitable.
Some analysts chalk this up to uncontrolled money printing post-2019 as governments tried to patch the damage from the COVID-19 crisis. That’s one explanation.
But at Glich, our vision is different.
More complex.
And for now… not something we can fully release.
For years, strong correlations between risk markets — especially U.S. equities and crypto — held firmly in place.
But something changed on May 30th, 2025. Completely and unmistakably.
The link was severed.
Now ask yourself:
Why was Bitcoin created in the first place?
It wasn’t just digital money.
It was a bold, revolutionary idea. A system designed for a future economy no longer shackled by inflation, central banking failures, or hidden agendas.
A fluid, transparent, and secure network for a world in desperate need of change.
The current financial model is obsolete. It’s no longer evolving — just surviving.
And it can no longer answer the challenges of what's to come.
2008 was not the collapse; it was the setup. A convenient pretext to slowly roll out something new.
And "Satoshi Nakamoto"? Well, let’s just say...
That name means more than you think.
"HIDDEN INFORMATION" 👁️
What does NEO mean when he says:
"This has all happened before… yet it’s happening for the first time"?
And what does that have to do with us?
This analysis is not just about charts or setups.
It’s a hidden message — a spotlight on a once-in-a-generation opportunity lying in plain sight.
But not everyone is trained to read between the lines.
Let us ask:
Why was Donald Trump specifically pushed into position?
Why is crypto — after being suppressed, banned and attacked worldwide — now being quietly promoted and fast-tracked in legislation during 2024 and 2025?
Something’s moving beneath the surface.
🔍 In summary:
Expect a tidal wave of global crypto legislation to pass in the coming days/weeks/months.
Crypto — particularly BTC and ETH — will become silent stores of value during the economic storm.
Expect record-breaking levels:
400
K
f
o
r
B
i
t
c
o
i
n
∗
∗
,
∗
∗
400KforBitcoin∗∗,∗∗40K for Ethereum.
Yes, this may sound like science fiction…
But keep your eyes and ears wide open. 👁️
And brace yourself for a historic collapse in U.S. equities. Possibly… something we’ve never seen before.
The show is starting.
And we won’t spoil the ending — because watching it unfold is part of the experience.
But here’s what we can say, thanks to our proprietary algorithmic system:
The U.S. economy will bleed.
And crypto will blow past expectations — fulfilling the very purpose it was built for.
🛒 Load your bags in the coming days...
Because when this train leaves the station —
It won't be stopping for anyone.

#202522 - priceactiontds - weekly update - nasdaqGood Day and I hope you are well.
comment: Not much difference to the dax or sp500, so you can skip the text and just watch the chart. Should look similar to you and you should trade it the same. If you have not read my dax update, please go read it.
current market cycle: trading range
key levels for next week: 20700 - 22000
bull case: Bulls are trapping bears into decent looking shorts just to reverse them strongly. Bulls are still hopeful af and until we have a daily close below 20700, the bull wedge is alive and can lead to higher prices. Bulls are heavily favored to continue until then. Target is obviously 22000.
Invalidation is below 20600.
bear case: Bears need a daily close below 22700 and close the giant gap down to 20200. Until then they have been making money shorting new highs but only for scalps. If we get another good move down next week, you should take big profits before they vanish again. Daily 20ema held for 6 weeks now, expect the next touch to get bought as well.
Invalidation is above 22100.
short term: Bullish that we stay above 20700 and hit 22000 next week. The buying on Friday was so strong, that we can expect higher prices. I will need strong signals though since we had bad news after hours Friday and Friday was also end of month, which can always distort the market bias somewhat.
medium-long term - Update from 2024-06-01: Market is refusing to go down but I can not see this going much more up. Maybe we hit 22000 maybe we don’t. My assumption is still that latest around end of June we begin to decline over the summer. If EU tariffs go through next week or there is no really good news before end of day Friday, expect a blood bath if they come into effect. It’s a trade embargo. No one will ship anything with 50% on top of it and markets are trading like everything is literally perfect.
NASDAQ Meltdown Incoming? The Calm Before the Crash…🚨 Get ready! The NASDAQ is about to take us on a wild plunge straight to the depths of market hell... 💥🔥
Yes, yes, I know—they’ll say it’s all "because of this" or "due to that," the usual play-acting we’ve seen a hundred times before. Just another scene in the never-ending economic theater. 🎭
But here’s the forecast for tomorrow’s news:
📉 United States Initial Jobless Claims – possibly lower than expected?
📈 United States GDP Growth Rate QoQ – higher than expected?
And then... yada yada yada. You know the rest.
What does that mean? A chain reaction in risk-on assets — stocks, indexes, crypto — all heading for a steep drop. 💣📉
If you’re still a believer, here’s your solid proof — laid out 24 hours before it happens. Don’t say we didn’t warn you.
The choice is yours:
💊 Red pill or blue pill?
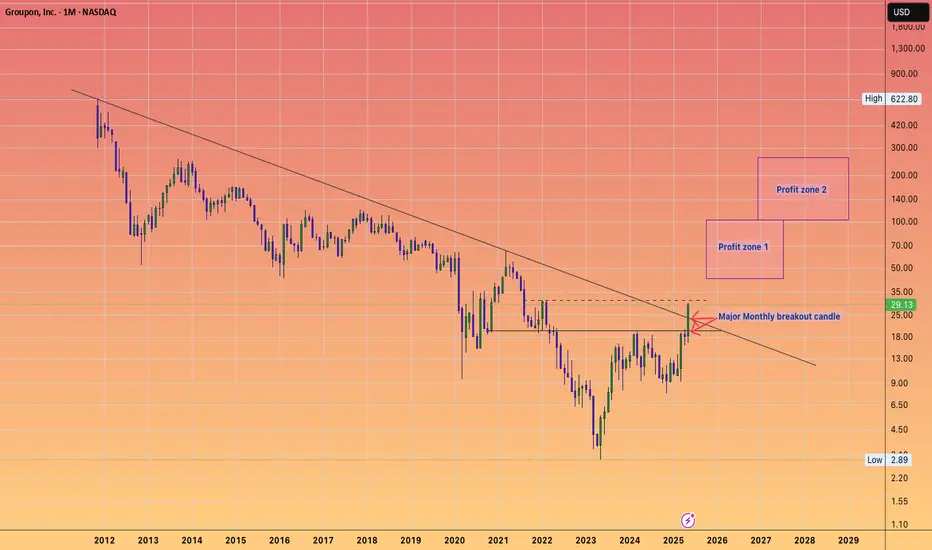
GROUPON IS UP 10X - But more upside to come. #GRPN has been on fire.
It has also smashed through a major downtrend line and key horizontal level.
I expect the trend to continue.
"The company expects 2025 revenue between $493 million and $500 million and adjusted EBITDA of $70 million to $75 million, both topping Bloomberg's consensus estimates of $491.3 million in revenue and $74.8 million in EBITDA. Groupon also projects at least $41 million in free cash flow for the year."
#Roaring20's
Nasdaq RoadmapTo me the view is pretty clear.
* The purpose of my graphic drawings is purely educational.
* What i write here is not an investment advice. Please do your own research before investing in any asset.
* Never take my personal opinions as investment advice, you may lose your money.

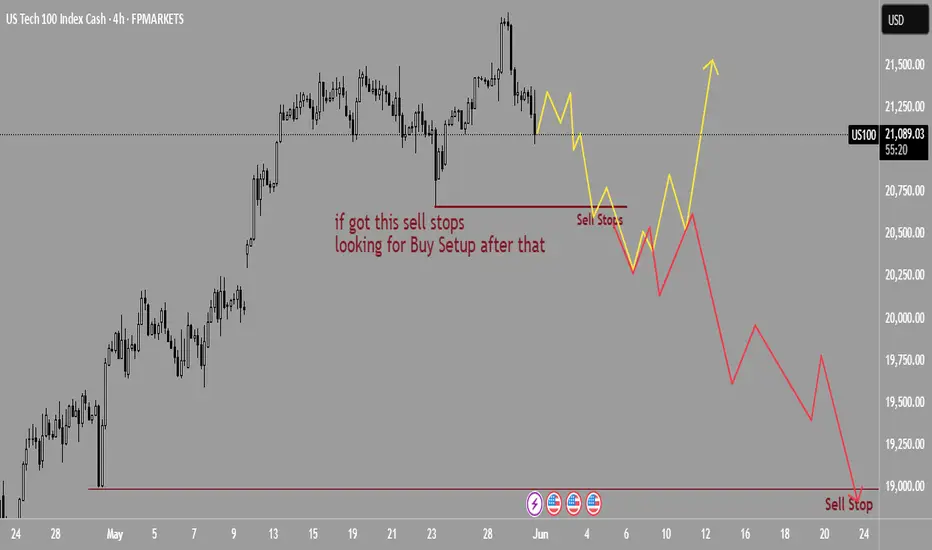
nasdaq : waiting for take the sell stopsThere’s an FVG on the 4H timeframe in Nasdaq,
which indicates strong momentum—likely aiming to hunt some lows.
If the price takes out the specific low I’ve marked,
I’ll watch how the candles react around that area.
If the reaction isn’t strong,
then I’ll start considering a bullish scenario
and look for a potential long setup.
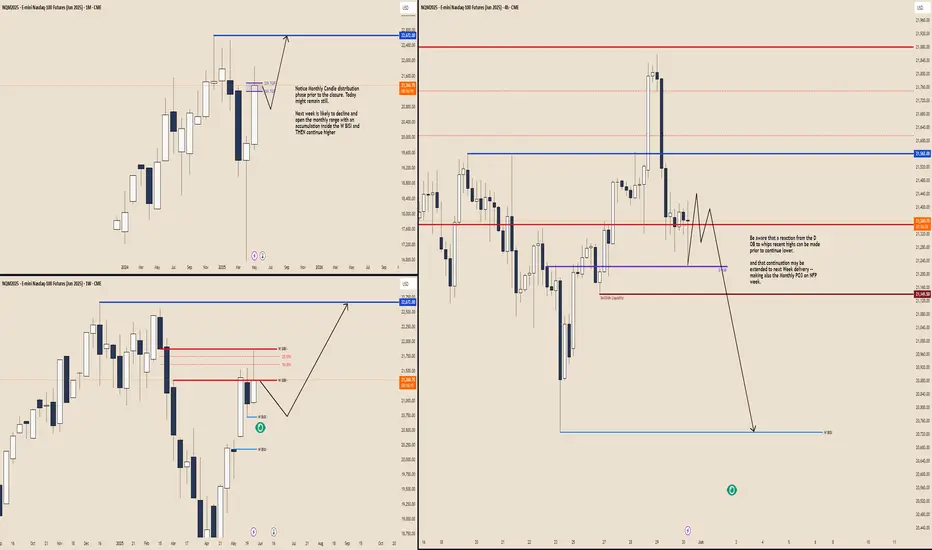
Nasdaq Next Week and June Month ForecastNotice Monthly Candle distribution phase prior to the closure. Today might remain still and whips recent swings highs and lows as a reaction from the D +orderblock
Next week is likely to decline and open the monthly range with an accumulation inside the W BISI and THEN continue higher throughout the rest of the month and reach 22,672.00
NASDAQGiven the geometry that has been created, there is a possibility of a correction towards the price of 21687.9, either from the current price or from a little lower, if the bottom of 21219 is broken, another decision must be made.
NASDAQ:NDX

25.05.30 nasdaq analysis📊
📌 Previous Trade Summary
Most traders anticipated an upward move due to the previous day's rally.
However, a bearish trendline breakdown led to a sell-off.
A short entry became valid, marked with a red circle on the chart.
Result: ~139 points gained per contract, approx. $2,800 profit.
🕓
Currently, the 4-hour chart shows support at the 60EMA,
but the overall structure remains bearish due to a trendline breakdown.
If the 60EMA fails to hold, a stronger downtrend could unfold.
The morning low at 21,268.50 could act as a potential rebound zone.
➡️ No clear short signal at the moment – waiting for more structure.
📈
The key to a long entry lies in breaking the short-term resistance trendline.
A full bullish trend reversal is expected only above 21,557.75.
Until then, take-profits at stepwise levels remain the strategy.
🟢 Long Entry Condition
Entry: Above 21,417.5
TP1: 21,447
TP2: 21,485
TP3: 21,522
TP4: 21,557 (trend reversal confirmation)
🔴 Stop Loss
If the 15-minute candle closes below the 20EMA after entry → cut losses.
📌 Summary
Short setup: Requires more confirmation, no entry for now.
Long setup: Valid above 21,417.5 with targets up to 21,557.
Trend reversal key level: 21,557 breakout.
Avoid anticipation—enter only when conditions are met.

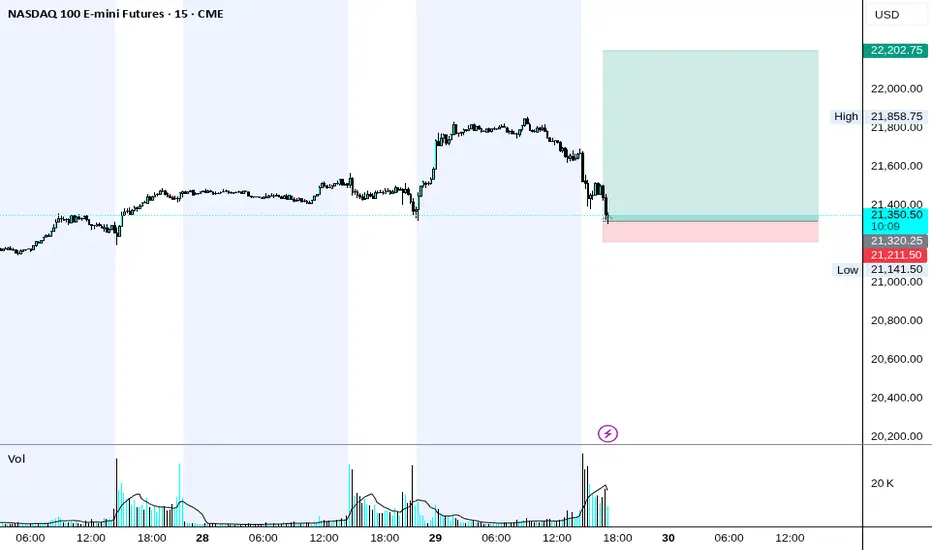
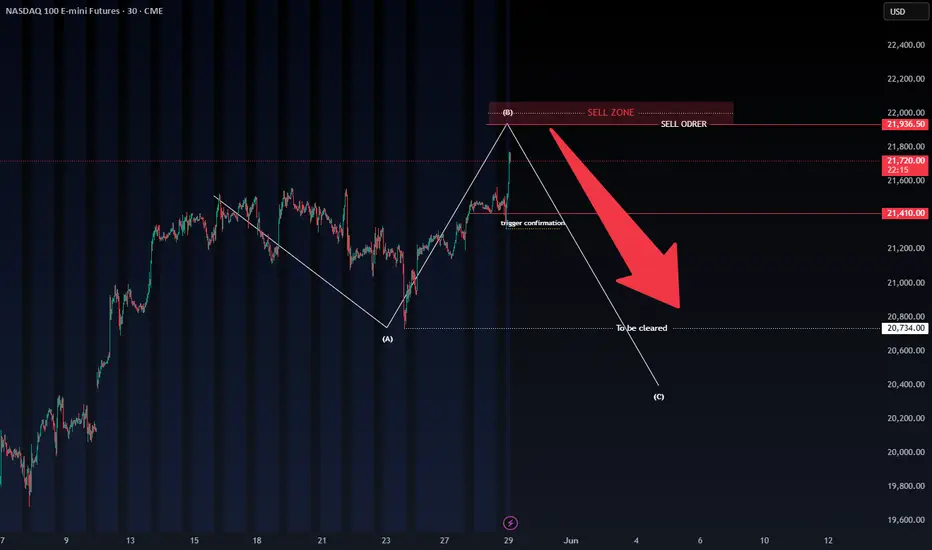
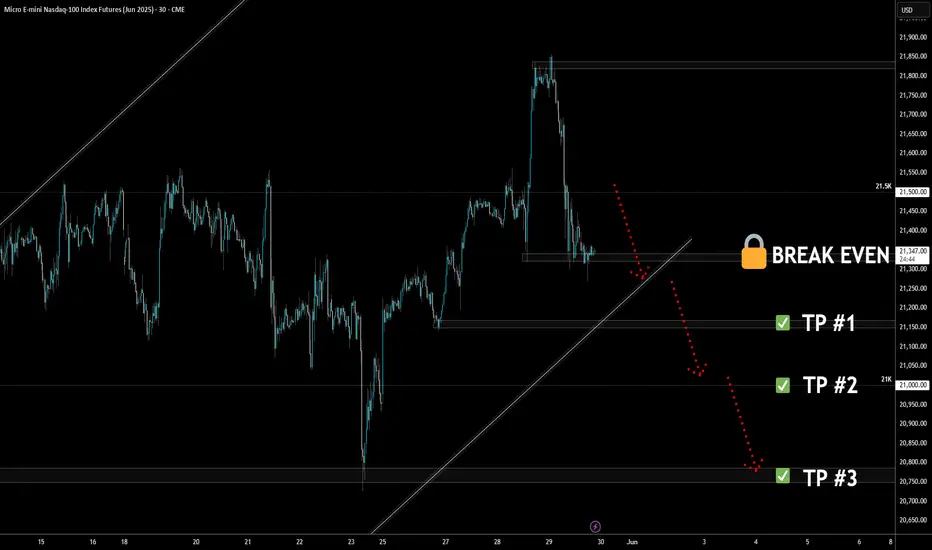
NQ Breakdown Plan: 3 Targets, 1 Setup, No Chasing🧠 NQ Short Plan – NY Open Game Plan
Price has pulled back into a key structure zone, and I’m watching closely for a sell setup during the first two hours of the New York session tomorrow.
📌 My trade plan is simple:
I want a solid pullback first — not chasing here.
If I get a clean sell trigger (candle confirmation or momentum flush), I’m in.
Break-even gets locked in once we break the 21,349 area.
From there, I’ll take profits in three stages and trail the stop behind price if we get momentum.
🔐 Break-Even Lock: 21,349
✅ TP #1 – 21,200
✅ TP #2 – 21,050
✅ TP #3 – 20,800 (final leg if sellers step in hard)
The rising trendline break could be the domino. If it cracks, we roll.
But if bulls defend again, no trade — discipline first.
📅 Session Focus: Only trading this setup if it unfolds in the first 2 hours of NY open. After that, I’m out.
No chasing. No revenge. Just execution.
💬 Let me know if you’re watching this level too — or if you see something different. Always open to alternate perspectives.
2025-05-29 - priceactiontds - daily update - nasdaqGood Evening and I hope you are well.
comment: I don’t know what’s more likely to happen tomorrow and every time I feel that way, market is in a trading range and most likely neutral. Big up, big down, big confusion. Read some Al Brooks. Volume was big today but given that bears only managed to close 60 points below Wednesday, what did they achieve? RTH session closed the gap but not more. Futures obviously had a nasty reversal but we can still draw a decent bull wedge with lows either 21300 or 21100 and that would mean bulls would be favored to trade back up.
current market cycle: trading range
key levels: 21000 - 22000
bull case: Bulls who want to buy 21400 would likely need a stop 20700 and scale in. Is this a good trade? I don’t think so. You either wait for better confirmation that today’s low is credible and will hold or you wait for lower prices closer to 21000 before going long. I doubt this bull wedge will just end like this and that we top out with 21858. I expect at least some form of double top with a print up to 21700 or higher. The middle of the current range is 21300 and market bottomed out there today. Maybe this fact makes it a bit more favorable for the bulls.
Invalidation is below 21300.
bear case: Below 21300 bears could try to go for 21000 or even last weeks low at 20727. How likely is that? Today’s selling was very strong and it was at the moment everything was max bullish and perfect aligned. You do not see these type of reversals in a strong bull trend. We are very likely in the last days of it before we go down lower. That being said, I just don’t think we will go down further from here without another try of 21800+. I have two potential bull wedges on my chart and bears would need a strong move below 21300 and stay around 21000 for me to abandon that structure.
Invalidation is above 22100.
short term: Neutral and need a very good signal to either side for me to take it. Bears want 21000 and bulls at least 21800. My line in the sand is 21300.
medium-long term - Update from 2024-05-24: Will update this section more after the coming week but in general the thesis is as for dax. Down over the summer and sideways to up into year end. I don’t think the lows for this year are in.
trade of the day: Buying Globex open was the obvious trade but shorting the highs certainly was not and I think everyone was surprised by this bear strength today.

NASDAQThe target is for the price of 21272.4 to fall, with any correction if the ceiling of 21802 is not broken, a short trade can be made.
CAPITALCOM:US100

Volume Power System Signal to Buy Nasdaq We have a good signal from ouer System VPS to buy the NASDAQ and hold the position until a new reversal signal appears.