Clean Energy: The Power That Will Shape Our FutureEnergy is the lifeblood of civilization—it fuels innovation, sustains economies, and powers every aspect of modern life. As demand skyrockets, we face a crucial decision: continue relying on fossil fuels that damage our planet or embrace clean energy solutions that pave the way for a sustainable future.
Despite geopolitical tensions, trade wars, and shifting policies around ESG and the Paris Climate Agreement, the clean energy sector remains unstoppable. While industries like digital finance, artificial intelligence, robotics, space exploration, quantum computing, and cloud infrastructure are experiencing unprecedented growth, they all hinge on one fundamental resource: energy. Without it, progress would stall.
Yet, as we race toward technological advancement, one truth remains: our planet’s well-being is inextricably linked to our energy choices. Sustainability is not just an option—it is a necessity.
The Four Elements of Clean Energy
Nature has already gifted us four forces of life—the sun, wind, water, and earth—each holding the potential to drive a clean energy revolution.
Solar Energy ☀️: Every hour, the sun showers Earth with more energy than humanity consumes in a year. Advances in photovoltaic technology are making solar power more efficient and affordable than ever. Countries leading the solar revolution—like China, Germany, and the U.S.—are setting a precedent for global energy transformation.
Wind Energy 🌬️: Harnessing the wind is one of the most effective ways to generate clean electricity. Offshore wind farms are growing at an exponential rate, proving that sustainable energy is not limited to land. The beauty of wind energy? It is limitless.
Hydropower 🌊: Water is power. Hydroelectric dams, tidal energy, and wave power offer continuous energy supply, proving to be one of the most reliable renewable sources available.
Geothermal Energy 🌍: Deep within the earth, heat energy is waiting to be tapped. Countries like Iceland have perfected the art of using geothermal power for electricity and heating, demonstrating that sustainable energy is not just a dream—it’s already reality.
Overcoming Challenges: The Resilience of Clean Energy
Yes, clean energy faces obstacles—tariff disputes, political instability, and corporate resistance. But progress is relentless. Costs of renewables are dropping, supply chains are adapting, and governments know that fossil fuels will not sustain global economies forever.
The Paris Climate Agreement keeps nations accountable, pushing for policies that support decarbonization and incentivize clean energy innovation. Meanwhile, ESG-driven investors are demanding sustainable business practices, forcing corporations to rethink their energy strategies.
Even legacy industries like oil and gas are shifting toward renewables, investing billions in solar, wind, and hydrogen technology. This is not just a trend—it is the future.
A Future Powered by Clean Energy
Imagine cities illuminated by solar grids, transportation fueled by hydrogen, and industries driven by wind power. Clean energy is not just about reducing emissions—it is about progress, prosperity, and survival.
The global energy demand is rising, but so is innovation. If space exploration, AI, robotics, and quantum computing are to thrive, clean energy must be at the core. And it will be—because the world is waking up to its necessity.
A cleaner, brighter future is not wishful thinking—it is already unfolding. The only question is: will we accelerate the transition, or hesitate in the face of change?
The time to act is now.
NASDAQ:CLNE NASDAQ:CETY NASDAQ:ICLN NASDAQ:CELS NASDAQ:GWE AMEX:PBD TVC:DXY
Nasdaq

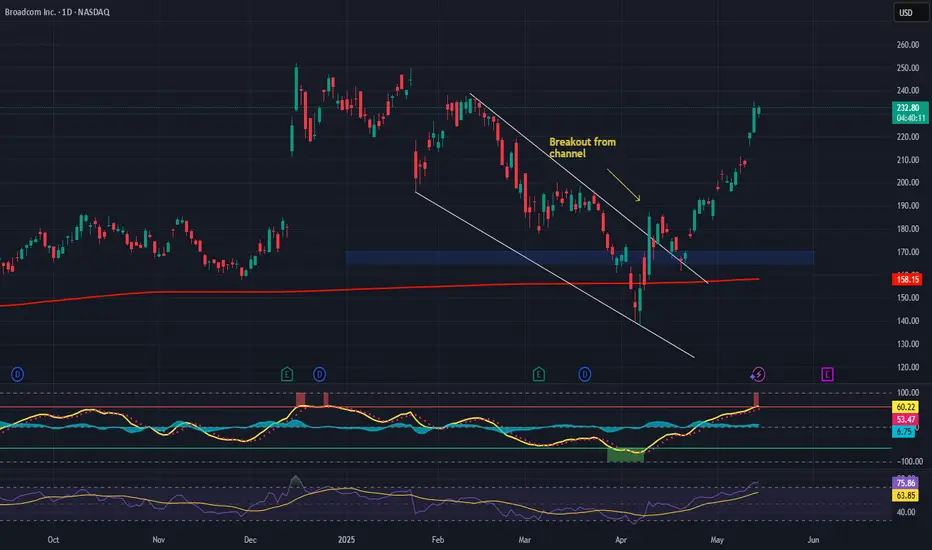
Broadcom Inc. (AVGO): Software-Driven Growth Meets AI Hardware ECompany Overview:
Broadcom NASDAQ:AVGO is undergoing a strategic transformation—shifting from a hardware-centric model to a hybrid software and subscription platform. The VMware acquisition is proving pivotal, reshaping AVGO’s margin profile and deepening its enterprise moat.
🔑 Growth Catalysts:
💻 VMware Integration = High-Margin Recurring Revenue
70%+ of top 10,000 VMware customers already moved to subscription model
Transition boosts revenue visibility, margin expansion, and valuation multiples
Strong cross-sell opportunities within Broadcom’s enterprise base
⚙️ Custom AI Chips – A Key NVIDIA Hedge
Broadcom’s custom AI accelerators offer an alternative amid export curbs
Strong demand from hyperscalers and cloud players (Amazon, Google, Meta)
Positioned as a strategic silicon supplier in the AI infrastructure stack
📶 Diversification = Resilience
Deep reach across networking, broadband, storage, and wireless
Reduced cyclicality vs. pure-play semiconductor firms
Balanced between enterprise software and hardware demand
🛡️ Geopolitical Edge
Broadcom’s chip solutions provide alternatives in regions impacted by U.S.-China tech tensions
VMware’s software suite ensures relevance in multi-cloud and hybrid IT environments
📊 Financial Highlights:
Consistent double-digit free cash flow growth
EBITDA margin expansion via software scale and cost synergy post-VMware
Shareholder-friendly with strong buybacks and dividend growth
📈 Investment Outlook:
✅ Bullish Above: $165.00–$170.00
🚀 Upside Target: $270.00–$280.00
🎯 Thesis: With AI tailwinds, VMware synergies, and rising recurring revenues, Broadcom is evolving into a software+silicon powerhouse—positioned for outsized returns and resilience in volatile markets.
#Broadcom #AVGO #VMware #AIchips #Semiconductors #EnterpriseSoftware #RecurringRevenue
NASDAQ US100 Overextended? Waiting for the Pullback🚨 NASDAQ #100# Analysis 🚨
I'm currently watching the NASDAQ (US100) 📊, and in my view, it's looking overextended. Price is now trading into previous daily highs 📈 without showing a meaningful retracement. Historically, when we look back at the chart, we rarely see such strong rallies without some form of pullback 🔄.
A healthy trend typically follows a natural rhythm — rally, retrace, rally or expand, pull back, expand again. In this case, that retracement is missing ❌, which raises caution flags for me 🚩.
🎥 In the video, I break down:
Price action & market structure 🧩
The current trend 📉📈
A potential long opportunity — but only if price pulls back into my point of interest (POI) 🧲 and we then get a bullish break in market structure (BoS) 🟢.
🔒 This is not financial advice. Always do your own research and trade responsibly!

2025-05-13 - priceactiontds - daily update - nasdaqGood Evening and I hope you are well.
comment: Can’t get more bullish than this but I am not willing to buy the exact high but rather would wait for a pullback. The only thing that we turn me neutral right now, would be a > -2% down day and close below 20800.
current market cycle: trading range
key levels: 19700 - 20600
bull case: My lowest measured move target is 22350. Market should stay above 20000 if bulls want to get there and that’s likely all that’s important about the nasdaq for now. Clear breakout and follow-through. Bears gave up and we are again at peak euphoria.
Invalidation is below 20000.
bear case: Bears need a miracle below 20000. That’s it. Could this become a bull trap and an exhaustion gap? Always possible but I think it’s so unlikely that you can not make money betting on those odds. Path of least resistance is up, Opex or not. What I do think is that we could be close to the top of the channel we are in and we go sideways for the next days. I drew potential upper bull channel line but confirmation would only be if we don’t print anything above 21350 tomorrow.
Invalidation is above 20400.
short term: Neutral. Bulls grinding but for how many more tries? If that is bad English, you can suck my Bratwurst.
medium-long term - Update from 2024-04-20: My most bearish target for 2025 was 17500ish, given in my year-end special. We are +18% from the lows and I do think, once this turns again, it will easily be the short trade of the year.
trade of the day: Shorting new highs continues to print money.

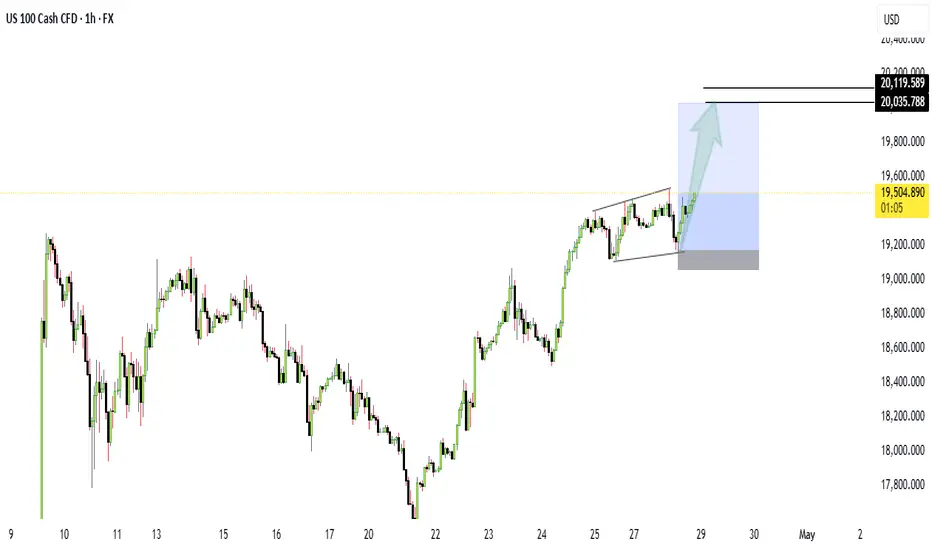
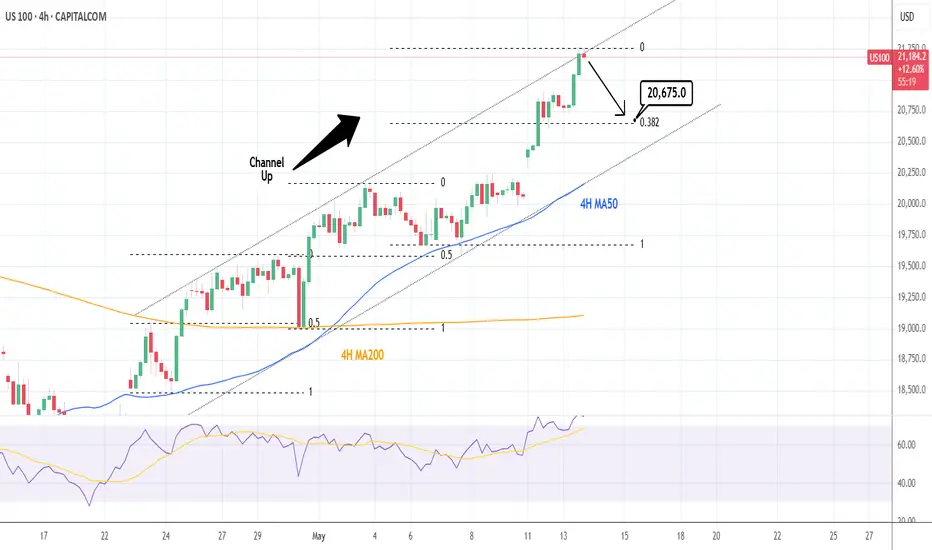
NASDAQ: Time for a 4H technical correction.Nasdaq is almost overbought on its 1D technical outlook (RSI = 69.775, MACD = 371.830, ADX = 37.524) and has reached the top of its 4H Channel Up. The two HH that the pattern has both pulled back to the 0.5 Fibonacci retracement level before the 4H MA50 provided the necessary support for the next bullish wave. Consequently we expect a small correction to at least the 0.382 Fib next (TP = 20,675).
See how our prior idea has worked out:
## If you like our free content follow our profile to get more daily ideas. ##
## Comments and likes are greatly appreciated. ##
Nasdaq Tests Key 20,900 ResistanceAs shown in chart above, price action is hovering near the neckline of a well-defined double top pattern, formed between December 2024 and February 2025, similarly across the Dow and SPX500 charts.
This reinforces a key resistance zone that could either validate a more sustainable bullish outlook into 2025 — or trigger another correction if rejected.
Nasdaq Upside Scenario: A confirmed hold above 20,900 may extend gains toward 21,500, and 22,200.
Downside Scenario: A pullback below 20900 and 20,500 could find support at 20,200, 19,600, and 19,170, respectively.
Markets are currently holding on trade optimism, yet key economic reports are likely to test the narrative
Written by Razan Hilal, CMT
NASDAQ SHORT1. All timeframes are massively overbought with RSI
2. There is a triple top on H1 and H4 with a lot of divergence
3. Trend is still up, so look to exit with any indicator
4. There is a AB=CD pattern on H1 and H4 which shows that this trade will finally retrace
5. Target 1 is at 20200
6. Previous days high is not broken which shows there is a lot of resistance at this level.

Nasdaq-100 H4 | Falling toward a pullback supportThe Nasdaq-100 (NAS100) is falling towards a pullback support and could potentially bounce off this level to climb higher.
Buy entry is at 20,336.30 which is a pullback support.
Stop loss is at 19,500.00 which is a level that lies underneath an overlap support and the 23.6% Fibonacci retracement.
Take profit is at 21,500.25 which is a pulback resistance that aligns with the 127.2% Fibonacci extension.
High Risk Investment Warning
Trading Forex/CFDs on margin carries a high level of risk and may not be suitable for all investors. Leverage can work against you.
Stratos Markets Limited (tradu.com):
CFDs are complex instruments and come with a high risk of losing money rapidly due to leverage. 63% of retail investor accounts lose money when trading CFDs with this provider. You should consider whether you understand how CFDs work and whether you can afford to take the high risk of losing your money.
Stratos Europe Ltd (tradu.com):
CFDs are complex instruments and come with a high risk of losing money rapidly due to leverage. 63% of retail investor accounts lose money when trading CFDs with this provider. You should consider whether you understand how CFDs work and whether you can afford to take the high risk of losing your money.
Stratos Global LLC (tradu.com):
Losses can exceed deposits.
Please be advised that the information presented on TradingView is provided to Tradu (‘Company’, ‘we’) by a third-party provider (‘TFA Global Pte Ltd’). Please be reminded that you are solely responsible for the trading decisions on your account. There is a very high degree of risk involved in trading. Any information and/or content is intended entirely for research, educational and informational purposes only and does not constitute investment or consultation advice or investment strategy. The information is not tailored to the investment needs of any specific person and therefore does not involve a consideration of any of the investment objectives, financial situation or needs of any viewer that may receive it. Kindly also note that past performance is not a reliable indicator of future results. Actual results may differ materially from those anticipated in forward-looking or past performance statements. We assume no liability as to the accuracy or completeness of any of the information and/or content provided herein and the Company cannot be held responsible for any omission, mistake nor for any loss or damage including without limitation to any loss of profit which may arise from reliance on any information supplied by TFA Global Pte Ltd.
The speaker(s) is neither an employee, agent nor representative of Tradu and is therefore acting independently. The opinions given are their own, constitute general market commentary, and do not constitute the opinion or advice of Tradu or any form of personal or investment advice. Tradu neither endorses nor guarantees offerings of third-party speakers, nor is Tradu responsible for the content, veracity or opinions of third-party speakers, presenters or participants.

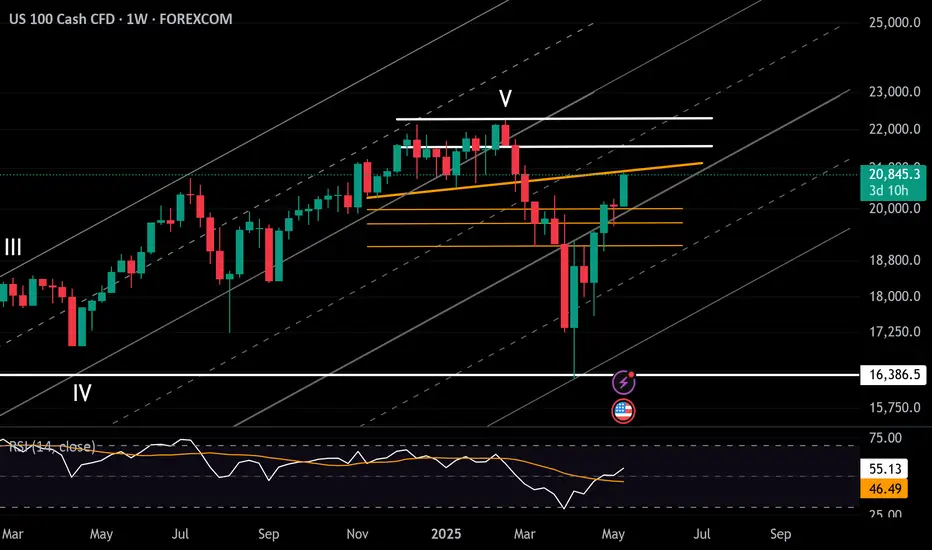
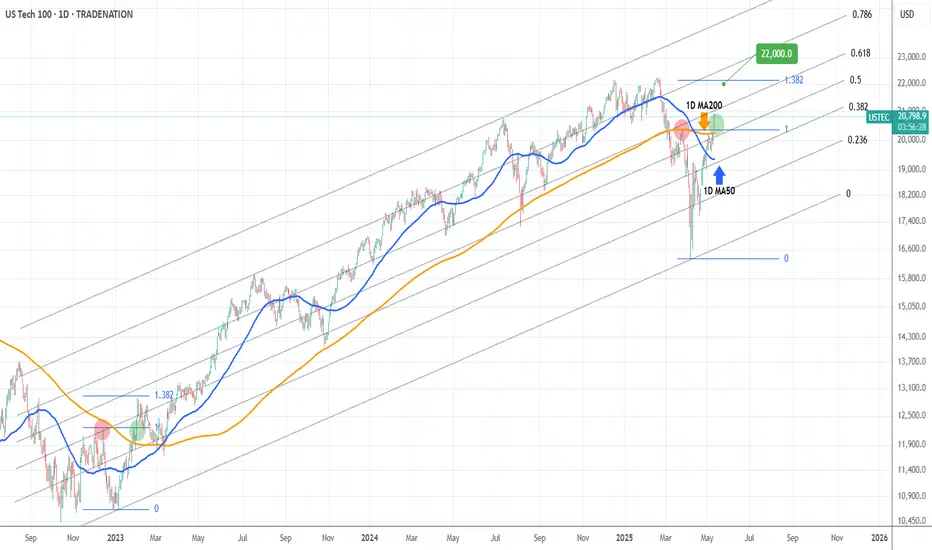
NASDAQ broke above its 1D MA200 after 2 months! Target 22000.Nasdaq (NDX) broke today above its 1D MA200 (orange trend-line) for the first time in more than 2 months (since March 06), following the U.S. - Chine trade deal. This trend-line also had the March 26 rejection under its belt, which initiated the most aggressive part of the 'Trade War' correction.
The last time the index broke above its 1D MA200 on a similar pattern was when it was recovering after the bottom of the 2022 Inflation Crisis. The February 01 2023 break-out produced an instant rise to the 1.382 Fibonacci extension before a short-term correction to re-test the 1D MA200.
As a result, we expect 22000 (1.382 Fib ext) to come as early as this week before any discussions can be made for a new pull-back.
-------------------------------------------------------------------------------
** Please LIKE 👍, FOLLOW ✅, SHARE 🙌 and COMMENT ✍ if you enjoy this idea! Also share your ideas and charts in the comments section below! This is best way to keep it relevant, support us, keep the content here free and allow the idea to reach as many people as possible. **
-------------------------------------------------------------------------------
Disclosure: I am part of Trade Nation's Influencer program and receive a monthly fee for using their TradingView charts in my analysis.
💸💸💸💸💸💸
👇 👇 👇 👇 👇 👇
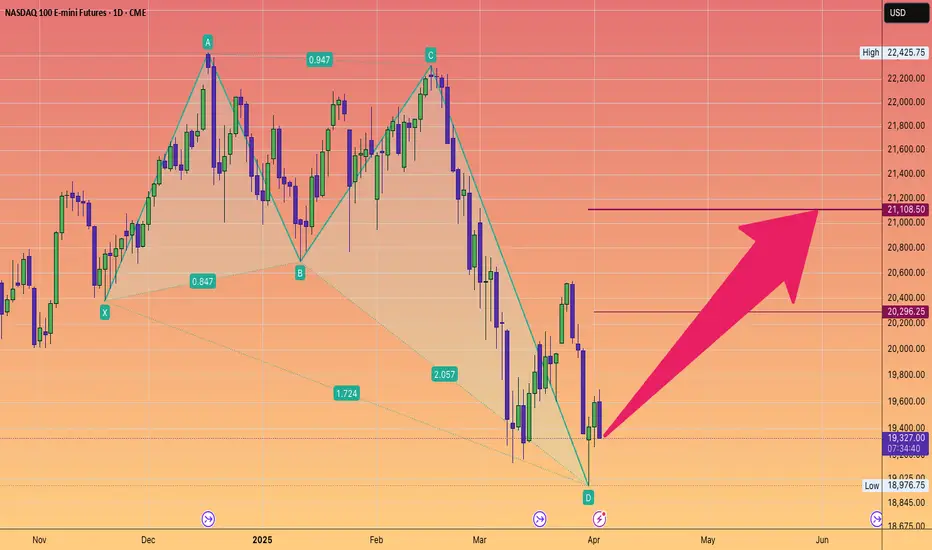
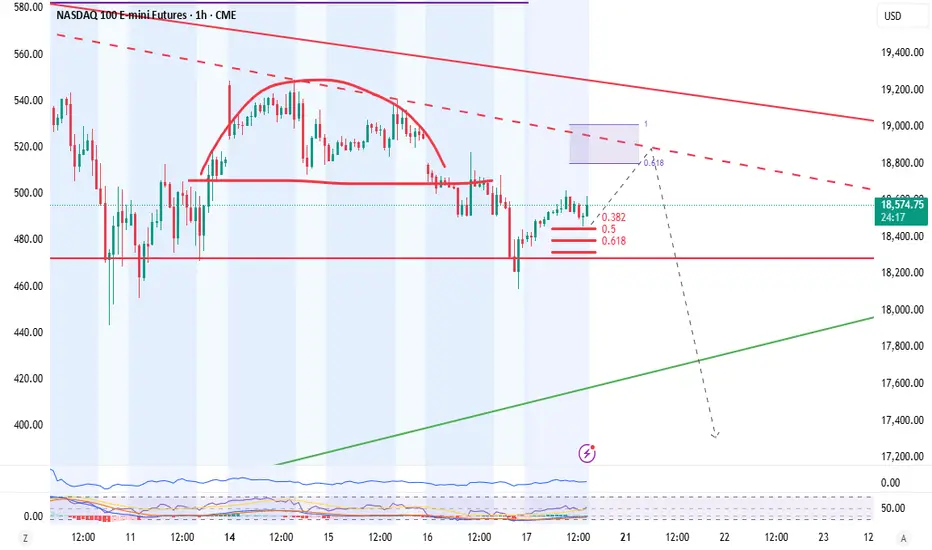
NASDAQ Harmonic pattern indicating strong bounce incoming.AI vs. Dot-Com Bubble
When drawing parallels between #AI and the dot-com bubble of the late 1990s, many express concerns that current valuations may be excessively inflated. However, significant differences are apparent.
To begin with, the current price-to-earnings (PE) ratio of the NASDAQ-100 is approximately 30, whereas during the dot-com bubble, it skyrocketed to 200, with many companies lacking any earnings in sight.
Additionally, the market capitalisation to #GDP ratio reached unprecedented levels in the late 1990s, while today's figures, although still high, are supported by robust earnings and solid cash flows from established business models.
Innovations in AI, cloud computing, and digital transformation have fuelled revenue growth, exemplified by #NVIDIA's data centre sales, which surged 409% year-over-year in Q4 2024, and Microsoft's Azure, which experienced a 28% year-over-year increase in 2024. This surge in productivity is being driven by individuals, businesses, and governments alike.
As a result, major tech firms are making substantial investments in AI research and development, with clear strategies for monetisation.
AI is poised to become a transformative force, akin to the transistor, a groundbreaking invention that scales effectively and permeates various sectors of the economy.
Lastly, the Federal Reserve raised interest #rates to 6.5% to tackle inflation after previously lowering them to address Y2K concerns before the bubble burst in 2000.
In contrast, current expectations suggest that interest rates will stabilise or decrease, which would support valuations.
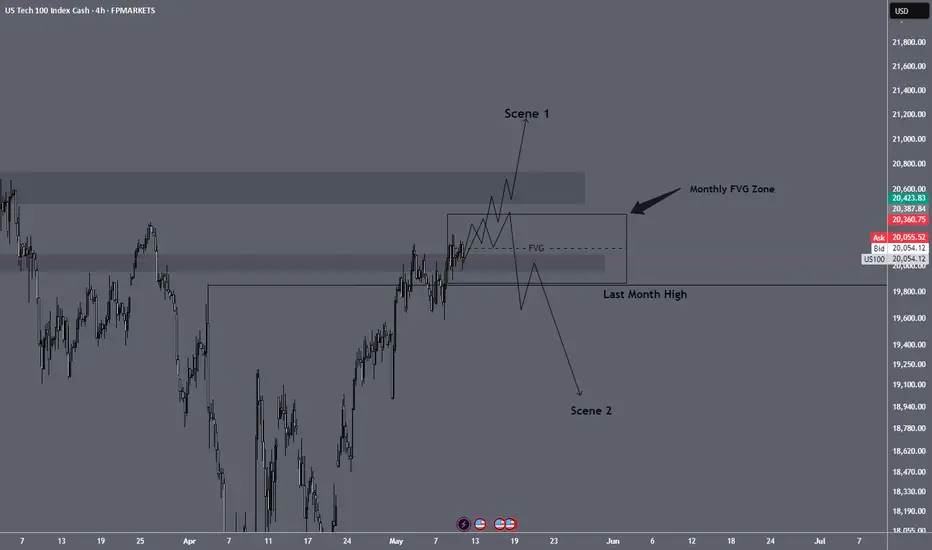
NASDAQ Fall? US100 AnalysisHello everyone.
We had a volatility at stock market last 2 month, it looks like market had good correction and found new buyer. BUT I DON'T THINK LIKE THAT.
After MR. Trump inauguration we saw bear market signals, it was like hedge funds dumped stocks, but after strong sell new buyers came at market and show us pretty good market correction but what will be next? The last 2 months brought intense volatility post-Trump’s inauguration. Hedge funds sold off heavily (S&P 500 dropped ~8% from its December high), but buyers stepped in, pushing a 5% retracement. RSI on SPY shows oversold conditions fading, yet I’m skeptical of this bounce.
Why? Bearish signals linger. VIX remains elevated (>20), and volume on up days is weaker than selloffs. Plus, geopolitics could derail this rally. Over the weekend, Ukraine and Russia discussed a 30-day ceasefire. If talks fail, the West’s new sanctions could spike oil prices (Brent crude already testing $80) and hammer energy-heavy indices like XLE or European markets (DAX).
I’m watching SPY’s 200-day MA (~510) as key support. A break below could signal a deeper pullback to 480. Energy and tech (QQQ) look vulnerable if sanctions hit. What’s your take—buying this dip or bracing for more downside?
Here is my 2 scene what i am expect from market, for me Scene and technical view scene 2 is more logical bur we will see what will be next step for stock market.
For collaboration text me in DM!!!
Always make your own research!!!
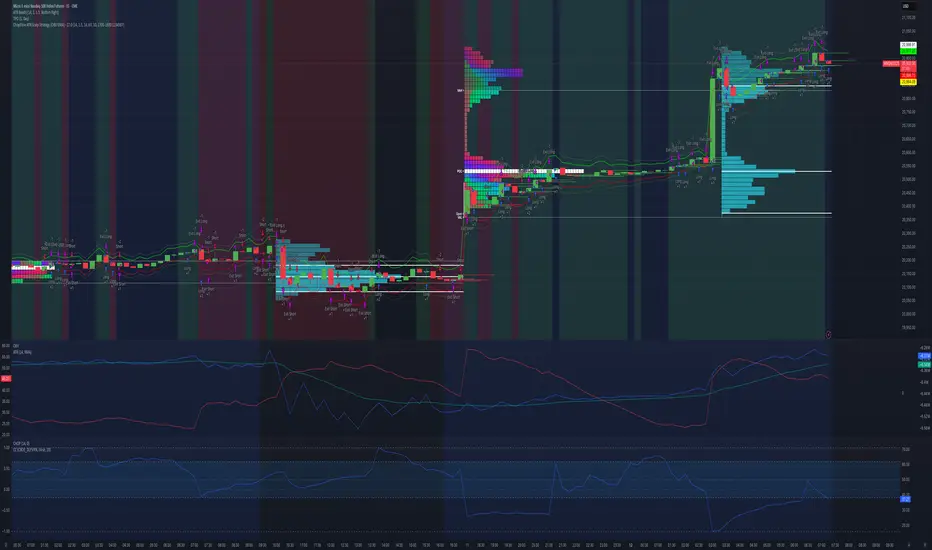
ChopFlow ATR Scalp Strategy (OBV EMA) on MNQThe ChopFlow ATR Scalp Strategy combines a low choppiness regime filter, on-balance volume with EMA confirmation, and ATR-based exits to capture quick micro-trends on the NASDAQ-100 E-mini (MNQ).
Strategy Logic
1. Choppiness Filter:
-Calculate the Choppiness Index over 14 bars.
- Trade only when chop < 60 (trending or mildly trending market).
2. Order-Flow Confirmation:
- Compute OBV and its 10-period EMA.
- Long when OBV > OBV EMA and chop < threshold.
- Short when OBV < OBV EMA and chop < threshold.
3. ATR-Based Exit:
- Exit at a fixed multiple of ATR (stop and profit target both = 1.5 × ATR).
How to Trade It
1. Confirm time chart with MNQ , preferably1-min chart.
2. Enable only the 17:00–16:00 CME session.
3. Look for low choppiness (< 60), then wait for OBV cross.
4. Enter with one-contract size, tight 1.5× ATR stops/profits.
5. Monitor DOM for liquidity shifts around entry levels.
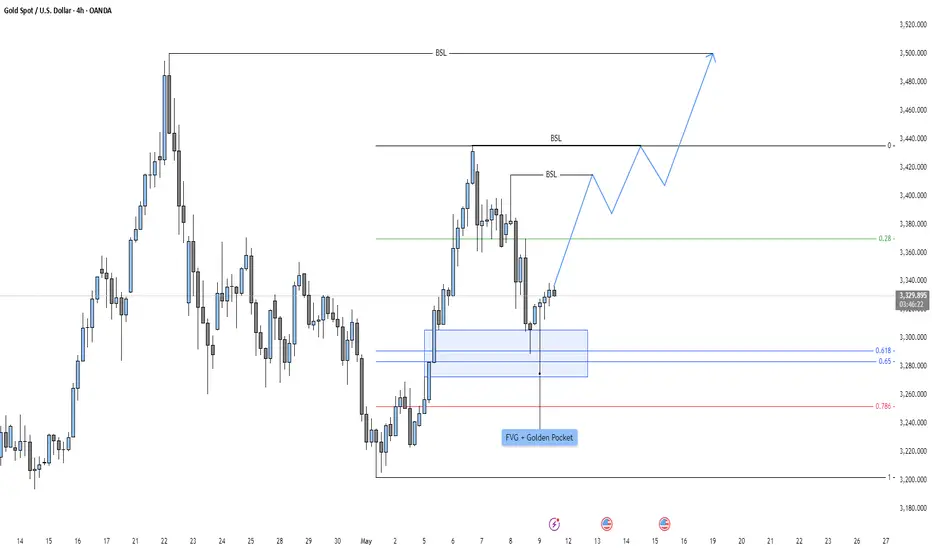
Gold - New All Time High in the making?market context and trend environment
This 4-hour chart of Gold (XAU/USD) from OANDA illustrates a strong impulsive structure within a broader bullish trend. Following a sharp upward movement that broke through previous structure, gold formed a swing high before entering a corrective phase. The market has since pulled back and appears to be stabilizing near a zone of high confluence, suggesting potential for a renewed move to the upside. Price has respected key retracement levels, reinforcing the technical strength of this zone.
fair value gap and fibonacci confluence
A notable feature of this setup is the alignment between a visible fair value gap and the Fibonacci golden pocket zone, comprising the 0.618–0.65 retracement levels. This convergence of technical tools adds weight to the significance of the support zone around the 3,280–3,300 region. Fair value gaps represent inefficiencies in the market caused by strong institutional participation, while the golden pocket is historically known for acting as a magnet for reversals within trending markets. The presence of both in the same area increases the likelihood of price reacting positively here.
liquidity sweep and structural reaction
Before revisiting this key demand zone, price briefly swept below a local low, which may have served as a liquidity grab to fuel the next bullish leg. This liquidity sweep is followed by a sharp reaction, suggesting that downside pressure may have been absorbed by aggressive buyers positioned at the FVG and golden pocket. Price has since rebounded, and the subsequent price action shows a gradual formation of higher lows, hinting at a shift in short-term order flow back in favor of buyers.
projection and bullish scenario
The chart projects a potential bullish continuation move, with a series of higher lows anticipated to form en route to a break of structure above recent swing highs. Multiple buy-side liquidity levels (BSL) are marked, representing areas where buy stops are likely to be clustered. These zones offer clear targets for bullish expansion. The blue arrowed projection outlines a methodical stair-step advance, respecting interim levels before ultimately attempting to reach the prior high near 3,530.
strategic framework and trader insight
This chart offers a methodical roadmap for bullish continuation, rooted in the smart money framework of liquidity, inefficiency, and institutional order flow. The confluence between the fair value gap and Fibonacci retracement is particularly notable and serves as a key validation area for bullish traders. Rather than anticipating immediate breakout behavior, the projection emphasizes a progressive structure that aligns with how larger players tend to accumulate positions before moving the market. Patience and alignment with structure are emphasized as price prepares for a potential continuation move higher.
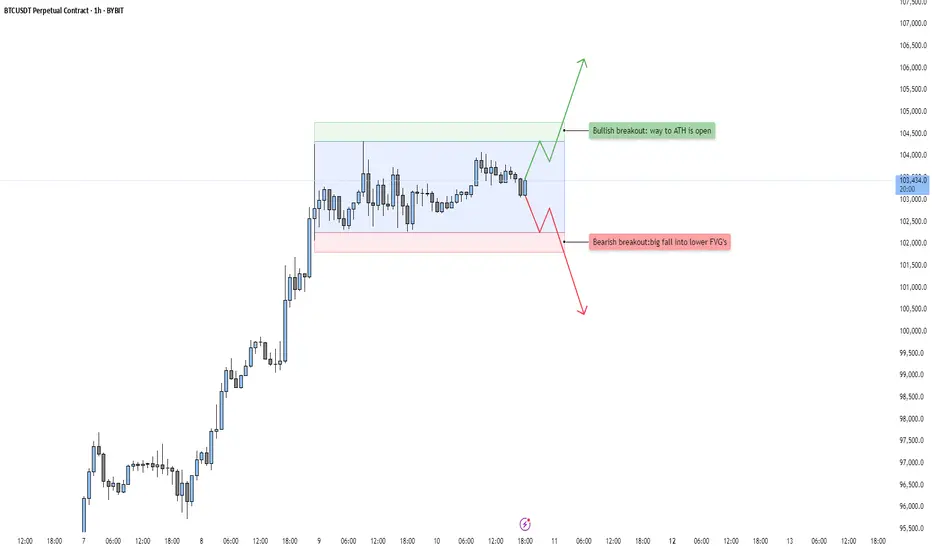
BTC - Bulls vs Bears! Who will win?current market context
the chart displays btcusdt on the 1-hour timeframe, currently in a consolidation phase following a strong impulsive move to the upside. this phase is characterized by a range-bound price action forming a horizontal channel, with clear resistance near the top of the range and support near the bottom. the price is fluctuating between these two levels, indicating temporary equilibrium in the market where neither buyers nor sellers have established dominance.
consolidation structure
this range is acting as a reaccumulation zone, typically formed after a significant move when the market pauses to either absorb liquidity or distribute orders before the next impulsive leg. within this range, traders are positioning themselves for a potential breakout, and institutional players may be accumulating or offloading large positions depending on market intent. the balance within the range suggests that market participants are awaiting a catalyst before committing in size to a direction.
bullish breakout scenario
if price breaks above the range high, it would signal bullish continuation. such a breakout would likely occur with increased volume and a strong momentum candle, confirming buyer interest and initiating an expansion move. this move could target new highs, potentially opening the path toward all-time highs as the breakout clears short-term liquidity and invalidates local bearish structures. the green projection on the chart visually outlines this potential path, where the breakout leads to higher prices with minimal resistance above.
bearish breakout scenario
alternatively, a breakdown below the range low would indicate a shift in short-term market sentiment and a break in bullish structure. this scenario would likely trigger sell-side liquidity and initiate a quick move toward lower fair value gaps. these gaps, left unmitigated during the previous bullish rally, now serve as potential targets for price to fill. the red arrow illustrates a scenario where price pierces below support, accelerates lower, and seeks inefficiencies and demand zones around the \$98,000–\$95,500 levels. this breakdown would likely be sharp, driven by stop-loss triggers and sell-side imbalances.
range as a decision zone
the current structure represents a critical decision zone. the upper and lower boundaries are pivotal breakout levels, and the outcome of this consolidation will determine the short- to medium-term market direction. traders should exercise caution while price remains within the range, as fakeouts or liquidity sweeps are common near such levels. confirmed structure breaks and volume surges should serve as validation tools before entering directional trades.
liquidity and volume considerations
liquidity resting above and below the range acts as fuel for the eventual move. the longer the range holds, the more liquidity builds on either side, increasing the probability of a strong expansion when price finally breaks out. volume analysis will be key in validating the breakout’s legitimacy—without accompanying volume, the breakout could fail and result in a false move or whipsaw.
summary
this setup provides a high-probability environment for breakout traders and those waiting to trade the trend continuation or reversal. the market is compressing within a well-defined range, and a decisive breakout is likely imminent. preparation, not prediction, is the priority—wait for confirmation of structure shift and volume expansion before committing to either side.
BTC - Accumulation, Manipulation & Distributioncurrent market structure
this btcusdt 1-hour chart illustrates a classic three-phase market structure: accumulation, manipulation, and potential distribution. the price action follows a strong bullish impulse, after which the market enters a sideways range suggesting absorption of previous selling pressure. this kind of behavior is often observed before a continuation of the prevailing trend, but not without intermediate structural games, as seen in the projected manipulation phase.
accumulation phase
the blue highlighted zone marks a consolidation range that serves as an accumulation phase. during this stage, large market participants likely accumulate positions quietly while maintaining the price within a defined range. the tight price action within this zone and relatively small candles are consistent with market absorption, where supply is being matched or outpaced by demand. the repeated rejections of lower prices in this range imply growing buyer interest and strength building beneath the surface.
unfilled fair value gap
beneath the accumulation range lies an unfilled fair value gap (fvg), shown in grey. this price imbalance was left behind during the prior bullish leg and remains a magnet for price action. such gaps often attract price as the market seeks efficiency by mitigating unbalanced areas. the presence of this fvg makes it a likely candidate for a liquidity grab or retest before further bullish continuation.
manipulation setup
the red path outlines a possible short-term manipulation event. this move involves a quick sweep of liquidity beneath the accumulation zone, triggering stop-losses from late long entries and drawing price into the fvg. this is a classic “spring” or “shakeout” scenario designed to trap sellers and create panic, thereby enabling larger players to enter at discounted prices. the manipulation tag here signals a deliberate attempt to create false downside conviction before reversing upward.
re-accumulation and breakout
following the manipulation phase, the green projection shows a sharp reversal and aggressive push upward, initiating a new bullish leg. this move represents re-accumulation, where price quickly exits the range and enters an expansion phase. momentum will likely increase after price breaks back above the original range high, signaling confidence in the trend continuation and drawing in breakout traders. the large green area indicates the expected path toward a new distribution zone.
distribution projection
at the top of the chart, the green box represents a possible future distribution zone. after an extended bullish run, price often enters distribution, where buying interest begins to wane, and larger participants start offloading positions into retail strength. although speculative at this point, its placement reflects the natural progression of a market cycle if the projected bullish move plays out.
market psychology
this chart reflects a clear sequence in market psychology: stealth accumulation, a manufactured dip to create fear (manipulation), followed by a surge fueled by both institutional entries and retail breakout traders. understanding this dynamic helps traders anticipate rather than react, positioning themselves in alignment with likely intent rather than emotional impulses.
summary
the chart outlines a structured bullish scenario with a potential manipulation wick into an unfilled fvg, setting the stage for a continuation higher. if price reacts strongly off the fvg and regains the range, confirmation of bullish intent would be established. this setup emphasizes the importance of understanding liquidity dynamics and price inefficiencies, favoring patient and strategic entries over reactive ones.

NASDAQ - pull back and short continuationBased on volume and last price move I suppose that price is in a pull back until area 18800.
In this area we can find the seller ready to a new push down.
Only if price break the resistence we can have a new long.
Nasdaq - sell area hitNasdaq - sell area hit
We are in sell area.
We can have a new short trend until gap area near support trend dinamic line.

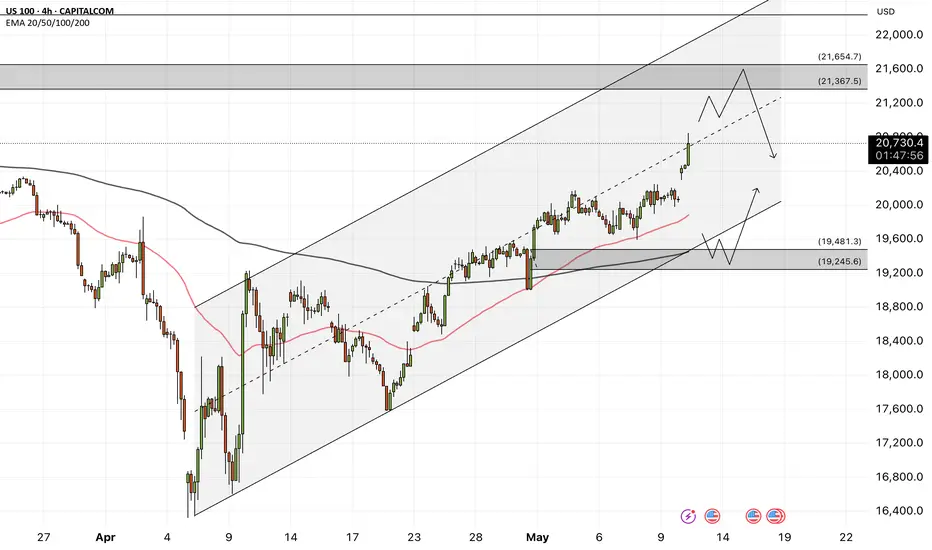
NAS100 - Stock Market Expects a Devastating Week!The index is trading above the EMA200 and EMA50 on the 4-hour timeframe and is trading in its ascending channel. I expect corrective moves from the specified range, but if the index corrects towards the demand range, we can look for the next Nasdaq buy positions with a good risk-reward ratio.
U.S. stock futures responded positively to signals from both Chinese and American officials. Looking ahead to the coming week, investor focus is squarely on the Consumer Price Index (CPI) report from the United States—marking the first chance to assess the impact of the new tariffs implemented on April 9.
Meanwhile, ongoing trade negotiations between the U.S. and China remain a crucial factor, with significant implications for inflation, Federal Reserve policy, and overall market expectations. In addition to inflation data, retail sales figures and the preliminary results of the University of Michigan sentiment survey could influence market outlook regarding interest rates—especially since price stability and full employment remain core mandates of the Federal Reserve. At present, Fed officials are working to maintain a cautious stance in order to anchor inflation expectations. However, if clear signs of economic weakness emerge, that stance could shift rapidly—something that several Fed officials have already openly acknowledged.
Retail sales, in particular, could provide a different narrative about the health of the economy. After a notable 1.5% jump in March, estimates suggest that growth in April slowed to just 0.1%. This deceleration may reflect consumer reluctance to spend, stemming either from inflationary pressures or broader economic uncertainty.
Thursday’s data release will include the Producer Price Index (PPI), industrial production, and the Philadelphia Fed manufacturing index—offering a clearer picture of supply-side dynamics and the performance of the industrial sector.
On Friday, attention will turn to a fresh batch of economic indicators: building permits, housing starts, the New York (Empire State) manufacturing index, and especially the University of Michigan’s preliminary consumer sentiment survey. This survey has gained importance in recent months due to notable increases in both one-year and five-year inflation expectations. As recent charts indicate, while consumer confidence has plummeted to multi-year lows, inflation expectations have trended upward—a worrisome combination that could limit the Fed’s ability to ease monetary policy.
Although concerns about a U.S. recession persist, recent data suggest more of a “gradual slowdown” rather than signs of an imminent crisis. In March, both the CPI and PCE indices declined, indicating a temporary easing of inflationary pressures. However, this trend may reverse in April, as the broad implementation of reciprocal tariffs likely raised import costs—particularly for Chinese goods, which now face duties as high as 145%.
New estimates indicate that these tariffs could add 2.25% to core inflation over the next year, effectively reversing the progress made in 2024 on taming price pressures.Prior to the Trump administration’s tariff announcements, economists had differing views on inflation, with some expecting it to approach the Fed’s 2% annual target by year-end. Contrary to trade experts, Trump claimed that sellers would not pass these price increases on to consumers.
Goldman Sachs’ analysis this week suggests that Trump’s tariffs could push inflation to levels not seen since the post-pandemic price surge. The broad import taxes announced between February and April may have a substantial impact on the economy, and consumers are likely to feel the effects first at the checkout counter. Goldman economists estimate that the tariffs could drive annual inflation—as measured by core Personal Consumption Expenditures (PCE)—to 3.8% by December, marking the highest rate since 2023. The Fed’s preferred inflation gauge rose 2.6% last year.
This metric remains above the Fed’s 2% target and has shown limited progress toward that goal since 2023. The last time inflation was below this benchmark was in January 2021.
A renewed wave of price increases could severely strain American household budgets—particularly if the labor market also weakens, as many economists anticipate. This would also represent a significant setback for the Federal Reserve, which has kept interest rates elevated since 2022 in an effort to combat post-pandemic inflation.
While inflation hovered around 3% at the beginning of 2024 with little change, it saw a notable drop in March. Many analysts forecast that inflation will continue to decline and approach the 2% target by the end of 2025.
Walker and Peng’s analysis factored in both the direct effects of tariffs—most of which will likely be passed on to consumers—and several indirect consequences. The trade war has unexpectedly weakened the U.S. dollar, reducing Americans’ purchasing power.
Moreover, some manufacturers may shift production away from China, where tariffs are particularly severe, to locations with higher production costs. As a result, American consumers may end up paying significantly more for imported goods, especially in categories like consumer electronics and apparel.
CrowdStrike Holdings, Inc. – AI-Native Cybersecurity Powerhouse Company Snapshot:
CrowdStrike NASDAQ:CRWD remains a top-tier cybersecurity leader, redefining endpoint and cloud protection through its AI-powered Falcon platform, securing some of the most critical digital infrastructures in the world.
Key Catalysts:
Falcon Platform – AI-First, Cloud-Native 🧠☁️
Unified security architecture: endpoint, identity, cloud, and data
Leverages real-time analytics, automation, and continuous threat hunting
Widely recognized as a gold standard in modern cybersecurity (GigaOm, Gartner)
Elite Partnerships = Ecosystem Synergy 🤝
Named Google Cloud’s 2025 Security Partner of the Year
Deep collaborations with AWS, Microsoft Azure, and NVIDIA
Embedded in cloud-native DevOps workflows = high stickiness and TAM expansion
AI + Cyber = Next-Gen Growth Tailwind 🚀
Integrating generative AI and autonomous detection to proactively prevent threats
Strategic positioning at the intersection of cloud security and AI operations
Key enabler of Zero Trust architectures for global enterprises
Massive Market Opportunity 🌍
Global cyber budgets rising amid escalating threats
CrowdStrike well-positioned for land-and-expand growth via Falcon modules
Expanding presence in identity protection, XDR, and managed services
Financial Edge:
Consistent 30%+ YoY revenue growth
High gross margins (~77%)
Strong free cash flow generation, underpinning long-term profitability
📈 Investment Outlook
✅ Bullish Above: $370.00–$375.00
🚀 Upside Target: $600.00–$620.00
🎯 Thesis: Platform leverage, elite partnerships, and AI innovation make CrowdStrike a core cybersecurity growth leader for the AI era.
#CrowdStrike #Cybersecurity #AI #CRWD #FalconPlatform #CloudSecurity #NextGenTech

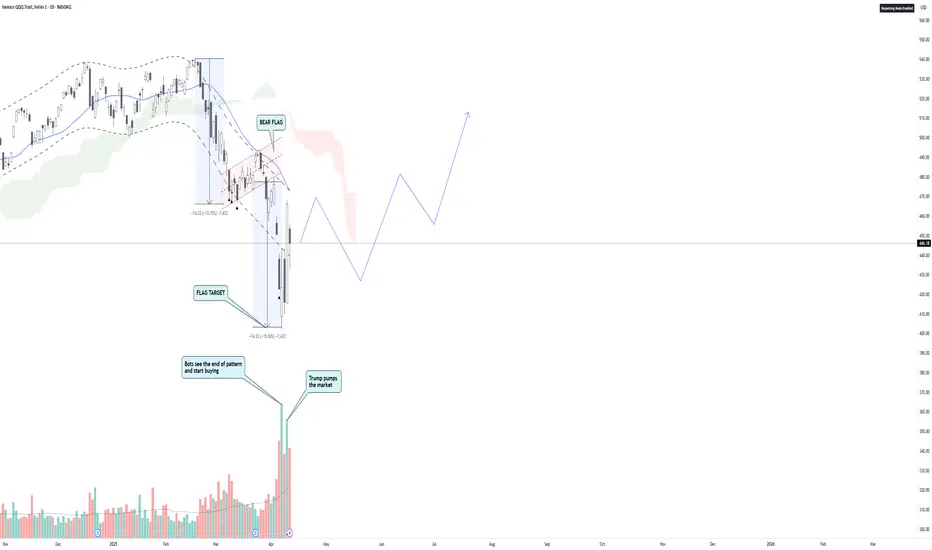
Worst is behind for QQQ and SPXA textbook Bear flag with proper breakdown and reached the target.
Now the market is ranging to decide where to go. Whatever the price action will be, there will be suitable news on TV afterwards don't worry.
Looking purely at the charts, QQQ should recover between 488-510 area.
The two big volume days at the end of the pattern target convinced me we are on the way up for now, whether its a trap or not remains to be seen.
Cheers
Weekly Market Forecast: Wait For BUYS! Stock Indices and GoldIn this Weekly Market Forecast, we will analyze the S&P 500, NASDAQ, DOW JONES, Gold and Silver futures, for the week of May12 - 16th.
The Stock Indices were sluggish last week, holding at support. Wait for a market structure shift to the upside to confirm buys.
Gold and Silver may move higher, as India and Pakistan, Gaza and Ukraine are increasingly troublesome.
CPI Data on Tuesday. This could be a strong market mover.
Enjoy!
May profits be upon you.
Leave any questions or comments in the comment section.
I appreciate any feedback from my viewers!
Like and/or subscribe if you want more accurate analysis.
Thank you so much!
Disclaimer:
I do not provide personal investment advice and I am not a qualified licensed investment advisor.
All information found here, including any ideas, opinions, views, predictions, forecasts, commentaries, suggestions, expressed or implied herein, are for informational, entertainment or educational purposes only and should not be construed as personal investment advice. While the information provided is believed to be accurate, it may include errors or inaccuracies.
I will not and cannot be held liable for any actions you take as a result of anything you read here.
Conduct your own due diligence, or consult a licensed financial advisor or broker before making any and all investment decisions. Any investments, trades, speculations, or decisions made on the basis of any information found on this channel, expressed or implied herein, are committed at your own risk, financial or otherwise.

#202519 - priceactiontds - weekly update - nasdaqGood Day and I hope you are well.
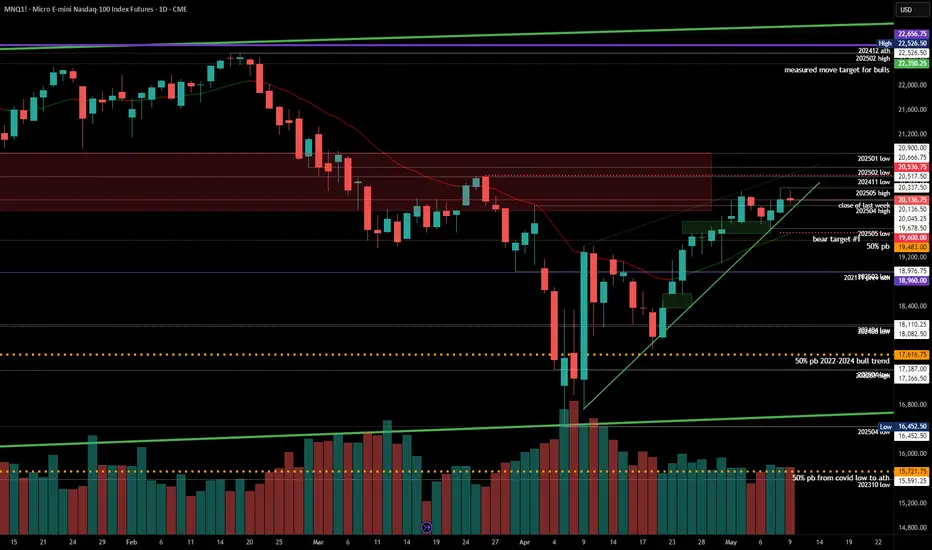
comment: Not much changed last week so I do not change much of what I wrote then. Bulls want at least 20536 now and run all the stops from before the big sell-off. Bears are not doing anything at all, so bulls will likely get it. This could be a breakout-retest and I marked the area for that with the red rectangle. Small chance bears come around next week but for now it’s still too early to short. The bull wedge is about to break out over the next 1-2 days and if bulls stay above 19600, we should expect higher prices.
current market cycle: trading range
key levels for next week: 19000 - 21000
bull case: 20536 and then 21000. Those are the next targets and bulls are in full control of the market. The measured move from the buy spike at the lows is around 22350 and it’s possible that we get there. I think we need to see a pullback and how deep that will be. If we get only another sell spike and immediate buying for higher highs, we can also assume much higher prices. Above 21100 there is no reason not to go for 23000. Nothing of this changed to last week. Bulls preventing the bears from getting any decent pullback, which is uber bullish.
Invalidation is below 19100.
bear case: Problem for the bulls is, that we have not closed above the weekly 20ema for two weeks now and bears defending the prior lower high 20536. That was and will be my line in the sand next week. Gap close to it, we have no reason not to print a new ath but below19600 I think more bulls will give up, depending on the strength of the selling. As of now, nothing about the chart is bearish but one decent down day > -2% could change that.
Invalidation is above 20620ish.
short term: Neutral. Market went nowhere and trading on hope and fairy dust is not my thing. I wait.
medium-long term - Update from 2024-05-11: My most bearish target for 2025 was 17500ish. Now I assume we will be in a trading range 16000 - 23000 for much longer. Same update as for dax, I guess we could go down and sideways over the next weeks/months and then have another squeeze into year end. Stairs up, elevator down.
nas100 next move? 📈 NAS100 Market Update
NAS100 is currently trading around 19,500 and is forming a running flat wave pattern.
This structure is setting up for a potential move towards the 20,000 target.
Stay alert — the breakout could be strong!