NQ Analysis - 11th May 2025Here is my analysis of NQ, a pair I do not trade and only very seldomly do analysis for.
I've been wanting to get into indices futures, so I will be doing more analysis on them in the future. I still have to learn about the contract sizes, average moves, etc.
- R2F Trading
Nasdaq

Will gold reach an all-time high?Gold (XAU/USD) Market Analysis
Trend Environment
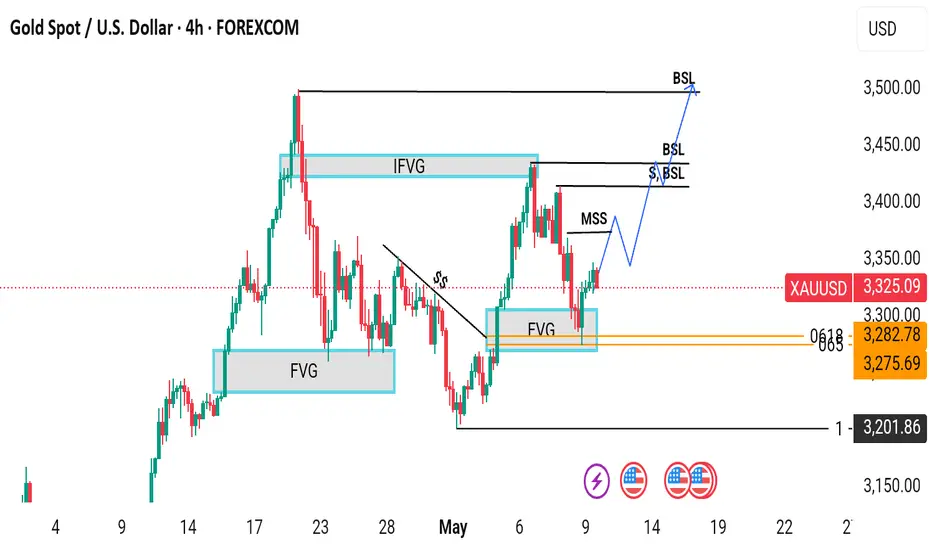
The 4-hour chart of Gold (XAU/USD) from OANDA illustrates a strong impulsive structure within a broader bullish trend. Following a sharp upward movement that broke through previous structure, gold formed a swing high before entering a corrective phase. The market has since pulled back and appears to be stabilizing near a zone of high confluence, suggesting potential for a renewed move to the upside.
Key Levels
Support Zone 3,280-3,300 region, characterized by a fair value gap and Fibonacci golden pocket zone (0.618-0.65 retracement levels).
Potential Targets Higher lows and break of structure above recent swing highs, with buy-side liquidity levels (BSL) marking areas where buy stops are likely to be clustered.
Technical Confluence
The alignment of the fair value gap and Fibonacci retracement levels in the 3,280-3,300 region increases the likelihood of price reacting positively. Fair value gaps represent inefficiencies in the market caused by strong institutional participation, while the golden pocket is historically known for acting as a magnet for reversals within trending markets.
Bullish Scenario
The chart projects a potential bullish continuation move, with a series of higher lows anticipated to form en route to a break of structure above recent swing highs. A methodical stair-step advance is expected, respecting interim levels before ultimately attempting to reach the prior high near 3,530.
Strategic Framework
This analysis offers a methodical roadmap for bullish continuation, rooted in the smart money framework of liquidity, inefficiency, and institutional order flow. The confluence between the fair value gap and Fibonacci retracement serves as a key validation area for bullish traders. By understanding the technical and institutional drivers of the market, traders can better navigate the complexities of the gold market and identify potential opportunities for growth.
SPY weekly thoughts for May 12th - 16th. Trump Pump?What’s up traders — this is my first idea post here on TradingView, and I’m hyped to finally share something with the community. In this breakdown, I’ll be covering a few key areas I’m watching:
🟩 Support zones
📉 Resistance levels
🕯️ Weekly candle behaviour
🌍 Macro outlook and possible catalysts
📌 Important notes
⚠️ My current bias
Let’s jump in:
🟩 Support Zones:
Buyers are still showing up strong in that $505–$507 range(I highly doubt their orders will get filled lol). it had been a reliable bounce zone — we’ve seen repeated wicks rejecting that level and price snapping back VERY quickly.
Above that, $550 has developed into a new area of support, and right now that’s my main level to watch. If that gives out, I expect we’ll head back down to test the $507 zone again. But for now, bulls are doing their job.
📉 Resistance
SPY keeps getting stuck around $573–$575. That zone’s been tested a few times now, but buyers haven’t been able to push it through. Sellers are stepping in there almost every time.
🕯️ Weekly Candle Context
That’s three straight weekly closes below resistance. Bulls get some momentum mid-week, but by Friday, sellers take over. It’s showing signs of a stall — like the market’s running out of gas near the top.
🌍 Macro Outlook – What Could Move Things
There’s been some talk of softer trade discussions and early negotiations with China. If any of that turns into a real deal, it could be the spark SPY needs to finally break above resistance.
But on the flip side — if Trump starts pushing new tariffs (even smaller ones), those moves tend to hold stocks back, especially in tech.
So the big question is:
Can SPY hit new highs if tech keeps cooling off and there’s pressure from new trade policy?
That’s the tug-of-war right now — possible upside from improving global relations, but real downside risk from political decisions.
📌 Things I’m Watching:
A weekly close above $575 would shift me to a bullish bias.
If we lose $550, I’ll be watching closely to see how price behaves near $507.
⚠️ Current Bias
Right now I’m FAIRLY neutral with a slight bullish lean, but very excited for this next weekly candle.
The macro setup looks like it could support a move higher, but I’m staying decently cautious until we get a clear weekly breakout(+575) and close above resistance.
Let me know what you think — and if you’re watching the same levels.

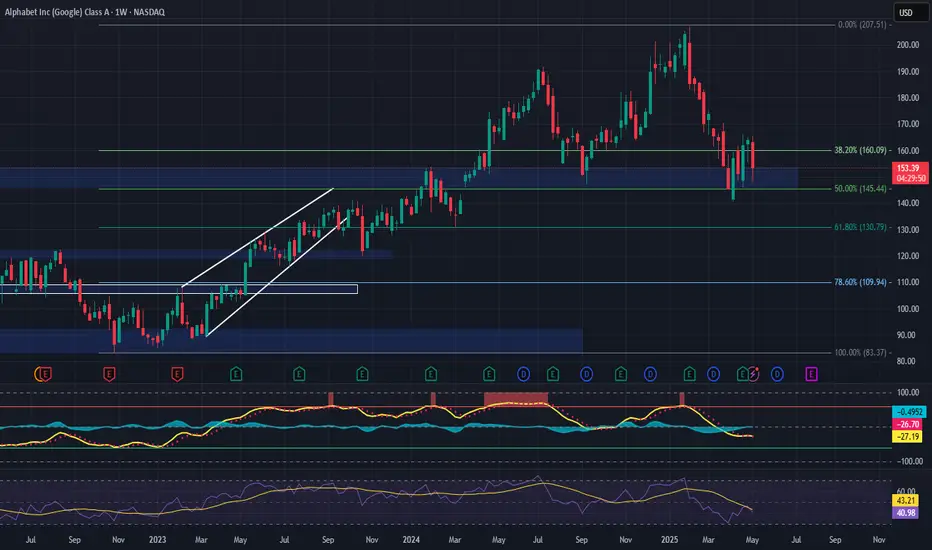
GOOGL (Alphabet Inc.) – Medium-Term Position Trade SetupNASDAQ:GOOGL is showing strength as it revisits its previous all-time high, now aligning with the 50% Fibonacci retracement of the current wave. The price action suggests a bullish flip of resistance into support at the $153 zone, with clear signs of buyer defense—offering a compelling medium-term opportunity.
🔹 Entry Zone:
Around $153 (support zone)
🎯 Take Profit Targets:
🥇 $200
🥈 $230
🛑 Stop Loss:
Weekly close below $130
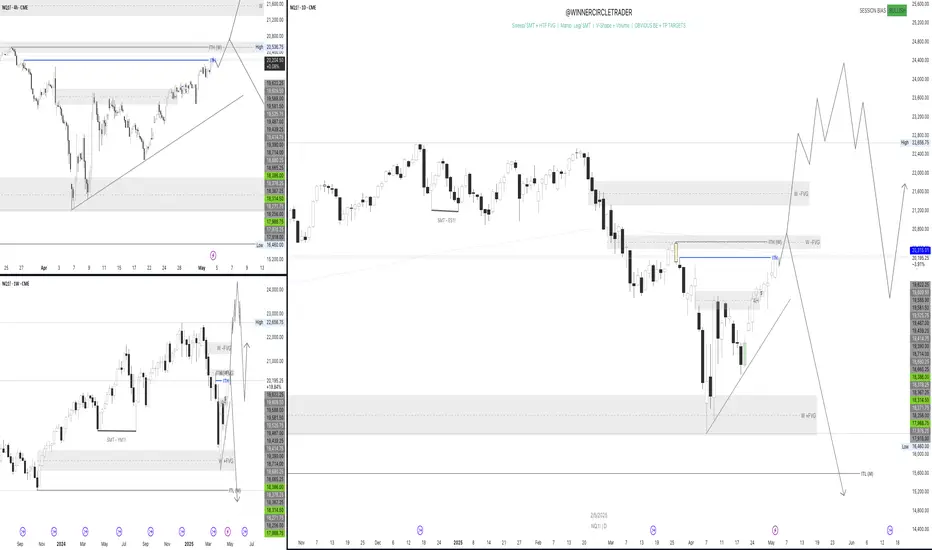
$NQ Elliott Wave Analysis NASDAQ Elliott Wave Price Analysis
SEED_ALEXDRAYM_SHORTINTEREST2:NQ CME_MINI:NQ1! Expecting Price Rejects big time around $21964
Targets
First - 19362
Final Target 17525
Expecting price top around mid December

NQ1! "E-Mini Nasdaq 100" Index Market Bullish Robbery Plan🌟Hi! Hola! Ola! Bonjour! Hallo! Marhaba!🌟
Dear Money Makers & Robbers, 🤑 💰💸✈️
Based on 🔥Thief Trading style technical and fundamental analysis🔥, here is our master plan to heist the NQ1! "E-Mini Nasdaq 100" Index Market. Please adhere to the strategy I've outlined in the chart, which emphasizes long entry. Our aim is to escape near the high-risk Red Zone Level. Risky level, overbought market, consolidation, trend reversal, trap at the level where traders and bearish robbers are stronger. 🏆💸"Take profit and treat yourself, traders. You deserve it!💪🏆🎉
Entry 📈 : "The heist is on! Wait for the MA line breakout (20500.00) then make your move - Bullish profits await!"
however I advise to Place Buy stop orders above the Moving average (or) Place buy limit orders within a 15 or 30 minute timeframe most recent or swing, low or high level for Pullback entries.
📌I strongly advise you to set an "alert (Alarm)" on your chart so you can see when the breakout entry occurs.
Stop Loss 🛑: "🔊 Yo, listen up! 🗣️ If you're lookin' to get in on a buy stop order, don't even think about settin' that stop loss till after the breakout 🚀. You feel me? Now, if you're smart, you'll place that stop loss where I told you to 📍, but if you're a rebel, you can put it wherever you like 🤪 - just don't say I didn't warn you ⚠️. You're playin' with fire 🔥, and it's your risk, not mine 👊."
📍 Thief SL placed at the recent/swing low level Using the 4H timeframe (19600.00) Day/Swing trade basis.
📍 SL is based on your risk of the trade, lot size and how many multiple orders you have to take.
🏴☠️Target 🎯: 21500.00 (or) Escape Before the Target.
🧲Scalpers, take note 👀 : only scalp on the Long side. If you have a lot of money, you can go straight away; if not, you can join swing traders and carry out the robbery plan. Use trailing SL to safeguard your money 💰.
💰💵💸NQ1! "E-Mini Nasdaq 100" Index Market Heist (Swing Trade Plan) is currently experiencing a neutral trend there is high chance for bullishness,., driven by several key factors. .☝☝☝
📰🗞️Get & Read the Fundamental, Macro economics, COT Report, Geopolitical and News Analysis, Sentimental Outlook, Intermarket Analysis, Index-Specific Analysis, Positioning and future trend targets with Overall Score..... go ahead to check👉👉👉🔗🔗🌎🌏🗺
⚠️Trading Alert : News Releases and Position Management 📰 🗞️ 🚫🚏
As a reminder, news releases can have a significant impact on market prices and volatility. To minimize potential losses and protect your running positions,
we recommend the following:
Avoid taking new trades during news releases
Use trailing stop-loss orders to protect your running positions and lock in profits
💖Supporting our robbery plan 💥Hit the Boost Button💥 will enable us to effortlessly make and steal money 💰💵. Boost the strength of our robbery team. Every day in this market make money with ease by using the Thief Trading Style.🏆💪🤝❤️🎉🚀
I'll see you soon with another heist plan, so stay tuned 🤑🐱👤🤗🤩

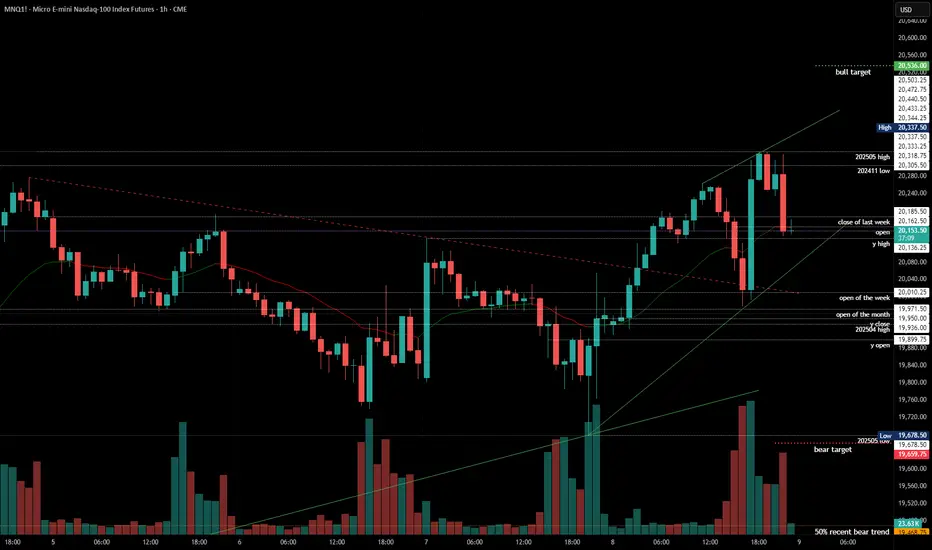
2025-05-08 - priceactiontds - daily update - nasdaqGood Evening and I hope you are well.
comment: Market closed where it opened, after the early rally from Globex to mid EU session and then another one after the US open bear trap. I could not believe that bulls would do another strong move up after such a rejection above 20250 but meh. Can they really do another tomorrow after yet another strong rejection? Until bears print lower lows, the answer is "probably”. Clear bull wedge and bears need to break below 19970 for more downside. If we stay above 20100 we can do higher highs until we ultimately hit 20536 or higher.
current market cycle: trading range
key levels: 19700 - 20600
bull case: Bulls printed two amazing rallies and they we not enough to make meaningful higher highs and accelerate upwards. Usually that price action would have been enough for more bears to give up but once market began to stall on new highs, bulls vanished and bears overwhelmed them. I don’t have much for the bulls tbh. 5 tries and they are still failing.
Invalidation is below 19100.
bear case: Bears need to break the bull wedge and print below 19970. That’s about it. The rejections from new highs are good but the follow-through is trash. Going below 19600 into the weekend is me next wet dream.
Invalidation is above 20400.
short term: Neutral. Bulls grinding but for how many more tries? If that is bad English, you can do you.
medium-long term - Update from 2024-04-20: My most bearish target for 2025 was 17500ish, given in my year-end special. We are +18% from the lows and I do think, once this turns again, it will easily be the short trade of the year.
trade of the day: Shorting new highs continues to print money.
NASDAQ 2m Chart PO3 Acc, Manip Dist - Last Hour Party?Even though today has been crazy think a little sanity has setup for a classic ICT AMD play.
As of writing this we are in Accumulation. Watch for what appears to be a run higher, that gets hammered.
The last hour of the trading day on the 2m chart crosses above the 75 SMA, maybe it's pump time?
Check it out, gimmi feedback.
Thanks!
Craig

AAPL – Long Trade Setup (Support-Based Reversal Opportunity)Apple (AAPL) is pulling back toward a key support zone between $197–$198, aligning with both previous structural support and potential demand zone behavior. This setup offers a favorable risk-to-reward profile for a swing long entry.
🔹 Entry Zone:
$197 – $198
🎯 Take Profit Targets:
🥇 $210 – $215
🥈 $225 – $233
🛑 Stop Loss:
Just below $190

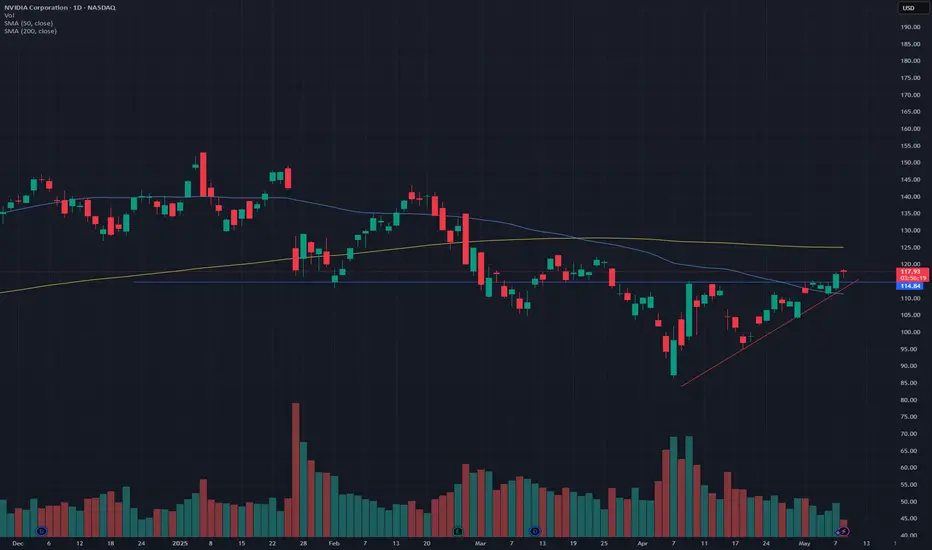
NVIDIA: Breakout above ascending triangle, retest confirmationNVDA has been forming an ascending triangle over the past few weeks, with declining volume. Finally, it broke out yesterday, and today, we had a retest of the resistance line. NVDA was down about 1% earlier today however after a successful retest of the resistance line, it is now up 0.8% at the time of writing.
In terms of support, it seems the price has successfully bounced off the 50-Day SMA line. While an ascending triangle is bullish, the 200-Day SMA is likely going to be a point of resistance (around $125).
This is amid the renewed overall market strength and the news related to the reduced limitations of exporting AI chips - which is contributing to the momentum.
Please note: Not financial advice.
Weekly Forecasts UPDATES! ALL Markets Analyzed! Stocks & FOREXIn this Weekly Forecast UPDATE, we will analyze the S&P 500, NASDAQ, DOW JONES, Gold and Metals futures, and the FOREX Majors for Thursday, May 8th.
The targets set in last weekend's forecasts are still in play! Trade accordingly.
Enjoy!
May profits be upon you.
Leave any questions or comments in the comment section.
I appreciate any feedback from my viewers!
Like and/or subscribe if you want more accurate analysis.
Thank you so much!
Disclaimer:
I do not provide personal investment advice and I am not a qualified licensed investment advisor.
All information found here, including any ideas, opinions, views, predictions, forecasts, commentaries, suggestions, expressed or implied herein, are for informational, entertainment or educational purposes only and should not be construed as personal investment advice. While the information provided is believed to be accurate, it may include errors or inaccuracies.
I will not and cannot be held liable for any actions you take as a result of anything you read here.
Conduct your own due diligence, or consult a licensed financial advisor or broker before making any and all investment decisions. Any investments, trades, speculations, or decisions made on the basis of any information found on this channel, expressed or implied herein, are committed at your own risk, financial or otherwise.

NASDAQ 100 Elliott Wave Update – Wave (5) in Play?CME_MINI:NQ1!
📊 NASDAQ 100 E-mini Futures – Elliott Wave Analysis
🗓️ Weekly Chart – April 2025
The NASDAQ 100 appears to have completed an ABC corrective pattern, marking the end of wave (4). A bullish move toward wave (5) is now projected, with a potential target zone highlighted in yellow:
🎯 Target 1: 32,291 (100% extension)
🎯 Target 2: 38,678 (127% extension)
This zone marks the Fibonacci projection for the fifth wave, based on the Elliott Wave principle. The bullish structure remains valid as long as the key support at 16,551 holds.
🔎 Key things to watch:
Confirmation of a reversal at wave (C) low
Increasing volume on upward moves
Momentum indicators like RSI / MACD

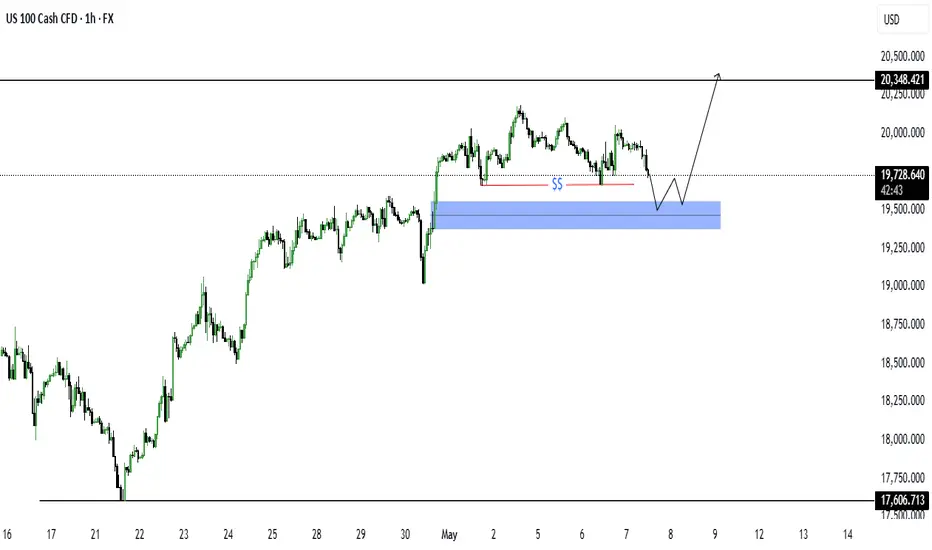
NASDAQ (NDX) Market OutlookCurrently, the NASDAQ is trading around 19,723. We're anticipating a short-term pullback toward the 19,462 level, where a significant pool of liquidity awaits. This zone could act as a magnet for price in the near term. Once price reaches this area, we’ll closely monitor the lower timeframes for a potential bullish reaction or accumulation, which could signal the next leg higher.
Stay patient and let price confirm at key levels.
Nasdaq - Printing The Obvious Bottom!Nasdaq ( TVC:NDQ ) already finished the correction:
Click chart above to see the detailed analysis👆🏻
After we witnessed a minor "crash" of about -25% over the past couple of weeks, the bottom might be in on the Nasdaq. We simply saw another very bullish all time high break and retest and depite the possibility of a second retest, I am (still) extremely bullish at these levels.
Levels to watch: $17.000
Keep your long term vision,
Philip (BasicTrading)

NASDAQ: Rebounding on the 4H MA50. New High for the Channel Up.Nasdaq is marginally bullish on its 1D technical outlook (RSI = 56.883, MACD = 127.320, ADX = 37.197) and is rebounding today on the 4H MA50, right before the HL of the Channel Up. This is a technical bottom that calls for a buy. We aim for a new +6% bullish wave (TP = 20,800).
## If you like our free content follow our profile to get more daily ideas. ##
## Comments and likes are greatly appreciated. ##

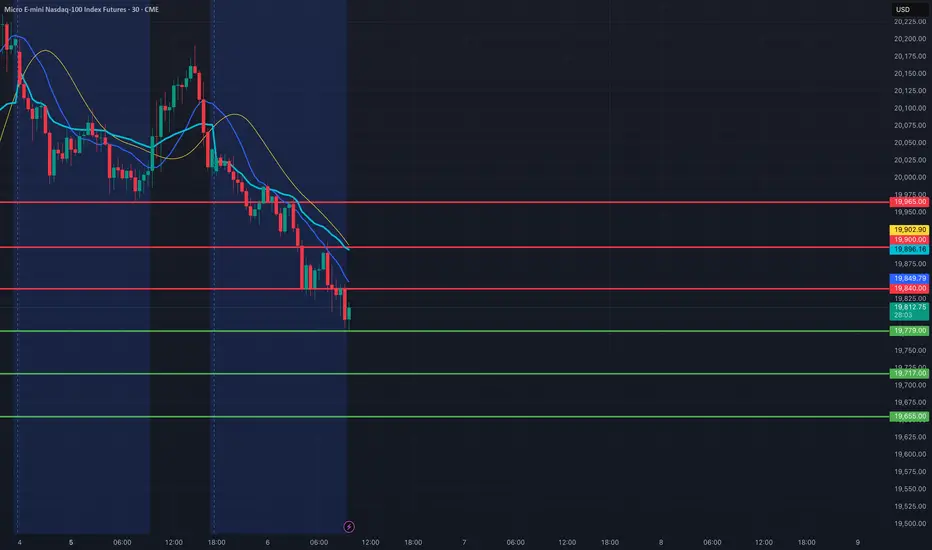
MNQ1!/NQ1! Day Trade Plan for 05/06/2025MNQ1!/NQ1! Day Trade Plan for 05/06/2025
📈 19840 19900 19965
📉 19779 19717 19655
Thanks to all my followers! Truly appreciate the support!
Please like and share for more ES/NQ levels Tues & Thurs 🤓📈📉🎯💰
*These levels are derived from comprehensive backtesting and research and a quantitative system demonstrating high accuracy. This statistical foundation suggests that price movements are likely to exceed initial estimates.*
Will NASDAQ Continue Its Climb? Here's my Trade Plan.📈 NASDAQ 100 (NAS100) Technical & Price Action Outlook 💡🚀
The NASDAQ has been in a strong bullish trend, driven by optimism around interest rates, tech earnings, and positive momentum. 📰💻 While price has pushed up aggressively, it’s now trading near key highs and buy-side liquidity zones—a spot where I’m anticipating a possible pullback. 🔁💰
I’m watching closely for a retracement into the 50% Fibonacci zone—my point of interest for a potential long setup. 🎯📐 However, I’ll only consider entering if price breaks structure bullish (BoS) after the pullback. 📊🧠
The index is still recovering from earlier 2025 losses, and resistance lies just ahead—so risk management is key. 🧘♂️⚠️
Not financial advice.

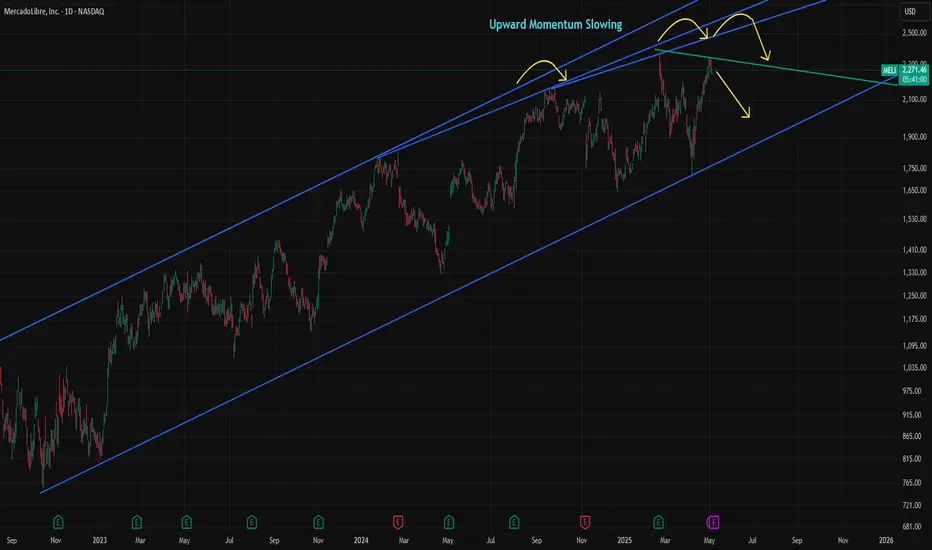
MELI at Risk from Momentum Shift and High ValuationMELI has gained over 35% since the April dip, but momentum has been fading since September. The slowdown has become increasingly visible, and last week's high may remain the top for some time unless Wednesday’s earnings report surprises the market on the upside.
The consensus estimate for MELI’s revenue is $5,497.05 million, representing a 26.86% year-over-year increase but a 9.27% decline quarter-over-quarter. MELI is currently trading at a forward P/E of 41.9x, which is significantly higher than the 19.8x average of comparable companies. Its geographic advantage over U.S.-based peers gave MELI an edge in April, but without strong earnings to support the high valuation, the stock could become vulnerable.
Over the past five years, MELI averaged 56.2% annual sales growth. That figure is expected to fall to an average of 22.1% over the next three years, which remains solid but signals a clear deceleration.
MELI could move more than 7% on earnings day, depending on the report. If the stock falls below 2,000, it may present a buying opportunity. However, the loss of momentum is usually a negative signal for sustaining trends, so the risk of buying the dip is higher than before.
Nasdaq: The Rally Continues!The Nasdaq ended last week with strong upward momentum, moving swiftly toward the resistance at 20,694 points. Now it's getting interesting: once the index breaks above this mark, it should quickly enter our upper turquoise Target Zone (coordinates: 21,751 – 22,425 points), where we expect the peak of wave X in turquoise. Afterward, we anticipate a pullback during wave Y, which should aim for our lower turquoise Target Zone (coordinates: 17,074 – 15,867 points). The corrective magenta wave (4) should be completed there. However, if the Nasdaq directly surpasses the significant resistance at 23,229 points, our alternative scenario will take effect. In this 35% likely case, we would consider wave alt.(4) as already complete and locate the index in the impulsive wave alt.(5) .

My NQ Long Idea 5/5/2025Been a while but I haven't been posting ideas because I have been scalping and doing smaller time frame trades. I think we have NQ at a nice price level where we might see a bull run soon with the market sentiment slowly "thawing" on the idea of "risk-off" sentiment to "risk-on" sentiment and environment with more uncertainties clearing out of the market scenes.
We have US trying to negotiate deals with many countries including China which is very challenging and we can never know if it will be achieved or not. However, from an economic point of view we can agree that the US economy is in the Neutral-bullish. We have a very bullish price action in the past week or so. We also have healthy economic numbers but it is still unclear until Wednesday.
On Wednesday the FED will speak on this matter and give us some clarity on whether it is a Risk-on or Risk-off environment. Anything will happen but I can see the "Gap" getting filled on FED day due to the SPIKE that will be delivered to us.
Currently Edgefinder tool is giving us 8 for NQ with only the GDP and sPMI scores in the negative. However the net score is bullish and on the positive.
I think 1 of those two ideas will be played out sooner or later anything can happen but from a technical view I would like to see the price reaching the 50% FIB and then take off from there.
It is subjective though and everything in trading is subjective including what I do and say.

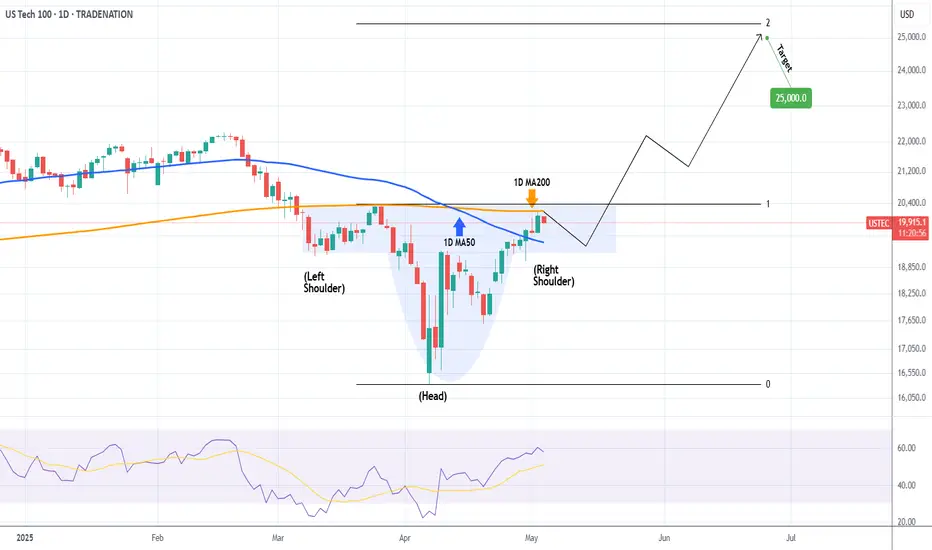
NASDAQ's Inverse H&S that targets $25000Nasdaq (NDX) is forming the Right Shoulder of a potential Inverse Head and Shoulders (IH&S) pattern. The price action is 'stuck' within the 1D MA200 (orange trend-line), which got tested on Friday for the first time since March, and the 1D MA50 (blue trend-line).
Since the 1D MA200 was the level that initiated the March 26 rejection, it is possible to see a short-term pull-back now, all in the process of forming the Right Shoulder and after the market digests the new Fed Rate Decision, starts the next Leg Up. Note that the 1D RSI is already on its February highs.
As a result, our long-term Target is at 25000, just below the 2.0 Fibonacci extension level, which is a standard technical target for IH&S patterns.
-------------------------------------------------------------------------------
** Please LIKE 👍, FOLLOW ✅, SHARE 🙌 and COMMENT ✍ if you enjoy this idea! Also share your ideas and charts in the comments section below! This is best way to keep it relevant, support us, keep the content here free and allow the idea to reach as many people as possible. **
-------------------------------------------------------------------------------
Disclosure: I am part of Trade Nation's Influencer program and receive a monthly fee for using their TradingView charts in my analysis.
💸💸💸💸💸💸
👇 👇 👇 👇 👇 👇
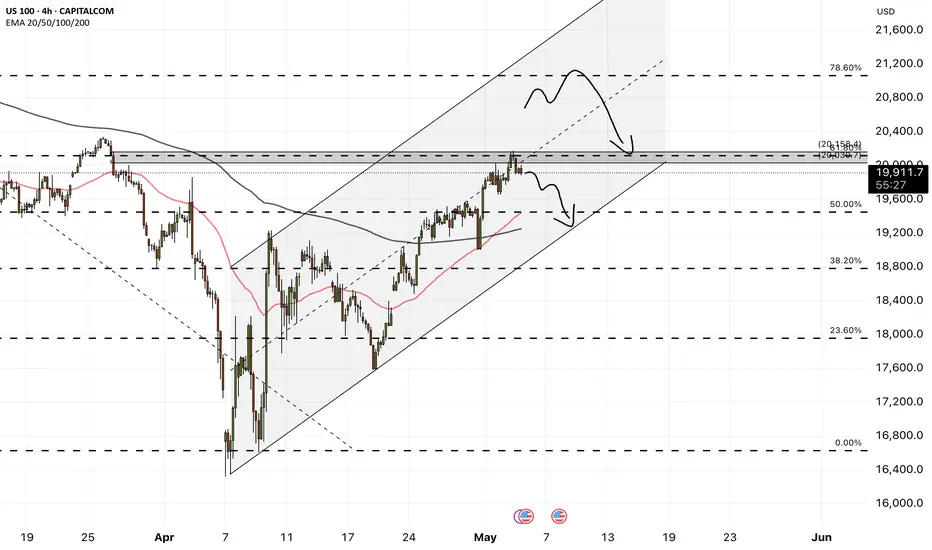
NAS100 - Stock Market, Waiting for FOMC?!The index is above the EMA200 and EMA50 on the 4-hour timeframe and is trading in its ascending channel. I expect corrective moves from the specified range, but if the index continues to move upwards towards 21,000 points, we can look for the next Nasdaq short positions with a risk-reward ratio.
Last week, U.S. equity markets experienced $8.9 billion in capital outflows, while equity markets in Japan and the European Union saw net inflows. Additionally, U.S. Treasury bonds recorded an outflow of $4.5 billion—the largest since December 2023. Meanwhile, the gold market witnessed its first weekly investment decline since January.
Looking ahead, financial markets are focused on the upcoming earnings reports from major companies across sectors such as technology, healthcare, automotive, energy, and financial services. These reports are expected to significantly influence equity trends, investment strategies, and corporate outlooks. Below is a daily breakdown of key companies set to release earnings this week:
Monday, May 5, 2025
The week starts with a focus on the healthcare and biotech sectors:
• Before market open: Companies such as Palantir, Ford, Onsemi, and Tyson Foods will report earnings. Palantir and Ford are particularly noteworthy for investors in the tech and auto sectors.
• After market close: Healthcare firms like Hims & Hers Health, Axsome Therapeutics, and financial company CNA Financial will report.
Tuesday, May 6, 2025
Tuesday highlights several key tech earnings:
• Before market open: Celsius, Datadog, Rivian, and Tempus will publish their results. Rivian’s report is especially anticipated due to the intense competition in the electric vehicle space.
• After market close: Tech giants like AMD and Arista Networks will release earnings, along with Marriott from the hospitality sector.
Wednesday, May 7, 2025
A packed day for earnings reports:
• Before market open: Reports from Uber and Teva are expected, along with ARM Holdings, a key player in semiconductors.
• After market close: AppLovin, Unity, and Robinhood will release their reports—representing digital gaming, software, and fintech respectively.
Thursday, May 8, 2025
This day centers on digital health, cryptocurrency, and e-commerce:
• Before market open: Peloton and Shopify will report. Shopify’s performance is particularly critical in the online retail sector.
• After market close: Crypto firm Coinbase and online sports betting platform DraftKings are in focus.
Friday, May 9, 2025
Fewer companies will report, but some are of strategic interest:
• Firms like 1stdibs, Ani Pharmaceuticals, and Embecta are scheduled, as well as Telos and Algonquin—key names in energy and cybersecurity investing.
This week, markets are closely monitoring Wednesday’s FOMC meeting. At the March session, the Fed left rates unchanged and signaled only two potential cuts totaling 50 basis points for the year, based on its dot plot—suggesting a cautious approach to monetary easing.
Simultaneously, April’s U.S. Services PMI is set to be released today, providing clearer insights into post-tariff business activity.
Amazon’s CEO stated that, so far, there is no indication of reduced demand due to tariff concerns. Some inventory spikes were noted in specific categories, likely driven by stockpiling ahead of tariff implementation. Retail prices, on average, have not significantly increased, and most sellers have yet to raise prices—though that could change depending on how tariff policies evolve. Notably, essential goods have grown at twice the rate of other categories and now account for a third of all unit sales in the U.S.
Following April’s jobs report, the likelihood of a Fed rate cut in June dropped from 75% to 42%. With only one more employment report due before the June 18 meeting, hopes for an early policy shift have faded. Some analysts argue that without the tariff conflict, the Fed might already be cutting rates, given the downward trend in inflation, steady growth, and Congressional focus on fiscal measures.
The April jobs data showed that the U.S. labor market remains resilient—neither too strong to spark inflation fears nor too weak to trigger panic. After the release, with market confidence rebounding, Goldman Sachs forecasted the Fed’s first rate cut to come at the July 30 meeting.
The consensus expectation is for the Fed funds rate to remain in the current 4.25%-4.5% range, unchanged since January. The CME FedWatch tool currently assigns just a 1.8% chance of a rate cut at the upcoming meeting.
Economists warn that Trump’s newly imposed tariffs—active since April—could drive up prices and hurt employment, challenging the Fed’s dual mandate of controlling both inflation and joblessness. However, recent data shows inflation remained mild in March and the labor market held steady in April.
Nancy Vanden Houten, Chief U.S. Economist at Oxford Economics, wrote: “The data is strong enough for the Fed to stay on the sidelines and monitor how tariffs influence inflation and expectations.” While hard data remains stable, forecasts and sentiment surveys signal looming challenges. Business leaders and individuals express concern that rising costs may burden consumers and businesses in the coming months or years, possibly even tipping the economy into recession.
Bullish till March 26 High but open for retrace.We are at a daily -BPR at the moment. All daily candles have been bullish so far since April 22. The whole sentiment behind this has been the 90 day tariff pause.
There definitely is a mix of fundamental and technical reasons for both bullish and bearish bias once we achieve this target.
For this week, I would look for a long entry only if NQ retraces lower first. Otherwise would have to just watch it do its thing. Once we hit the March 26 High, I am very open for NQ to go to All time high again because that is what it historically does but I am also completely open for it to start dumping to monthly lows because it seems that the sell-side was not hit and the higher lows made on the 4H chart seem to be very low resistance targets.
Not a good time to marry a bias.