#202518 - priceactiontds - weekly update - nasdaqGood Evening and I hope you are well.
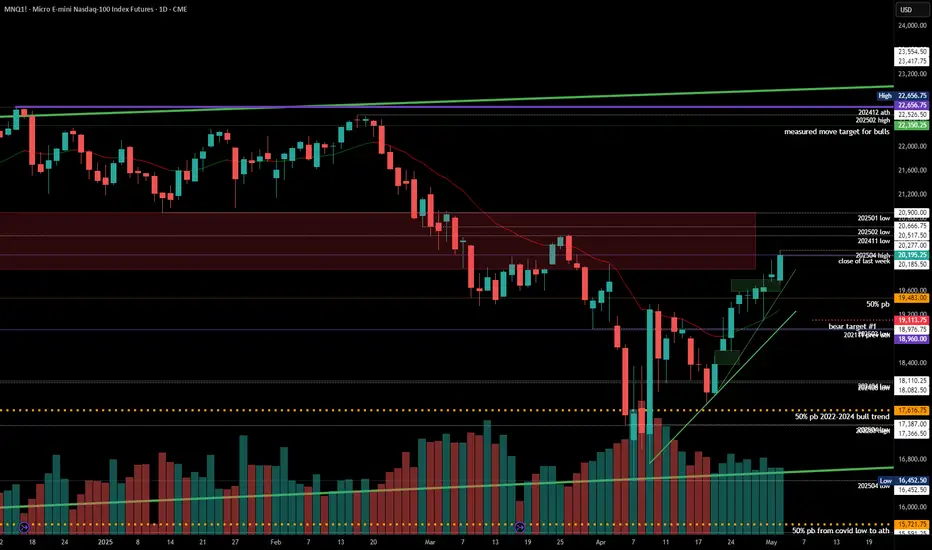
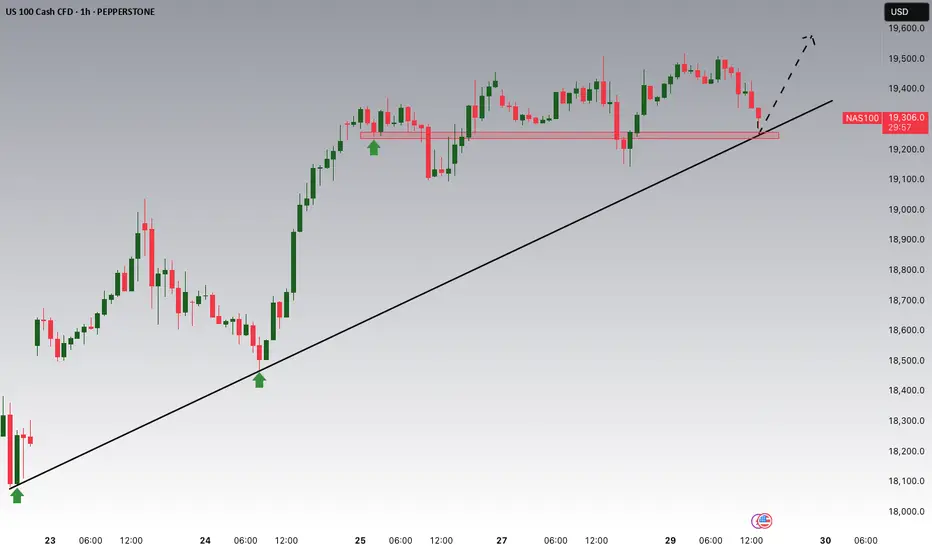
comment: Bulls want at least 20536 now and run all the stops from before the big sell-off. Bears are not doing anything at all, so bulls will likely get it. This could be a breakout-retest and I marked the area for that with the red rectangle. Small chance bears come around next week but for now it’s too early to short and buying into 9 consecutive bull days is statistically beyond moronic.
current market cycle: trading range
key levels: 15500 - 23000 (upper range is a guess, could also become 21000 but for now we don’t know so I assume the higher price)
bull case: 20536 and then 21000. Those are the next targets and bulls are in full control of the market. The measured move from the buy spike at the lows is around 22350 and it’s possible that we get there. I think we need to see a pullback and how deep that will be. If we get only another sell spike and immediate buying for higher highs, we can also assume much higher prices. Above 21100 there is no reason not to go for 23000.
Invalidation is below 19100.
bear case: Bears have nothing. Below 19100 market is neutral but until then, selling this is dumb. Wait for more bears to appear or at least seeing something that resembles a topping pattern. Like a lower high on the 1h chart. Don’t try to be the lucky bear who shorted the exact high.
Invalidation is above 21100.
short term: Neutral. No interest in buying such a buy climax but it’s way too early for shorts. Patience is key.
medium-long term - Update from 2024-04-26: My most bearish target for 2025 was 17500ish. Now I assume we will be in a trading range 16000 - 23000 for much longer.
Nasdaq
GOLD Weekly Outlook 1st week of May 2025 COMEX:GC1!
Expecting another displacement towards the downside on Gold on a weekly fractal. Perfectly lined up with daily and weekly internals

WEEKLY ANALYSIS TO HELP YOUR TRADING: Nasdaq, NQ, NAS100A pretty accurate week from my last video analysis if I do say so myself.
This week, I'm anticipating more bullish price action, however, there's also a strong chance for an inside bar which could have price working within last week's trading range. Based on the levels discussed in this video, price has reason to try and close bullish yet again, so I'll be watching price action for entries into longs and managing my risk accordingly.
Happy Trading,
The Meditrader

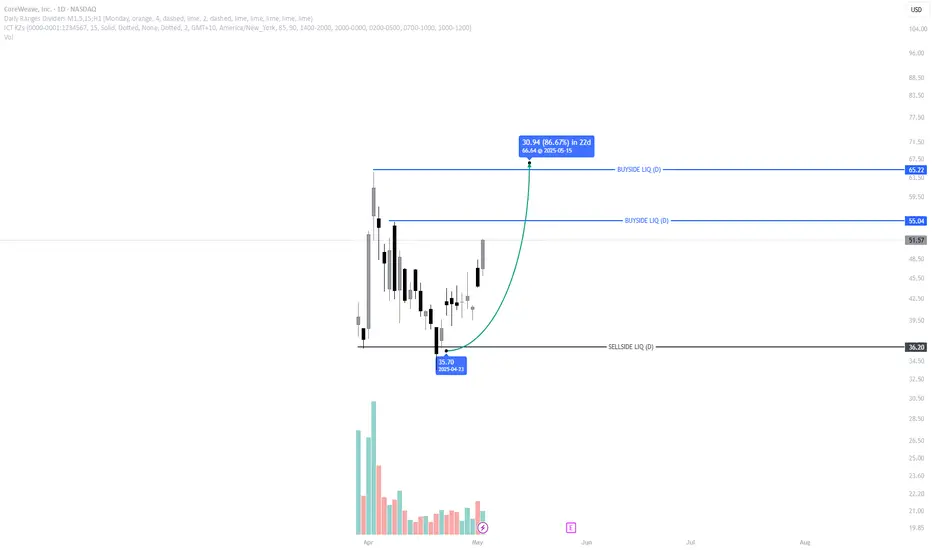
This AI-Backed IPO Is Just Warming Up — Next Stop: 86% Gains?CoreWeave is showing classic IPO 'honeymoon phase' price action, with early liquidity swept and bullish structure forming.
🔍 Price swept the daily sell-side liquidity at $35.70
📈 Now pushing higher — next major buyside targets at $55.04 and $65.22
🤖 Backed by NVIDIA, adding serious momentum and credibility
🧠 Expecting strong continuation as institutions begin to build exposure
If price maintains structure, this could be one of the strongest IPO moves of 2025.
Is The Nasdaq Bullish? Moving Higher Tomorrow...?In this video, we will analyze the NASDAQ futures for Friday, May 2nd.
Markets are looking tradeable again.
NQ has swept an old high, and retraced today. I like the location of the bullish FVG right below... which price has just tapped into a little while ago.
Look for the reaction from that +FVG, and trade accordingly.
Enjoy!
May profits be upon you.
Leave any questions or comments in the comment section.
I appreciate any feedback from my viewers!
Like and/or subscribe if you want more accurate analysis.
Thank you so much!
Disclaimer:
I do not provide personal investment advice and I am not a qualified licensed investment advisor.
All information found here, including any ideas, opinions, views, predictions, forecasts, commentaries, suggestions, expressed or implied herein, are for informational, entertainment or educational purposes only and should not be construed as personal investment advice. While the information provided is believed to be accurate, it may include errors or inaccuracies.
I will not and cannot be held liable for any actions you take as a result of anything you read here.
Conduct your own due diligence, or consult a licensed financial advisor or broker before making any and all investment decisions. Any investments, trades, speculations, or decisions made on the basis of any information found on this channel, expressed or implied herein, are committed at your own risk, financial or otherwise.

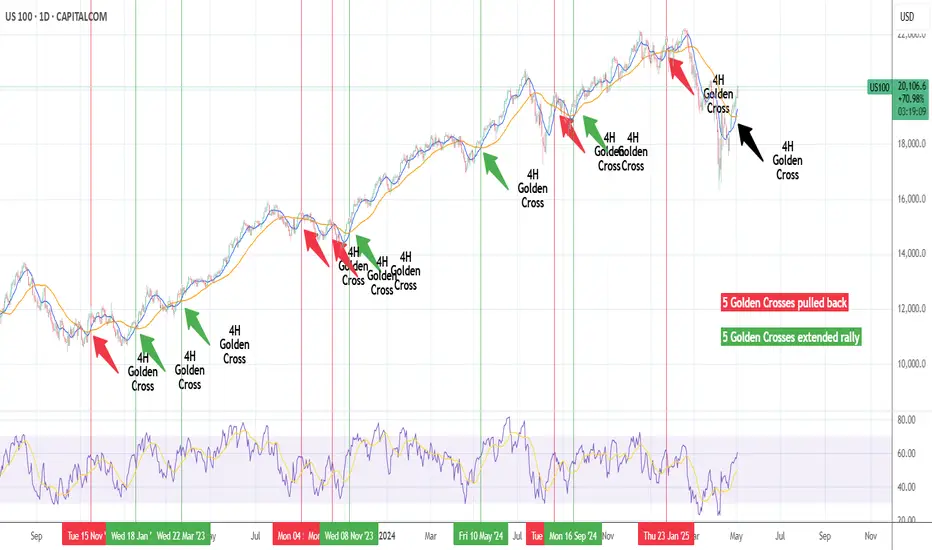
NASDAQ: 50% probability that this Golden Cross is bearish.Nasdaq is bullish on its 1D technical outlook (RSI = 60.920, MACD = 61.810, ADX = 33.031) as it continues its recovery from the Low of the previous month. In the meantime, it formed a 4H Golden Cross, the first since January 23rd. Even though this is a bullish pattern theoretically, it often doesn't deliver an immediate rise. More specifically, since the October 2022 market bottom, Nasdaq has had another 10 Golden Crosses on the 4H timeframe. The interesting statistic is that 5 have extended their rallies but the other 5 cuased a pullback (short or medium term). Consequently we call for caution in the next 2 weeks, as the market may correct towards the 4H MA200 before it resumes the long term uptrend.
## If you like our free content follow our profile to get more daily ideas. ##
## Comments and likes are greatly appreciated. ##
Mega Cap Tech Setting a Head & Shoulders – Breadth Collapse IncoICEUS:NYFANG (FANG+) is showing a textbook Head & Shoulders pattern — Left Shoulder, Head, and a freshly printed Right Shoulder.
The setup becomes even more concerning when you combine it with the Nasdaq Oscillator, which just printed an identical spike to the one that marked the 2024 top.
🧠 Here's the backdrop:
Netflix, Meta, Google, and Microsoft have already had their post-earnings moonshots.
Tonight it’s Amazon and Apple — the last two horses in the race (Nvidia is still weeks away).
Breadth is collapsing — this rally is being carried by fewer and fewer names.
📉 Breakdown below the neckline could mean:
🔻 –25% correction (minimum)
🚨 Potential –50% wipeout if the neckline fails

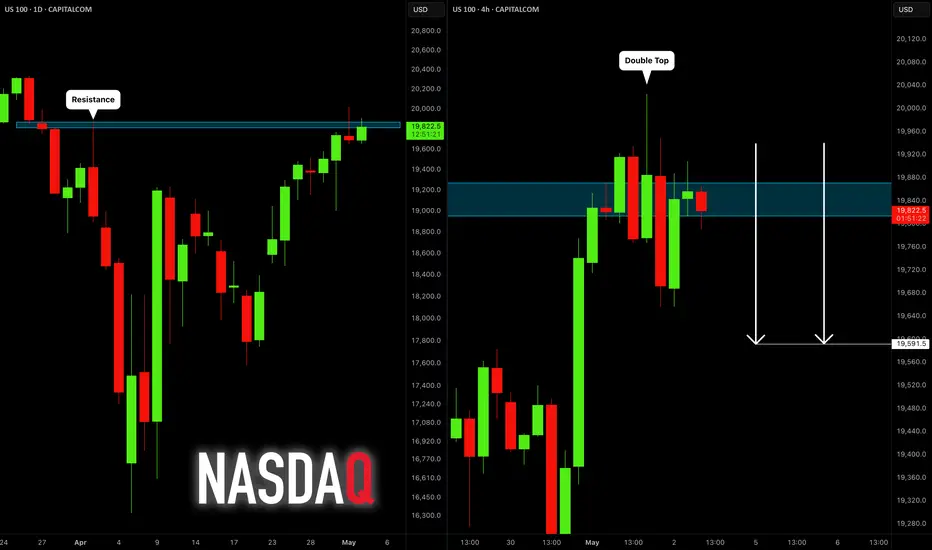
NASDAQ INDEX (US100): Time for Pullback
There is a high chance that US100 will retrace from the underlined
blue daily resistance.
I spotted a double top pattern on a 4h time frame after its test
and a nice bearish imbalance candle that was formed
during the NY session yesterday as confirmations.
Goal - 19590
❤️Please, support my work with like, thank you!❤️
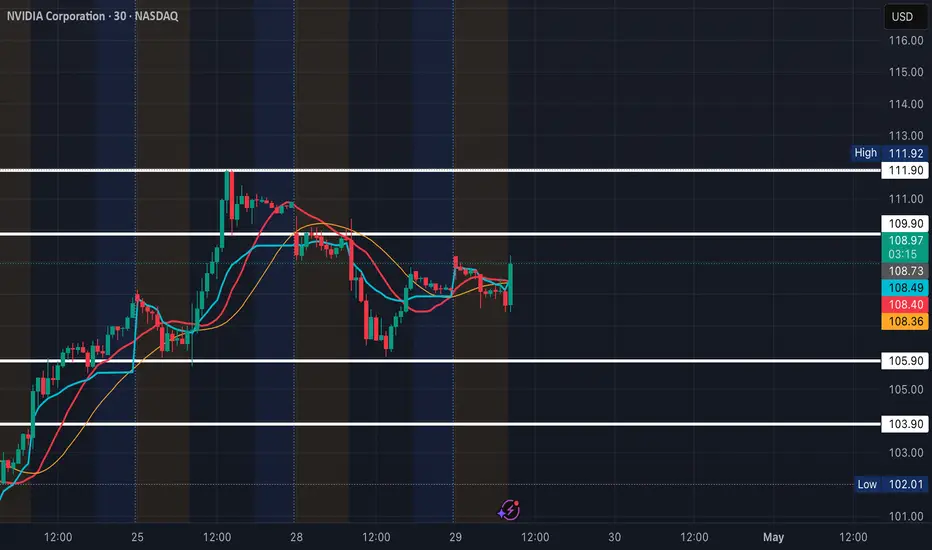
NVDA Day Trade Plan for 04/29/2025NVDA Day Trade Plan for 04/29/2025
📈 111.90 109.90
📉 105.90 103.90
Thanks to all my followers! Truly appreciate the support!
Please like and share for more ES/NQ levels Tues & Thurs 🤓📈📉🎯💰
*These levels are derived from comprehensive backtesting and research and a quantitative system demonstrating high accuracy. This statistical foundation suggests that price movements are likely to exceed initial estimates.*
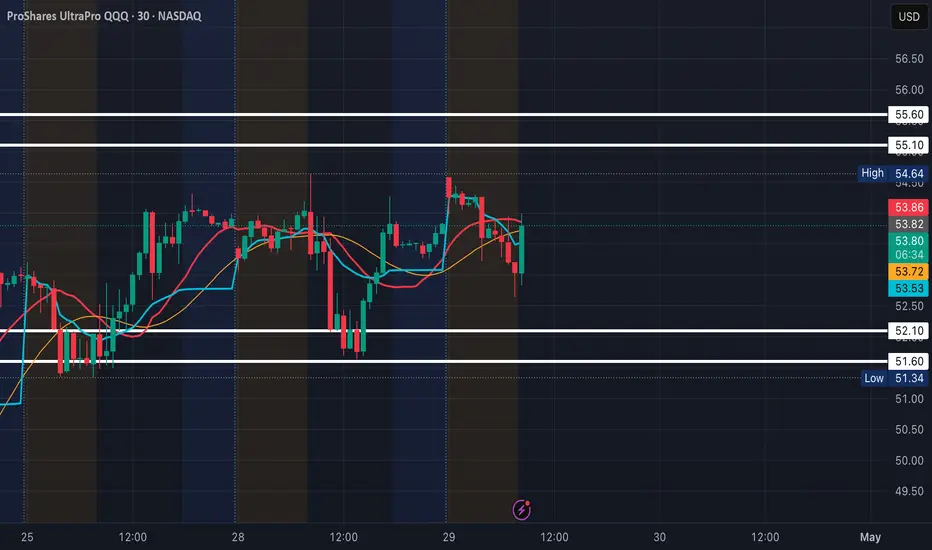
TQQQ Day Trade Plan for 04/29/2025TQQQ Day Trade Plan for 04/29/2025
📈 55.10 55.60
📉 52.10 51.60
Thanks to all my followers! Truly appreciate the support!
Please like and share for more ES/NQ levels Tues & Thurs 🤓📈📉🎯💰
*These levels are derived from comprehensive backtesting and research and a quantitative system demonstrating high accuracy. This statistical foundation suggests that price movements are likely to exceed initial estimates.*
TSLA Day Trade Plan for 04/29/2025TSLA Day Trade Plan for 04/29/2025
📈 299 305
📉 274.50 268.50
Thanks to all my followers! Truly appreciate the support!
Please like and share for more ES/NQ levels Tues & Thurs 🤓📈📉🎯💰
*These levels are derived from comprehensive backtesting and research and a quantitative system demonstrating high accuracy. This statistical foundation suggests that price movements are likely to exceed initial estimates.*

MNQ1!/NQ1! Day Trade Plan for 05/01/2025MNQ1!/NQ1! Day Trade Plan for 05/01/2025
📈 20130 20219
📉 19770 19700
Thanks to all my followers! Truly appreciate the support!
Please like and share for more ES/NQ levels Tues & Thurs 🤓📈📉🎯💰
*These levels are derived from comprehensive backtesting and research and a quantitative system demonstrating high accuracy. This statistical foundation suggests that price movements are likely to exceed initial estimates.*

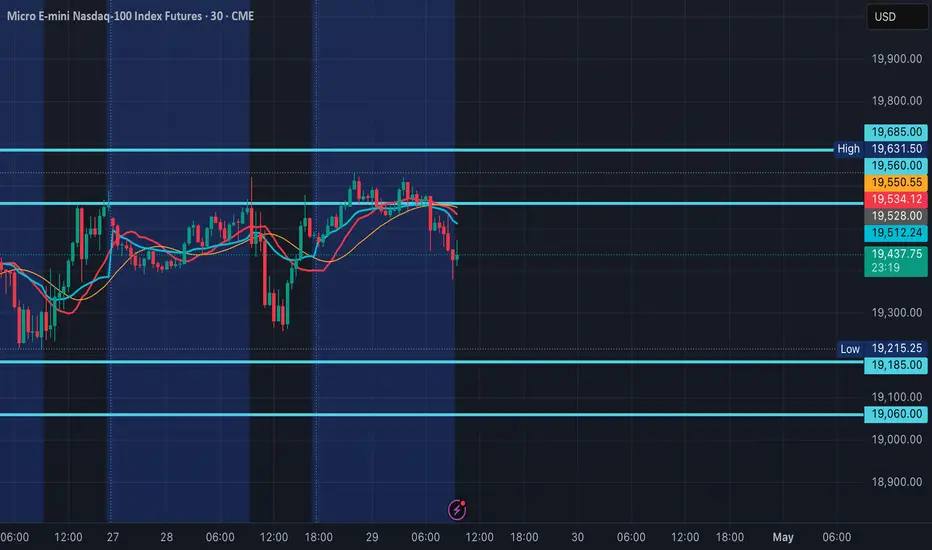
MNQ1!/NQ1! Day Trade Plan for 04/29/2025MNQ1!/NQ1! Day Trade Plan for 04/29/2025
📈 19560 19685
📉 19185 19060
Thanks to all my followers! Truly appreciate the support!
Please like and share for more ES/NQ levels Tues & Thurs 🤓📈📉🎯💰
*These levels are derived from comprehensive backtesting and research and a quantitative system demonstrating high accuracy. This statistical foundation suggests that price movements are likely to exceed initial estimates.*
NASDAQ testing its 1D MA50. Break-out or Fake-out?Nasdaq (NDX) has reached its 1D MA50 (blue trend-line) for the first time since February 24. Following the (near) rebound on the 1W MA200 (orange trend-line), this looks like a textbook recovery from a correction to a new long-term Bullish Leg.
Chronologically the last such correction was the March 2020 COVID flash crash, which after it almost touched the 1W MA200, it recovered as fast as the current rebound and when it broke above its 1D MA50, it turned it into the Support of the new long-term Bullish Leg.
What wasn't a break-out but a fake-out was the rebound after the June 13 2022 (near) 1W MA200 rebound, when the break above the 1D MA50 was false as it produced a new rejection and sell-off later on. The difference is that 2022 was a technical Bear Cycle both in terms of length and strength.
Whatever the case, Nasdaq has seen the lowest 1W RSI (oversold) reading among those 3 bottoms. So do you think today's 1D MA50 test is a break-out or fake-out?
-------------------------------------------------------------------------------
** Please LIKE 👍, FOLLOW ✅, SHARE 🙌 and COMMENT ✍ if you enjoy this idea! Also share your ideas and charts in the comments section below! This is best way to keep it relevant, support us, keep the content here free and allow the idea to reach as many people as possible. **
-------------------------------------------------------------------------------
💸💸💸💸💸💸
👇 👇 👇 👇 👇 👇

Nasdaq: Where should I buy from next? New bullish orderblockWe are hunting the next buyzone already. The correction zone is printing now.
This is how you accurately forecast your next entry ahead of time. Learn how corrections should work. Long below higher time frame (Hourly/Daily/Weekly) lows is the name of the game.
This should be easy work, and you can feel free to look for longs below 15m lows on the way to the targets above. Once we hit those, we should look for correction after closing below hourly candles, the same way we were able to freely take long after close above hourly candles today just as I prescribed while it was dropping.
This is just the rules of the game 🔓 gotta be sharp enough to observe them and trust the mechanics. Thanks for tuning in

NASDAQ Potential UpsidesHey Traders, in today's trading session we are monitoring NAS100 for a buying opportunity around 19250 zone, NASDAQ is trading in an uptrend and currently is in a correction phase in which it is approaching the trend at 19250 support and resistance area.
Trade safe, Joe.
Is Nasdaq still bullish? Steep correction today as expectedIf you look at my last post, you can see where I explained the expectation.
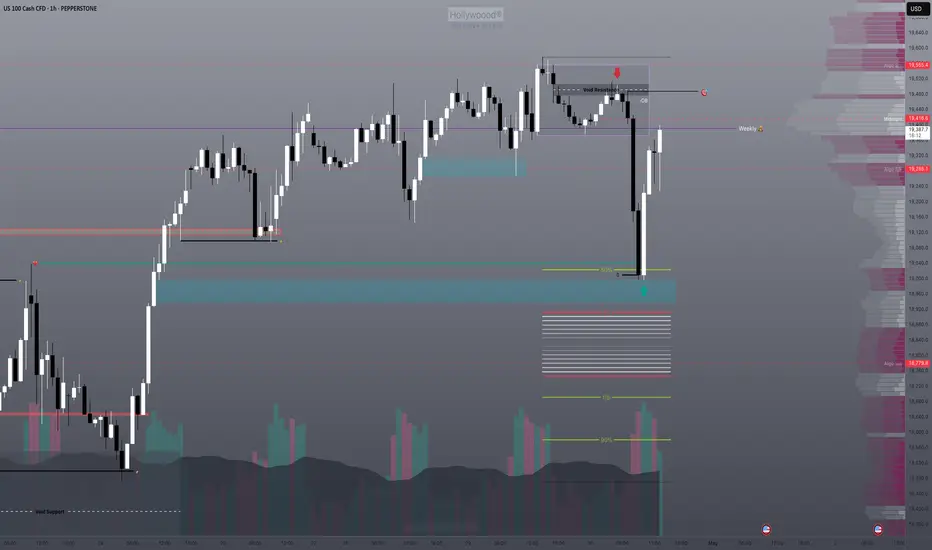
As range theory would state, the rejection from the bottom of a range creates a target in the high of the range. I have identified the candle top that I believe is the target for this rally.
If the bearish imbalance is stacked with too many orders we will not make it there. We are sitting right around the 50EMA for hourly as well as retesting the break point and bottom of the hourly bearish orderblock as I have marked.
It is in my opinion that the Void will act as a magnetic anomaly and assist in pulling price up as many institutional orders will be in that range, but we'll see 🔑
Share with a friend in need of real guidance 🫡
NASDAQ: Rejected on the 1D MA50. Can it break it?Nasdaq is neutral on its 1D technical outlook (RSI = 52.608, MACD = -100.810, ADX = 23.609) as it got rejected today on the 1D MA50. That is the first serious Resistance test of the April 7th rebound and until it breaks, we can see a technical pullback to the 4H MA100 in order to establish the new Support. With the 1D RSI confirmed the new long term bottom with a DB, buying the dips on every such pullback is the most effective strategy on such occasions. Our short term target is the R1 level (TP = 20,300).
## If you like our free content follow our profile to get more daily ideas. ##
## Comments and likes are greatly appreciated. ##

NASDAQ INDEX (US100): Move Up Ahead
I think that US100 is going to bounce.
The price is currently retesting a recently broken
key daily horizontal resistance.
We see a strong positive bullish reaction to that.
Next resistance - 19779
❤️Please, support my work with like, thank you!❤️
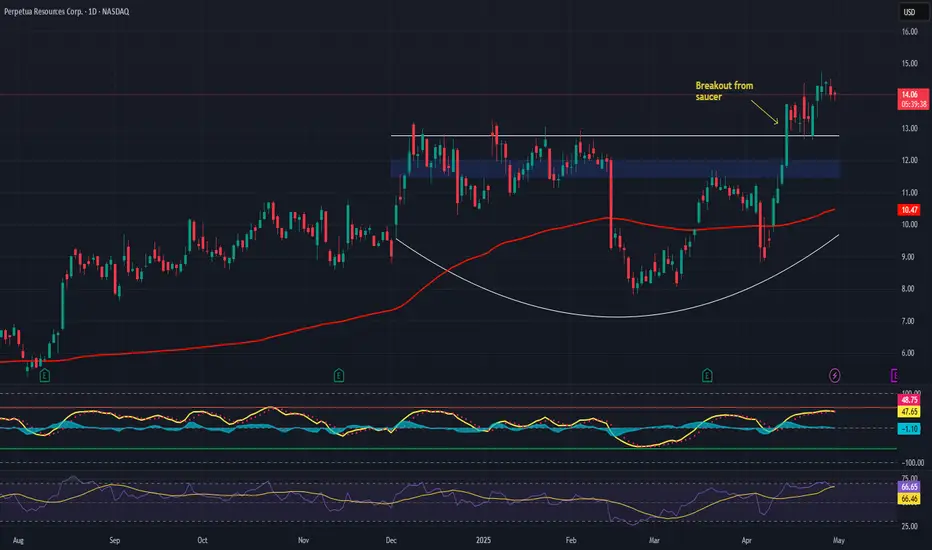
Perpetua – Unlocking Strategic Gold & Critical Mineral Value Project Focus:
Perpetua NASDAQ:PPTA is advancing the Stibnite Gold Project—a rare dual-value asset with both economic and national security significance.
Key Catalysts:
Federal Backing Accelerates Permitting 🏛️
Labeled a “Transparency Project” by the White House
Streamlined permitting process → lowers execution risk, expedites timeline
Outstanding Economics 💰
$3.7B after-tax NPV, 27%+ IRR at spot prices
AISC: $435/oz in early years → Tier-one margins + downside protection
Antimony Exposure: Critical Strategic Edge 🇺🇸
One of the few domestic sources of antimony, vital for:
Defense applications
Battery storage technologies
Geopolitical importance enhances long-term value proposition
Environmental Remediation Built-In 🌱
Project includes restoration of a legacy mining site → aligns with ESG frameworks and broadens support base
Investment Outlook:
✅ Bullish Above: $11.50–$12.00
🚀 Target Range: $18.00–$19.00
🔑 Thesis: Tier-1 economics + critical mineral relevance + federal backing = asymmetric upside for long-term investors
📢 PPTA: A gold play with strategic minerals and federal momentum behind it.
#Gold #CriticalMinerals #Antimony #MiningInnovation #EnergySecurity #PPTA
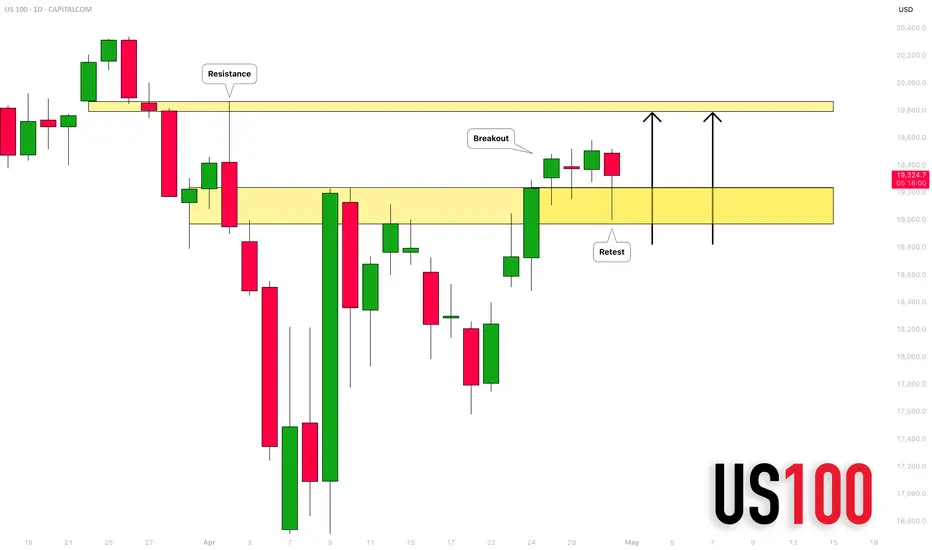
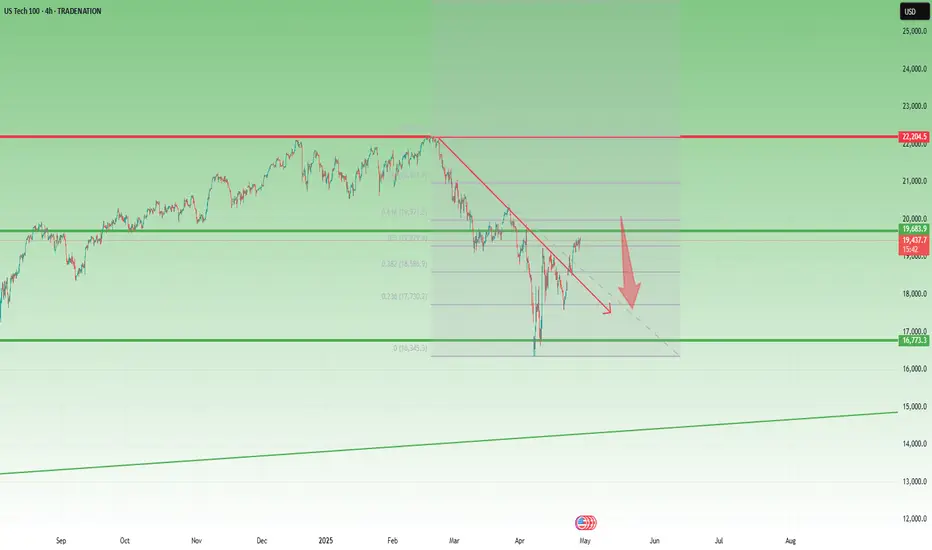
NASDAQ Recovery Looks Fragile Below 20,500After the steep drop to 16,300, NAS100 started to recover, forming a higher low and managing to break back above the falling trendline drawn from the all-time high (ATH).
While these are positive developments, in my opinion, the trend is likely to reverse to the downside soon.
Technically, the index is now entering a heavy resistance zone, marked by:
• The golden sell zone between the 50% and 61.8% Fibonacci retracement,
• Psychological resistance at 20,000,
• Major horizontal resistance around 20,500.
As long as the price remains below 20,500, I favor short trades, targeting a potential drop to at least 18,000
Disclosure: I am part of Trade Nation's Influencer program and receive a monthly fee for using their TradingView charts in my analyses and educational articles.
Nasdaq analysis: 30-APRIL-2025Good morning. Welcome to today's Nasdaq market analysis and educational insights for price action traders.

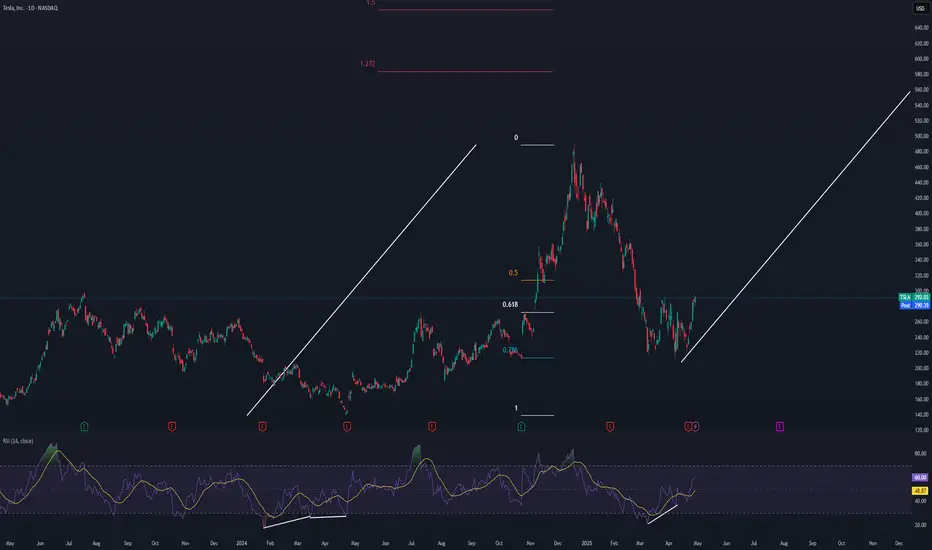
TSLA Potential Post Tariff Resolution Bullish RallyDespite uncertainty still looming over the current global tariff based environment, TSLA price still seems to exhibit signs of a potential Bullish breakout as the price action may form a prominent Higher Low on the longer timeframes with multiple confluences through key Fibonacci and Support levels which presents us with a potential Non-Leverage hold opportunity.
Entry: CMP 292
Stop Loss: 90 or 0 (depends on trading style as Non-Leverage Buy & Hold is recommended)
Potential Range for Targets: 470 - 550