A Sleeping Giant in the Energy Sector?While everyone’s chasing the next hot AI stock, a quiet opportunity might be taking shape in the energy sector; and it could be a big one.
🔋 As AI data centers explode in size and number, the demand on our power grid is rising fast. Nuclear is still years away, and renewables are struggling to scale in time. That leaves oil and gas as the most reliable players; and one U.S. company may be perfectly positioned to ride that wave.
📊 Technical Analysis
NASDAQ:PROP PROP has been in a steady downtrend, moving within a falling wedge pattern (marked in green). Right now, it’s retesting the bottom of that wedge, typically where things get oversold.
Even more interesting, PROP bounced off a major monthly demand zone last week, a signal that buyers may be stepping in.
In the short term, if the blue demand zone holds, we could see a push toward the $7 mark, which lines up with the top of the wedge.
But to really confirm a medium-term reversal, we’ll need a clean break above the $8.3 resistance. If that happens, the door could open to a rally toward $15, a key level from early 2024.
🛢️ Why PROP? A Hidden Play With Room to Run
Prairie Operating Co. (NASDAQ: PROP) isn’t your typical small-cap oil stock. They own 65,000 acres in Colorado’s DJ Basin and use modern drilling tech to stay lean and efficient. That means they can still make money even when oil prices dip.
As energy demand continues to climb, PROP could be sitting in the sweet spot , especially with the world so focused on tech stocks. But behind every AI boom is a growing energy need, and companies like PROP are the ones powering it.
One well-known Wall Street firm recently gave PROP a Buy rating with a $21.75 price target; that’s a potential 281% upside from where it stands today. And that’s not even counting the potential boost from energy-friendly policies under the current administration.
📌 One to Watch in 2025
PROP might just be one of the most under-the-radar energy plays going into the new year.
The biggest moves often start quietly; and this one has all the ingredients to surprise.
➡️ As always, speak with your financial advisor and do your own research before making any investment decisions.
📚 Always follow your trading plan => including entry, risk management, and trade execution.
Good luck!
All strategies are good, if managed properly.
~ Richard Nasr
Nasdaq

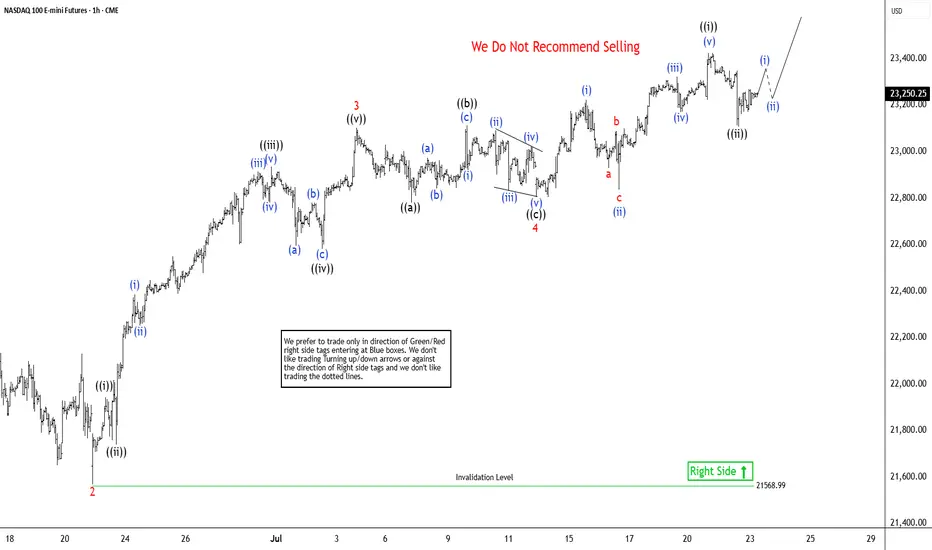
Elliott Wave View: Nasdaq Futures (NQ_F) Poised To Extend HigherThe Nasdaq Futures (NQ_F) favors higher in bullish impulse sequence from April-2025 low. It already broke above December-2024 high & expect short term pullback in 3, 7 or 11 swings to remain supported. Impulse sequence unfolds in 5, 9, 13, 17, 21….. swings count. It ended daily corrective pullback in double correction at 16460 low of 4.07.2025 low. On daily, it should extend into 28864 – 26152 area to finish April cycle before next pullback start. Above there, it favors rally in (3) of ((1)). It placed (1) of ((1)) at 21858.75 high, (2) at 21071.50 low as shallow connector & favoring upside in 5 of (3) against 7.13.2025 low. Every pullback after 4.21.2025 low was shallow & unfolded in 3, 7 or 11 swings calling for more upside as long as it stays above 5.30.2025 low. Within (3), it ended 1 at 22222 high, 2 at 21566.75 low, 3 at 23102.50 high, 4 at 22803 low & favors upsides in 5 of (3). Wave 4 as flat correction ended in 7.13.2025 low of 22803 low.
Below 3 of (3) high, it placed ((a)) at 22779.75 low, ((b)) at 23112 high & ((c)) at 22803 low as flat connector against 6.22.2025 low. Above there, it ended ((i)) at 23424.75 high as diagonal & ((ii)) at 23108 low in 3 swing pullbacks. Above there, it should continue rally in ((iii)) of 5, which will confirm above 23424.75 high to avoid double correction. Within ((i)), it placed (i) at 23222.75 high, (ii) at 22835.5 low, (iii) at 23320.75 high, (iv) at 23169.50 low & (v) at 23424.75 high. Currently, it favors upside in 5 of (3) into 23493.5 – 23934.5 area, above 7.13.2025 low before (4) pullback. Based on swing sequence, it already has enough number of swings in (3) to call the cycle completed. But as long as it stays above price trendline, passing through 2 & 4, it should continue upside into extreme area. We like to buy the next pullback in 3, 7 or 11 swings at extreme area for intraday rally. It favors upside in April-2025 cycle & expected to remain supported in (4) & later in ((2)) pullback as next buying opportunity.
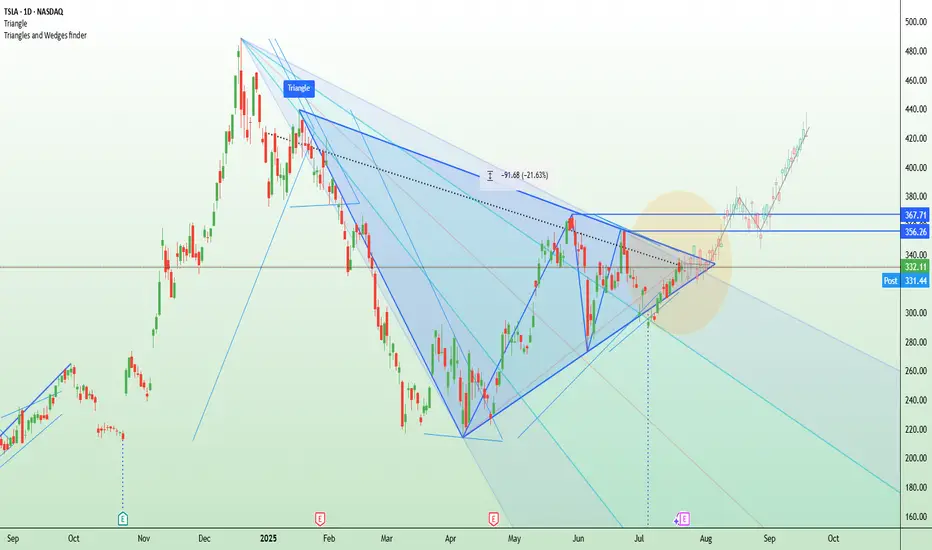
TSLA squeezes into resistance ahead of earnings Tesla is set to report Q2 earnings after the closing bell on Wednesday, covering the quarter ending June 2025.
The stock has been highly volatile this year, amid concerns about tariffs, Elon Musk’s politics (and nazi salutes), and his public clashes with President Donald Trump.
Tesla bulls Wedbush think, “We are at a 'positive crossroads' in the Tesla story,” suggesting that investors will look past the current numbers and focus on Tesla’s long-term AI potential.
Technically, Tesla is now testing a major descending trendline that’s capped every rally since December. The current price action resembles an ascending triangle pattern — a bullish structure — with resistance around $356 and a series of higher lows from May through July. This tightening formation suggests building pressure ahead of the earnings release.
NAS100 Bullish Setup: Clean Structure & Entry Zone Pending📊 NASDAQ 100 (NAS100) remains bullish, showing a clean, well-structured uptrend—higher highs and higher lows 🔼📈.
Price has now pulled back into my optimal entry zone 🎯. At this stage, I’m waiting for a bullish break in market structure before considering an entry 🟢🔓.
Patience is key—let the structure confirm first.
Not financial advice ❌💼

Properly navigating this ATH run in NASDAQ - No supply yetEverything is explained quickly in the video.
Main points:
1) Lows and bullish imbalances respected
2) It's very difficult to short without supply
3) May get cyclical take profit like previous years
Be sure to let me know what you think!

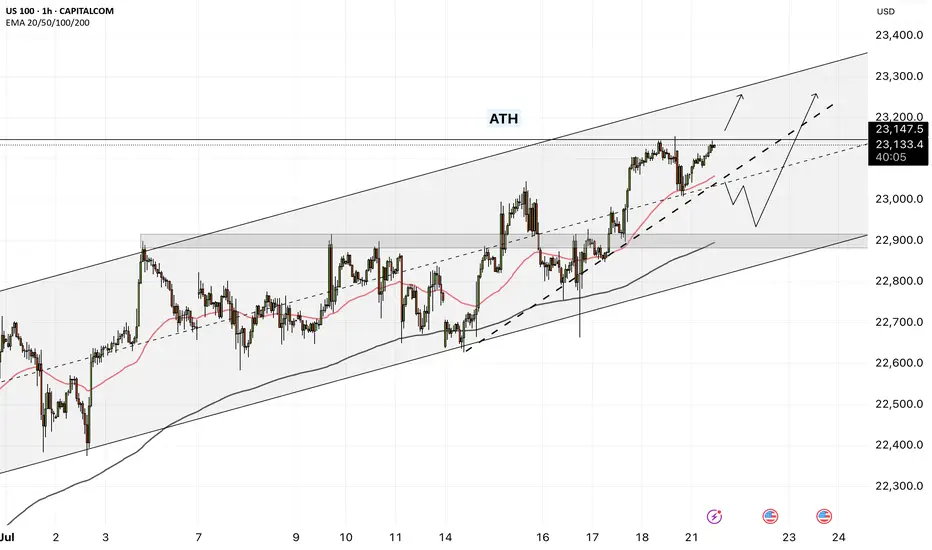
2025-07-21 - priceactiontds - daily update - nasdaqGood Evening and I hope you are well.
comment: Melt-up and bears failed to close below last weeks high, which means we are still max bullish. Until bears print below 23200, longs just make more sense than trying to look for shorts.
current market cycle: bull trend
key levels: 23000 - 23500
bull case: Bulls remain in full control until we get a daily close below 22700. First target for the bears is a lower low, which means getting below today’s spike 23225. That would be a start but likely means sideways rather than more selling. If we stay above 23200, we can continue to print many more new highs.
Invalidation is below 22700.
bear case: Bears obviously are not doing enough. They need to print 23200 and that would only be the first small start. It would open the possibility for a test of 23000 but since we are barely printing any red bars and have not broken any bull trend line so far, it’s stupid to look for shorts. Wait for much bigger selling pressure.
Invalidation is above 23500.
short term: Neutral but if anything I am looking for long scalps against support like the 1h 20ema.
medium-long term - Update from 2024-06-29: No change in plans. I expect 20000 to get hit over the next 3 months and maybe 19000 again.
trade of the day: Long US open. Just a quick melt-up but I missed it.

NQ thread: Short ideaMonday started off bullish, but only to drop at the end of the session.
Here is a thread on what is happening and on which narratives I view the market
Starting off with the 4H Time frame, we witnessed NQ and ES taking last weeks high.
YM did not.
This is the first stage of the movement. To find the second stage, we need to dive deeper into the lower timeframes..

NASDAQ Rebounding on its 1H MA50.Nasdaq (NDX) rebounded today on its 1H MA50 (blue trend-line), third time since Friday's and Thursday's bounce. A Channel Up is emerging and based on the 4H RSI it is a medium-term bullish reversal off the Pivot trend-line, similar to June 20 - 30.
As you can see, that Channel Up targeted the 2.618 Fibonacci extension before breaking below the 1H MA50 to start a lengthy consolidation. Based on that, we are targeting 23650 (Fib 2.618 ext) on the short-term.
-------------------------------------------------------------------------------
** Please LIKE 👍, FOLLOW ✅, SHARE 🙌 and COMMENT ✍ if you enjoy this idea! Also share your ideas and charts in the comments section below! This is best way to keep it relevant, support us, keep the content here free and allow the idea to reach as many people as possible. **
-------------------------------------------------------------------------------
Disclosure: I am part of Trade Nation's Influencer program and receive a monthly fee for using their TradingView charts in my analysis.
💸💸💸💸💸💸
👇 👇 👇 👇 👇 👇


NASDAQ (CASH100) SHORT - Double TOP H4Risk/reward = 11.3
Entry price = 23 190
Stop loss price = 23 270.4
Take profit level 1 (50%) = 22 674
Take profit level 2 (50%) = 22 053
All variables met, and entered the trade.
What is everyone's thoughts on shorting or longing cash100?

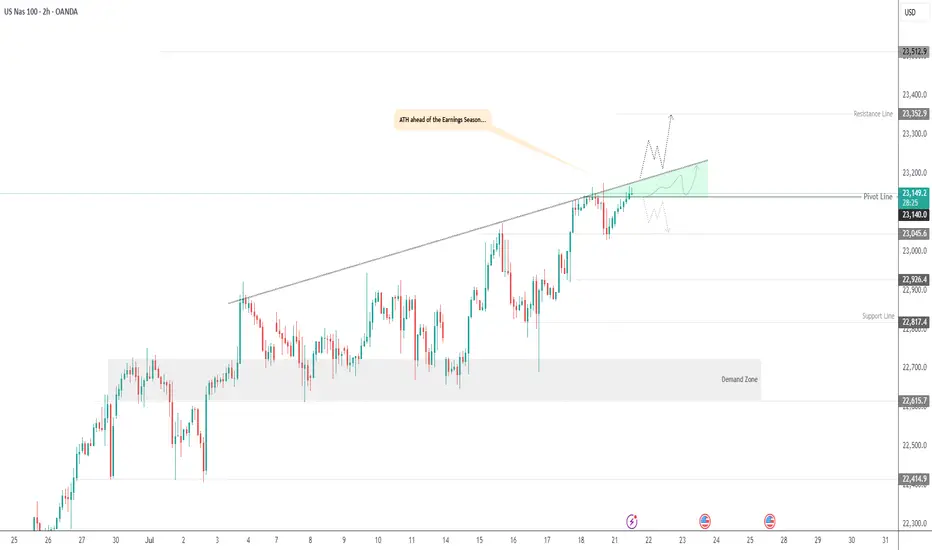
USNAS100 | Bullish Setup Ahead of Tech Earnings & Trade RiskUSNAS100 | Bullish Setup Ahead of Tech Earnings & Trade Risk
U.S. equity markets are entering a pivotal week with big-tech earnings and renewed focus on Trump’s proposed trade tariffs. Both the S&P 500 and Nasdaq are hovering near record highs, but new catalysts are required for continuation.
Technical Outlook:
The price has stabilized above 23140, breaking the pivot and confirming bullish momentum. As long as the price holds above this level, the trend remains bullish, especially if it breaks the green triangle resistance structure.
A sustained move above 23140 opens the path toward 23250 and 23350, with further extension possible to 23510.
However, a 4H close below 23140 may activate a bearish correction toward 23045, and possibly deeper toward 22920 and 22820.
Resistance Levels: 23250 · 23350 · 23510
Support Levels: 23045 · 22920 · 22820
Bias: Bullish above 23140
NAS100 - Stock Market Awaits Tariffs!The index is trading above the EMA200 and EMA50 on the 1-hour timeframe and is trading in its ascending channel. The target for this move will be the channel ceiling, but if it corrects towards the indicated support area, it is possible to buy Nasdaq with better reward to risk.
In a week once again clouded by trade tariff threats, the stock market reacted cautiously at times. However, what truly captured investors’ attention was growing concern over potential political interference in Federal Reserve policymaking—a development that influenced market sentiment and shifted the focus away from geopolitical tensions.
Despite political headwinds, U.S. economic data continued to show signs of resilience. Investors this week were more focused on corporate earnings and inflation data than on trade war rhetoric or speculation about Jerome Powell’s possible dismissal. While betting markets such as Polymarket raised the odds of Powell being removed to 40%, legally, the president cannot dismiss the Fed Chair without a valid cause—and allegations like “lying to Congress” lack legal standing.
Still, the greater danger lies not in Powell’s dismissal itself but in the potential erosion of the Federal Reserve’s independence—something that could unsettle investors in stocks, bonds, and currencies alike. Analysts expect Trump may soon appoint an ally as an informal or “shadow” Fed Chair, a move that would elevate political risk in financial markets.
Nevertheless, markets are continuing to operate along familiar lines: equities focus on corporate profits, the bond market on inflation and growth, and the currency market on relative returns. For now, the takeaway is clear: Trump is winning—but perhaps only temporarily.
Rick Rieder, Chief Investment Officer at BlackRock, noted that despite trade tensions and inflation concerns, tariffs have had limited impact so far. Following the June CPI report, he pointed out that inflation ticked up slightly—core CPI rose by 0.23% monthly and 2.93% annually, while headline inflation was up 0.29% monthly and 2.67% annually—but the broader trend still reflects easing price pressures.
Rieder attributed this to companies acting preemptively, managing inventory and adjusting supply chains to avoid passing on costs to consumers. He also cited easing wage pressures and a weakening labor market as factors contributing to the decline in inflation.
As such, Rieder believes the Federal Reserve might lower interest rates in September, though a cut in July is less likely, as the central bank would prefer to assess the impact of tariffs first.
According to the Wall Street Journal, Treasury Secretary Scott Besant privately urged Trump not to remove Jerome Powell. Besant warned that such an action could cause unnecessary turbulence in financial markets and the broader economy, and would also face legal and political hurdles. He emphasized that the Fed is already signaling potential rate cuts later this year, and confronting Powell now would be unwarranted.
A source noted that Besant reminded Trump the economy is performing well, and markets have responded positively to administration policies—another reason to avoid drastic moves.
On another front, rising long-term bond yields have become a concern for Besant, as they increase the government’s borrowing costs.He has been working to keep yields in check and believes firing Powell could further escalate them—hence his conversation with Trump aimed at dissuasion.
The coming week will begin with market attention on the European Central Bank’s rate decision, which could set the tone for Eurozone monetary policy in the second half of the year. Meanwhile, a series of key U.S. economic data will be released, providing a clearer view of conditions in employment, production, and housing.
On Tuesday, Jerome Powell will deliver an opening speech at an official event in Washington. While he is unlikely to directly address Trump’s recent verbal attacks, investors will be listening closely for any subtle references to Fed independence or interest rate direction.
On Wednesday, the June existing home sales report will be released, which could indicate whether housing demand remains steady or is weakening.
Thursday will be a packed day on the economic calendar. The ECB’s rate decision will be announced—an event under heavy scrutiny amid Eurozone stagnation. In the U.S., preliminary PMI data from S&P, weekly jobless claims, and new home sales will also be published.
Finally, the week will wrap up on Friday with the release of U.S. durable goods orders—an important gauge of capital investment in the manufacturing sector.
NASDAQ INDEX (US100): Bullish Continuation Confirmed
NASDAQ Index broke and closed above a resistance of a horizontal
parallel channel on a daily.
It confirms a bullish trend continuation and a highly probable growth
to the next strong resistance.
Goal - 23300
❤️Please, support my work with like, thank you!❤️

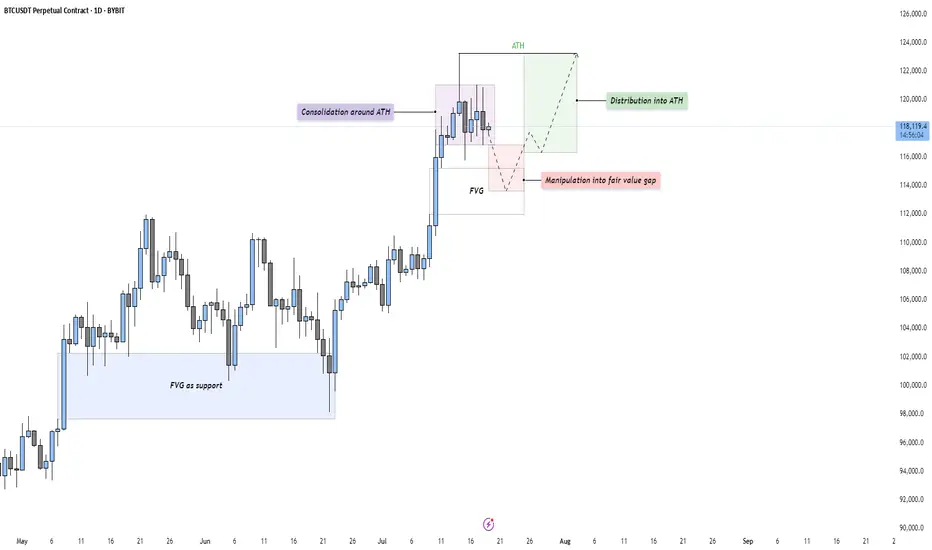
BTC - Consolidation, Manipulation & DistributionMarket Context
After a strong impulsive rally, Bitcoin is currently consolidating just beneath its All-Time High (ATH). This type of consolidation following an extended move higher often indicates indecision in the market — a pause that either leads to continuation or reversal. The current structure suggests that price is building energy for the next leg.
Consolidation and Liquidity Above ATH
The price action is tight and sideways around the ATH, which likely means liquidity is building above. Many stop-losses and breakout orders are sitting just overhead — classic conditions for a Buy Side Liquidity Sweep. This range may serve as a trap for early breakout traders, providing an opportunity for smart money to manipulate price lower before taking it higher.
Fair Value Gap Retest Scenario
Below the current range, we see a Daily Fair Value Gap that aligns with prior bullish imbalances. A move down into this Gap would represent a manipulation phase — shaking out weak longs before rebounding. The Gap also acts as a potential support level where buyers might be waiting. If price reaches into this zone and reacts strongly, it may offer a high-probability long setup.
Distribution or Reaccumulation?
While this could be interpreted as distribution beneath resistance, it’s equally valid to consider it a reaccumulation phase — a temporary markdown into demand before a fresh expansion. If the market dips into the Gap and quickly reclaims the range, it opens the door for a clean breakout above the ATH and continuation toward the 124,000–126,000 region.
Final Thoughts
Price rarely moves in a straight line. It pauses, retraces, and often tricks participants before making the real move. This type of consolidation presents opportunity — but also demands patience and clarity.
If you found this breakdown insightful, a like would be much appreciated! And I’d love to hear your thoughts in the comments — are we about to sweep down into demand, or is the rocket already on the launchpad?
NASDAQ: Still Bullish! Look For Valid Buys!Welcome back to the Weekly Forex Forecast for the week of July 21-25th.
In this video, we will analyze the following FX market:
NASDAQ (NQ1!) NAS100
The Stock Indices are strong, and showing no signs of selling off. Buy it until there is a bearish BOS.
Enjoy!
May profits be upon you.
Leave any questions or comments in the comment section.
I appreciate any feedback from my viewers!
Like and/or subscribe if you want more accurate analysis.
Thank you so much!
Disclaimer:
I do not provide personal investment advice and I am not a qualified licensed investment advisor.
All information found here, including any ideas, opinions, views, predictions, forecasts, commentaries, suggestions, expressed or implied herein, are for informational, entertainment or educational purposes only and should not be construed as personal investment advice. While the information provided is believed to be accurate, it may include errors or inaccuracies.
I will not and cannot be held liable for any actions you take as a result of anything you read here.
Conduct your own due diligence, or consult a licensed financial advisor or broker before making any and all investment decisions. Any investments, trades, speculations, or decisions made on the basis of any information found on this channel, expressed or implied herein, are committed at your own risk, financial or otherwise.

NASDAQ Potential UpsidesHey Traders, in tomorrow's trading session we are monitoring NAS100 for a buying opportunity around 22,780 zone, NASDAQ is trading in an uptrend and currently is in a correction phase in which it is approaching the trend at 22,780 support and resistance area.
Trade safe, Joe.
BTC/USD Fake out before Pump | Bullish Flag formationBTC/USDT (1D) Market Outlook – July 1, 2025
Introduction
BTC is currently consolidating within a bullish flag pattern after printing a swing high at 108.9K and a recent swing low at 98K. The price sits just below a major supply zone.
Context 1: Key Zones
Supply: 104.6K – 112.1K
Demand: 74.4K – 82.5K
Fair Value Gaps (FVG): 3 zones below price, with one near 88–90K
Context 2: Technical Confluence
Liquidation Zone: 106.2K
Golden Pocket (Fib 0.618): 102.1K
Psychological Levels: 105K and 110K
Context 3: Market Structure
Pattern: Bullish flag
Trend (LTF): Sideways/consolidation
Volume Profile: Heavy activity near 105K–110K
Bullish Scenario
Breaks above 106.2K (liq zone)
Pulls back to 102.1K (golden pocket), forms higher low
Retests resistance for continuation
Alt scenario: clean breakout above resistance → ATH retest
Bearish Scenario
Breaks below 106.2K and flag support
Fills FVG, breaks prior low at 98K
Triggers macro downtrend toward 88–90K zone
Summary
BTC is at a decision point inside a bullish flag, facing supply. A break above 106.2K favors upside continuation, while rejection and a lower low could trigger a deeper retracement. Watch key levels closely.

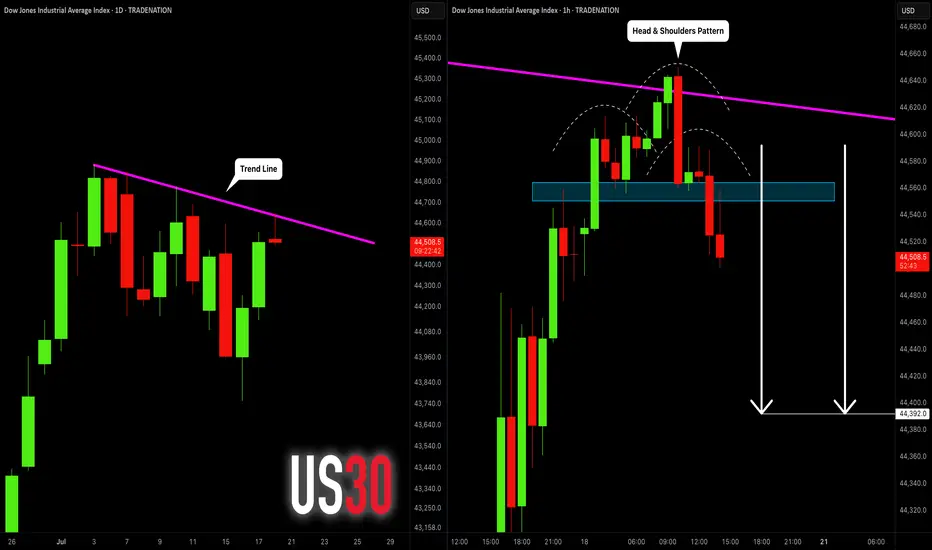
DOW JONES INDEX (US30): Bearish Move From Trend Line
I see a test of a strong trend line on US30.
The price formed a head & shoulders pattern on that
and a breakout of its neckline on an hourly time frame.
I expect a retracement to 48390
❤️Please, support my work with like, thank you!❤️
I am part of Trade Nation's Influencer program and receive a monthly fee for using their TradingView charts in my analysis.
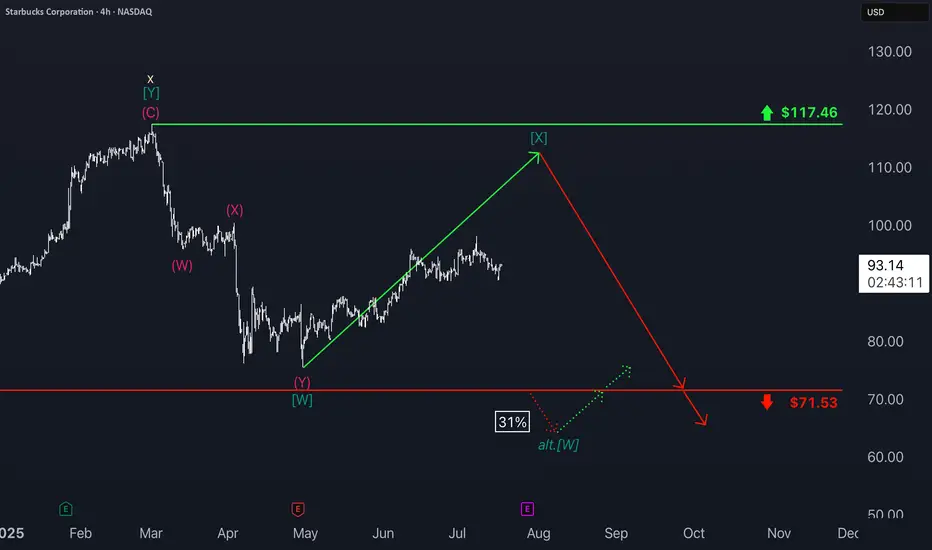
Starbucks: Sideways Trend Continues Starbucks shares have remained in a sideways range over the past two weeks. This does not alter our primary outlook: We continue to see the stock in the dark green wave , which is expected to peak near the resistance level at $117.46. After reaching this high, we anticipate a move lower, with the stock dropping below the support at $71.53. However, since the intermediate high has not yet been established, an alternative scenario remains on the table: With a 31% probability, the dark green wave alt. could take hold first, driving the price below the $71.53 mark ahead of schedule.
📈 Over 190 precise analyses, clear entry points, and defined Target Zones - that's what we do (for more: look to the right).
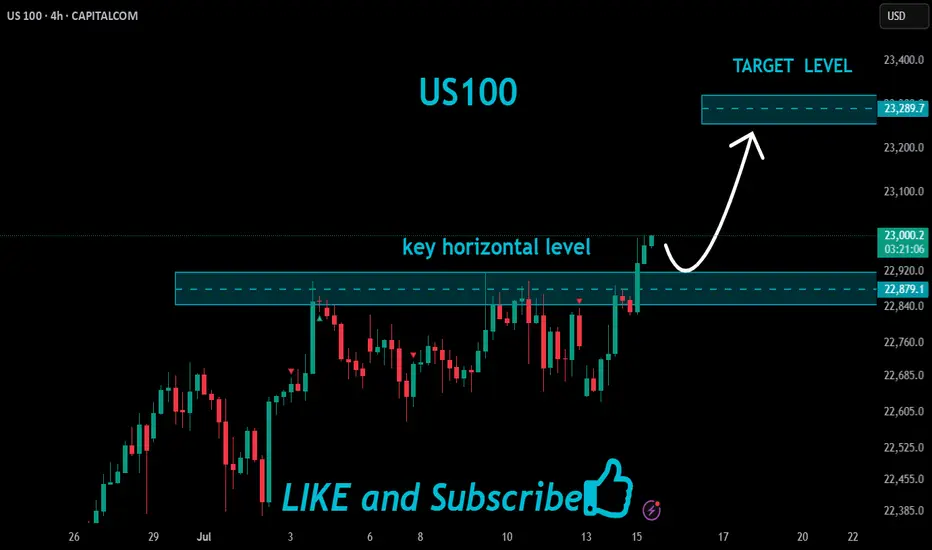
US100 Strong Bullish Breakout!
HI,Traders !
#US100 is trading in a
Strong uptrend and the
made a bullish breakout
Of the key horizontal level
Of 22879.1 so we are
Bullish biased and we will
Be expecting a further
Bullish move up !
Comment and subscribe to help us grow !
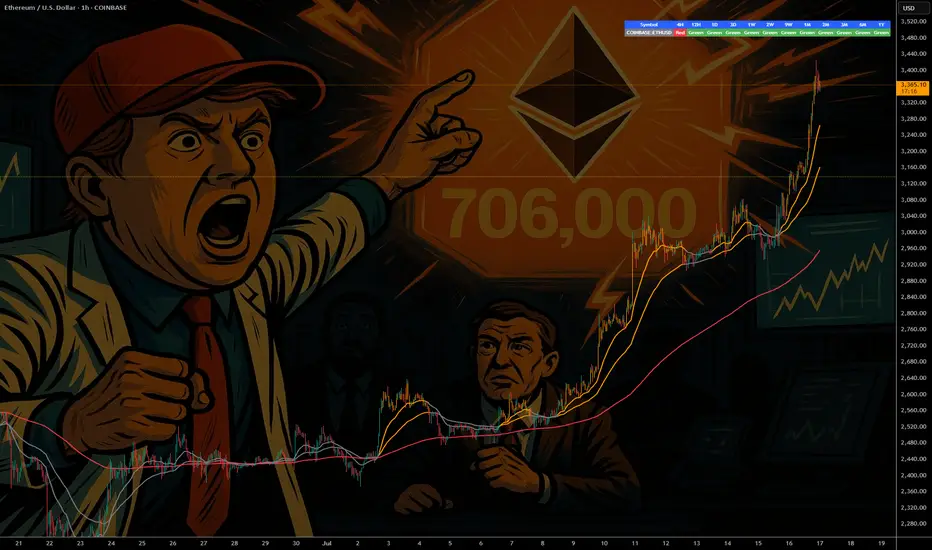
ETH - If You Know ...... You Know whats Coming
NYSE:BLK $BUIDL tokenized U.S.-Treasury fund launched on COINBASE:ETHUSD in Mar 2024—Wall Street is already settling real dollars on-chain.
NYSE:JPM JPMD stablecoin just went live on Base (an COINBASE:ETHUSD L2), piping wholesale payments from a $4 T balance-sheet straight through COINBASE:ETHUSD rails.
COINBASE:ETHUSD isn’t just riding the next crypto cycle—it’s becoming Wall Street’s settlement layer. From BlackRock’s on-chain Treasury fund to JPMorgan’s and soon Bank of America’s dollar tokens, a tidal wave of institutional stable-coin flows is lining up behind ETH. Fewer coins, more real-world volume—if you know, you know what’s coming.
NYSE:BAC CEO says they’ll issue a dollar-backed token the moment regulators nod—another tier-1 bank boarding the Ethereum train.
Stablecoin cap has blasted past $230 B , with 80 %+ of all on-chain transfers riding Ethereum (plus BSC) blocks.
Corporate settlements via stablecoins grew 25 % YoY in 2024 as multinationals replaced SWIFT with instant on-chain clearing.
Daily stablecoin throughput averages $7 B—each hop burning ETH and tightening supply.
BCG projects tokenized real-world assets to exceed $16 T by 2030 , with EVM chains as the default plumbing.
Over 500 M wallets already interact with stablecoins , a 30 % YoY surge led by emerging-market demand.
L2s like BINANCE:ARBUSDT & BINANCE:OPUSDT cut transaction fees 35 % yet still settle back to mainnet—meaning ETH captures the fee stream and the burn.
Bottom line: a tidal wave of bank-grade stablecoins + tokenized assets is lining up behind ETH; supply shrinks, demand soars—if you know, you know what’s coming.
quote] Marty Boots | 17-Year Trader — smash that , hit LIKE & SUBSCRIBE, and share your views in the comments below so we can make better trades & grow together!
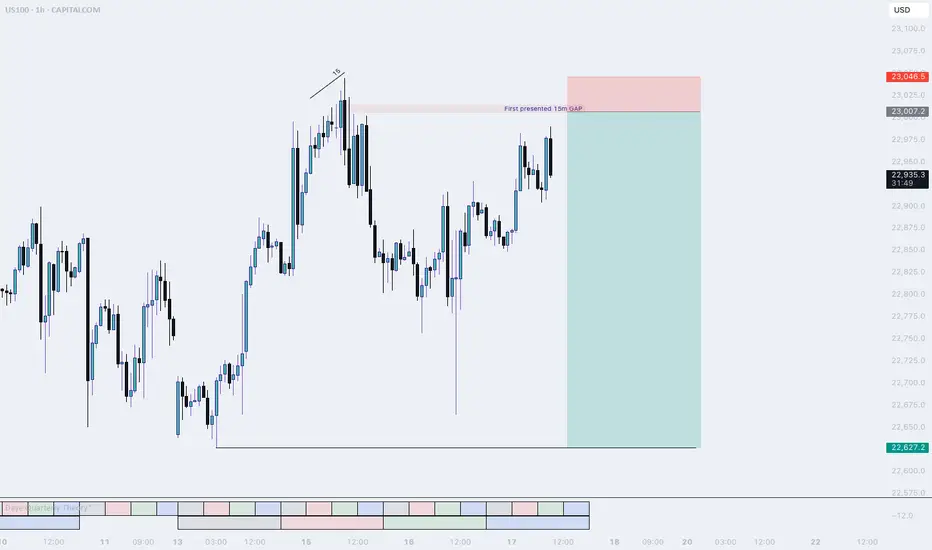
NQ, Short setupJust before market Open price dropped lower, I expect price to travel back up into the 15 m Gap and then sell off. This is the only setup I am interested in today.
The 15m level will be a resistance level for price. This level is derived from the last reversal. Since NQ was lagging, i expect price to use his level to squeeze the shorts out and start a new down trend.
If this does not happen and the highs get taken out, I will be flat today
Goodluck, Good trading.
F
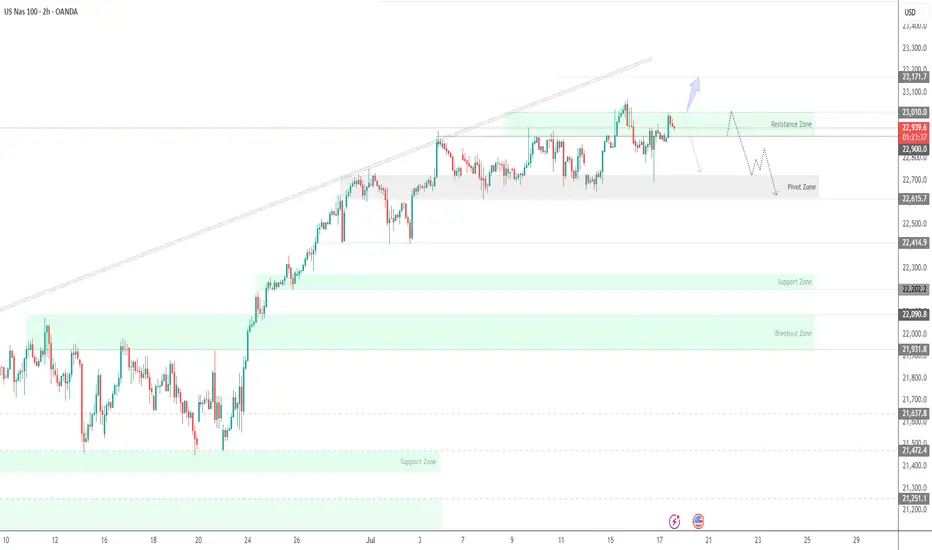
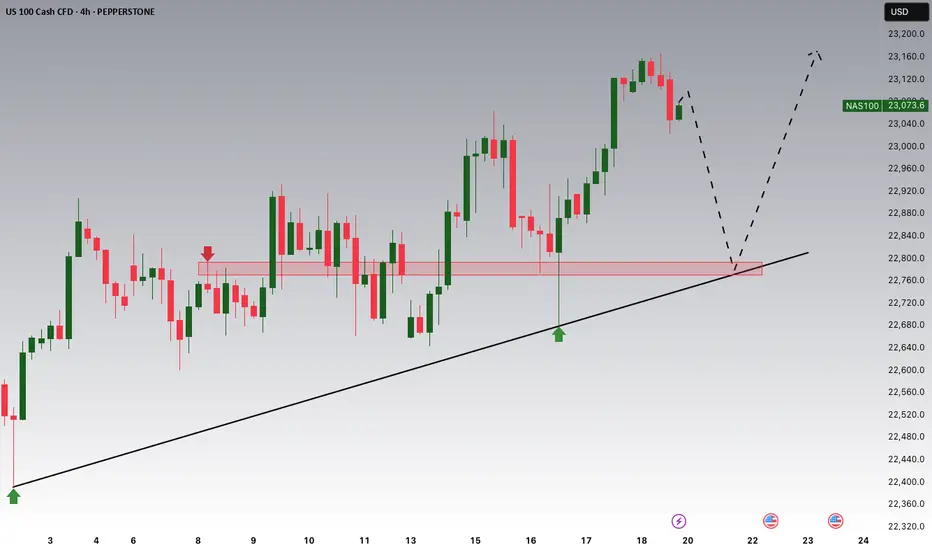
USNAS100 | Consolidation 23010 - 22900, Bearish or Not Yet...USNAS100: Cautious Consolidation as Powell Uncertainty Lingers
Following political noise around Fed Chair Powell — with Trump admitting he floated the idea of replacing him — tech markets have entered a cautious consolidation. While no immediate action was taken, the underlying uncertainty continues to weigh on sentiment, especially in rate-sensitive sectors like tech.
Technically: Consolidation Before the Break
The price is currently consolidating between 22900 and 23010.
A confirmed 1H close below 22900 would signal the start of a bearish trend, targeting 22700 and 22615.
Conversely, a close above 23010 would open the path toward a new all-time high (ATH) at 23170.
Key Levels:
Support: 22700, 22615
Resistance: 23010, 23170