Bitcoin & Ethereum New Quarter | What To Look For🎯 New Quarter For COINBASE:BTCUSD & COINBASE:ETHUSD — What To Look For
As we enter a new quarter, smart money is already positioning.
Institutional investors, hedge funds, and asset managers don’t just trade price — they rotate capital based on quarterly performance, risk appetite, and macro expectations. That’s why each quarterly open is a key inflection point across all markets — including crypto.
In this video, I break down:
• 🧠 How institutional capital rotation impacts Bitcoin and Ethereum
• 📈 Key levels to watch as Q3 unfolds
• 🔁 What are the likely outcomes
• 📊 How to prepare for volatility and new trend formation
This isn’t just another candle — it’s the start of a new chapter in the cycle.
If you’re serious about understanding where the money flows next , this video is for you.
This is the likely outcome
Price not ready to moon yet
Strong candle implying new highs incoming
Watch for bearish stop hunt on new quarter
This is a bullish outside bar
MartyBoots here , I have been trading for 17 years and sharing my thoughts
👍 Enjoyed the insights?
Let me know your thoughts in the comments below — and don’t forget to like this post to support the channel!
Nasdaq

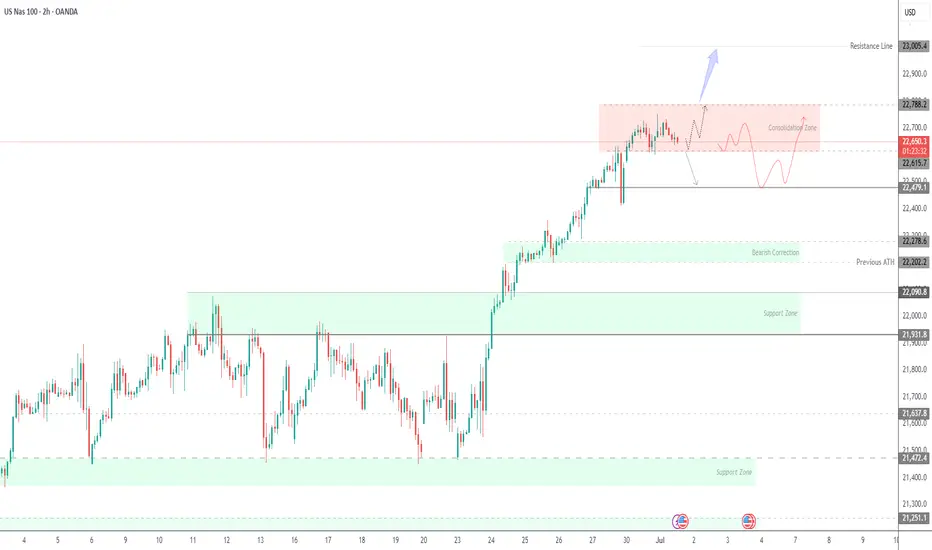
USNAS100 Bullish Momentum Holds Above Key PivotUSNAS100 – Overview
The price successfully retested the 22,610 level and resumed its bullish trend, reaching 22,750 as anticipated in our previous idea.
Currently, the index needs to maintain stability above the 22,610 pivot line to sustain the upward momentum toward the next resistance at 22,790. A sustained move above this level may open the path toward 23,000.
However, a 1H candle close below 22,610 could trigger a corrective move down to 22,480. A break below this support would expose the next key level at 22,280.
Pivot: 22,610
Resistance: 22,790 – 23,000
Support: 22,480 – 22,280
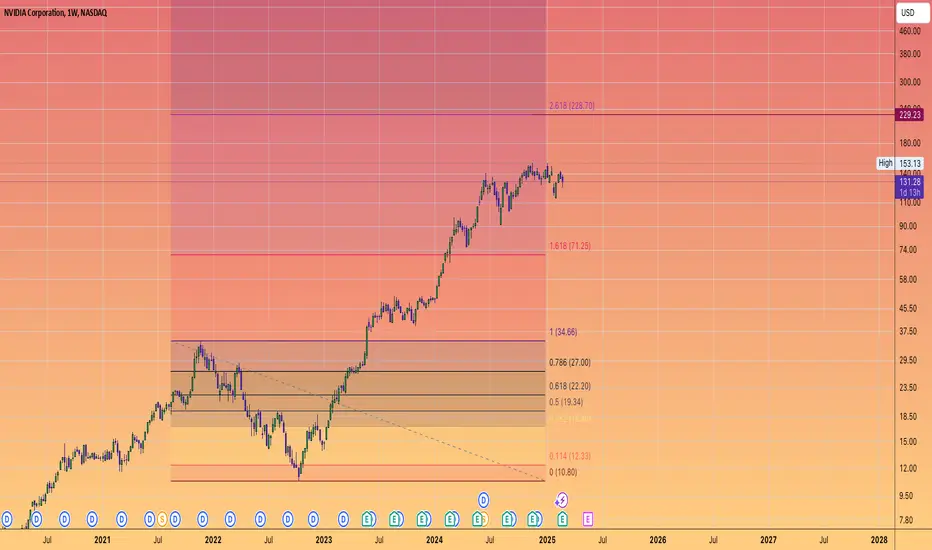
NVIDIA to $228If Nvidia were truly done for, why is it impossible to find their latest 5000 series GPUs?
Even if someone wanted to buy one, they simply can't.
The reason lies in Nvidia's commitment to fulfilling the soaring demand from AI data centers, which has left them unable to produce enough H100 and H200 models.
This situation also allows Nvidia to increase their profit margins significantly, capitalizing on the disparity between demand and the media frenzy surrounding them.
DeepSeek serves as a prime example of how out of touch mainstream media can be.
All DeepSeek did was replicate Chat GPT.
Training models requires substantial computing power. The panic surrounding Nvidia and other semiconductor companies is quite amusing; the demand for computing power is skyrocketing!
The gap between the reality of the AI mega-trend and the narrow focus of mainstream media is staggering! It's astonishingly out of touch! Just as out of touch as Cramer was when he declared META was done at $100, or when he thought Chat GPT would obliterate Google at $88.
Stock prices fluctuate between being overvalued and undervalued. While we have metrics like EGF and PE ratios to assess valuation, indicating that Nvidia is currently inexpensive, this doesn't guarantee it won't drop further. However, it is generally wiser to buy stocks when they are cheap rather than when they are costly.
The greater the deviation from the high then the greater the BUYING OPPORTUNITY being presented for the very best leading companies.
The key takeaway is that the deeper Nvidia falls during its corrections, the more advantageous it could be.
Those who are experiencing anxiety during these declines may find themselves selling at a loss, or for a marginal profit possibly around previous highs, while the stock has the potential to rise to $228 and beyond.
The potential for growth is significant; the $228 Fibonacci extension may not represent the peak. Attempting to predict a top for Nvidia could be misguided. Once it reaches $228, Nvidia might maintain a valuation similar to its current $130 level.
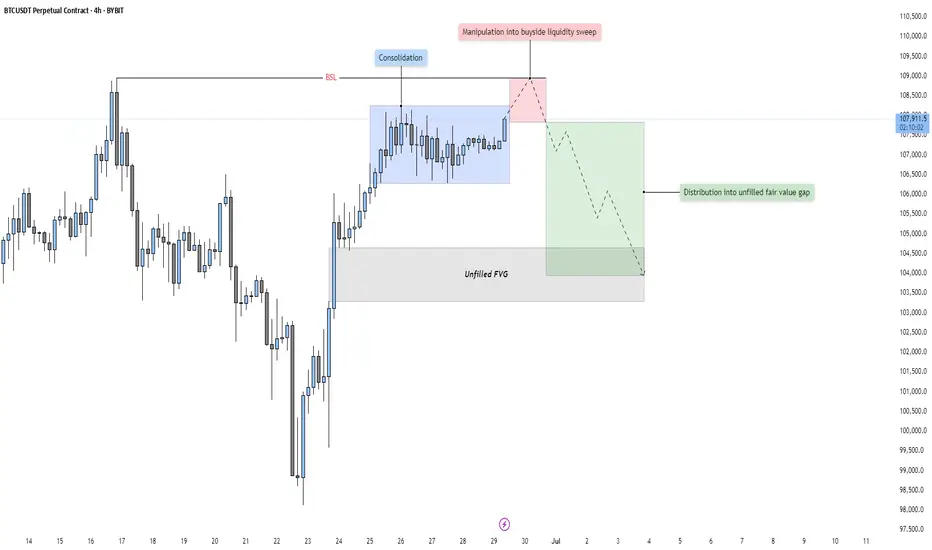
BTC - Consolidation, Manipulation & DistributionMarket Context
The current price action unfolds within the broader structure of a bullish leg that began after a sharp reversal near 97,000. This impulsive rally created a clear Fair Value Gap on the 4-hour chart—left behind as price surged upward with minimal resistance. Following this move, the market entered a consolidation phase, forming a range that has now broken to the upside. This kind of breakout often attracts breakout traders, but in this case, the context signals something more calculated.
Buy Side Liquidity Sweep Following Consolidation
The breakout above the consolidation range led directly into a Buy Side Liquidity Sweep, as price ran the highs just above the marked range. These highs acted as a magnet for liquidity—stop losses from short sellers and buy stops from breakout traders were likely pooled in that area. The quick rejection following this sweep suggests the move was not backed by genuine demand, but rather served the purpose of liquidity collection by larger players.
Manipulation and Distribution
This is a textbook example of manipulation into liquidity. Price was engineered to move upward into a zone of interest, taking out the Buy Side Liquidity before sharply reversing. The strong rejection signals distribution—institutions likely offloaded positions into the influx of late buyers. This kind of pattern often precedes a larger markdown, particularly when followed by lower timeframe bearish structure breaks.
Unfilled Fair Value Gap as a Draw
Beneath the price lies an unfilled Fair Value Gap, a zone of imbalance left behind by the earlier impulsive move. These areas often act as magnets for price, especially once liquidity objectives to the upside have been completed. Now that the sweep has occurred and distribution is underway, there is a strong probability that price will begin to seek rebalancing within this Gap. The area between 104,000 and 103,500 stands out as a high-probability target for the next leg down.
Execution Insight
If you're looking to enter short, it may be wise to wait for confirmation on a lower timeframe—such as a bearish break of structure or an internal Gap forming during the retracement. A 5-minute timeframe can often give early signs of rejection or supply stepping in. Being patient and allowing the market to reveal intent is crucial, especially after liquidity-driven moves like this.
Final Thoughts
Price doesn’t move randomly—it seeks liquidity and fills inefficiencies. This chart beautifully illustrates that logic, from engineered consolidation to a manipulative sweep, and now potentially toward rebalancing.
If you found this breakdown helpful, I’d really appreciate a like—it helps support the work and keeps this kind of content going. Let me know in the comments what you think, or if you’re seeing it differently. I'm always up for a good discussion.
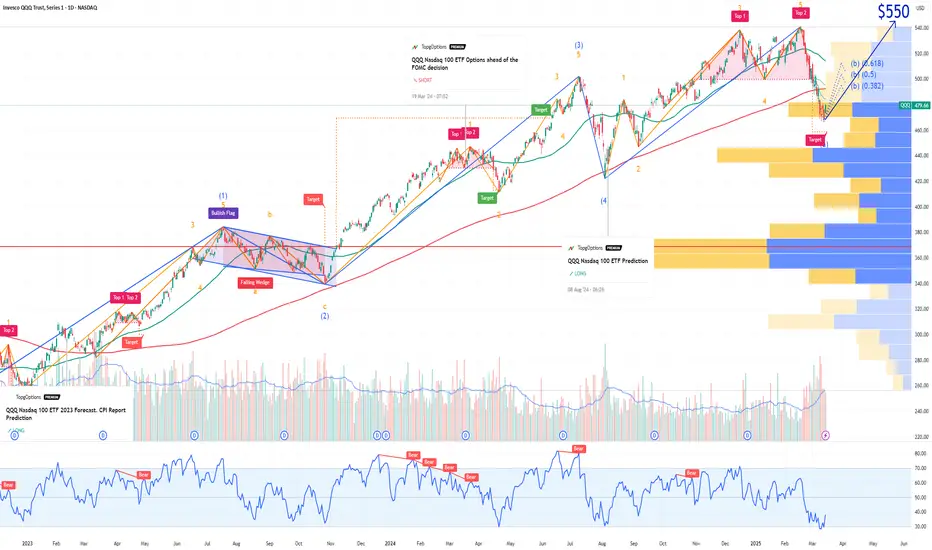
QQQ Nasdaq 100 Year-End Price Target and Technical Rebound SetupIf you haven`t bought the previous oversold area on QQQ:
Now the Nasdaq-100 ETF (QQQ), which tracks the performance of the largest non-financial companies in the Nasdaq, has recently entered oversold territory, suggesting that a technical rebound may be imminent. Similar to the Russell 2000, QQQ has experienced significant selling pressure, driving key technical indicators into oversold zones and creating favorable conditions for a bounce.
The Relative Strength Index (RSI) has dropped below 30, a level that typically signals oversold conditions and the potential for a reversal. Additionally, QQQ is trading near key support levels, with a large portion of its components underperforming their 50-day and 200-day moving averages — a classic setup for a mean reversion rally.
From a historical perspective, QQQ has shown a tendency to rebound strongly after similar oversold conditions, particularly when macroeconomic factors stabilize and buying pressure returns. Given the current technical setup, my price target for QQQ is $550 by the end of the year. This represents a recovery of approximately 8-10% from current levels, aligning with previous post-oversold rallies in the index.
While downside risks remain — including potential volatility around Federal Reserve policy and broader economic data — the technical backdrop suggests that QQQ is well-positioned for a recovery in the coming months.
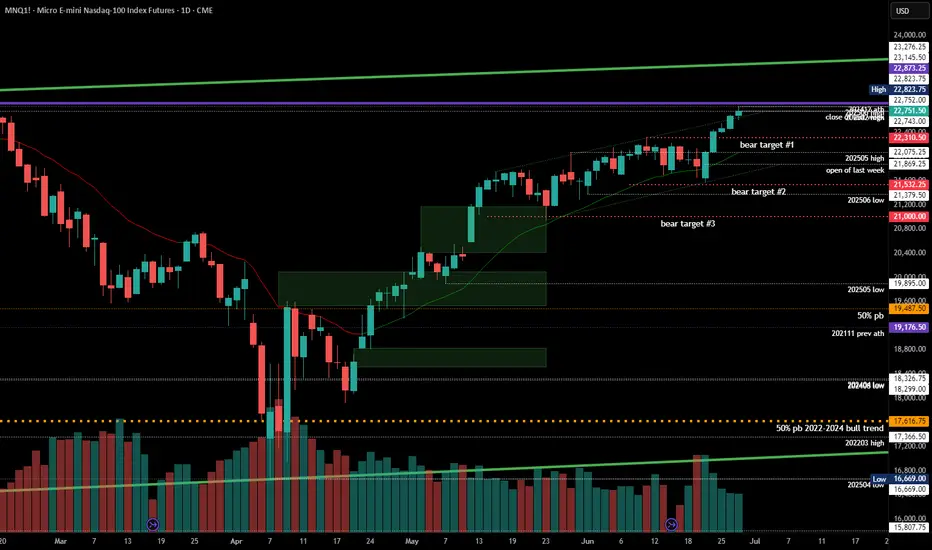
NASDAQ: Minor Pullback, Still on TrackOn Friday, the Nasdaq experienced a slight pullback, which was quickly absorbed at the start of the week. Currently, the index is still developing the turquoise wave B, which should top out just below resistance at 23,780 points, signaling the start of the bearish wave C. This move should lead to the low of the magenta wave (4) within our turquoise Target Zone between 17,074 and 15,867 points. Alternatively, there is a 42% probability that wave alt.(4) is already complete. In this scenario, the magenta wave alt.(5) could carry the index immediately above the mentioned resistance.
📈 Over 190 precise analyses, clear entry points, and defined Target Zones - that's what we do.

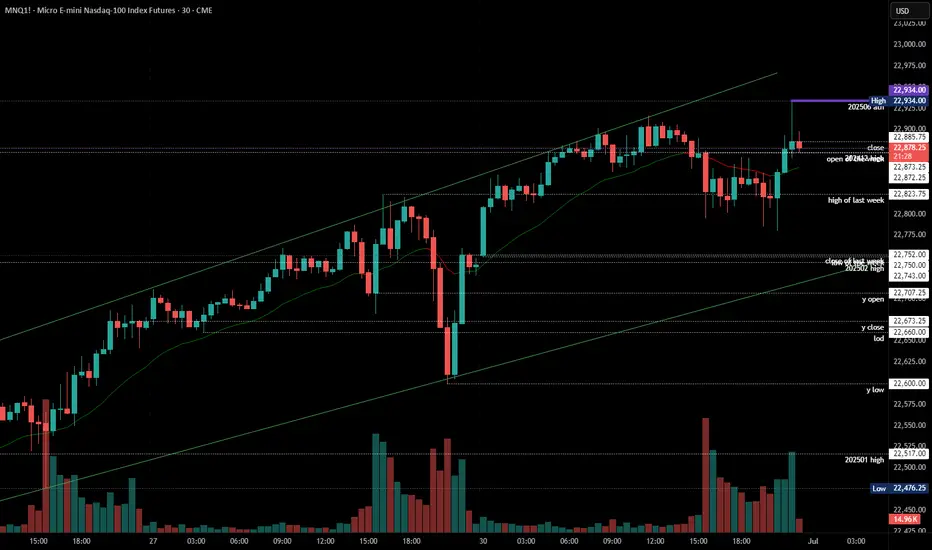
2025-06-30 - priceactiontds - daily update - nasdaqGood Evening and I hope you are well.
comment: Closing this high at the end of the month is as bullish as it gets. We are close to 23000 that I expect it to get hit. You never know where the top will be, so don’t try to pick it. Market is bullish and bullish only. Even if we print -2% tomorrow, there was no setup and no pattern for you to trade it on. It would be a huge bear surprise and you should never worry about them. Look for the path of least resistance and that is still long. At least for scalps. Bull channel is also still valid until clearly broken, which means a strong print below 22700 would do.
current market cycle: bull trend
key levels: 22600 - 23000
bull case: Bulls want 23000. Market is overbought but that does not matter if we can’t get more selling pressure. Long the pullbacks until it stops working. I can see this going to 23500 but it’s a rough guess and you should not trade based on those.
Invalidation is below 22200.
bear case: Bears got nothing. Don’t look for shorts. Daily close below 22600, then we can start thinking about lower prices again. I still expect this breakout to fail but as of now, we are only going up.
Invalidation is above 23500.
short term: Neutral but I will only scalp long until we see much much bigger selling pressure. 23000 is the obvious target and bears need something below 23700.
medium-long term - Update from 2024-06-29: No change in plans. I expect 20000 to get hit over the next 3 months and maybe 19000 again.
trade of the day: Any long around the high of last week (22823) has been profitable. It was a tight trading range but with a heavy bullish bias going in to today, long scalps were the obvious choice.
NASDAQ Possible short-term pull-back.Last time we analyzed Nasdaq (NDX) was a week ago (June 23, see chart below), giving a comfortable buy signal as the price was rebounding at the bottom of the 6-week Channel Up:
The price hit our 22300 Target and has now touched the top of the Channel Up. Based on the 4H RSI, it resembles the May 15 price action, which soon after pulled back to the 0.382 Fibonacci retracement level.
It is possible to see such relief profit taking on the short-term and a test of 22200 (Fib 0.382).
-------------------------------------------------------------------------------
** Please LIKE 👍, FOLLOW ✅, SHARE 🙌 and COMMENT ✍ if you enjoy this idea! Also share your ideas and charts in the comments section below! This is best way to keep it relevant, support us, keep the content here free and allow the idea to reach as many people as possible. **
-------------------------------------------------------------------------------
Disclosure: I am part of Trade Nation's Influencer program and receive a monthly fee for using their TradingView charts in my analysis.
💸💸💸💸💸💸
👇 👇 👇 👇 👇 👇
USNAS100 |Bullish Trend Holds Above Pivot – Eyeing 22790 & 23000USNAS100 | Bullish Movement
The price has stabilized above the key pivot level at 22640, confirming a continuation of the bullish trend toward the next resistance at 22790.
As long as the index remains above 22640, the uptrend is expected to extend toward 22790 and potentially 23000, with minor pullbacks likely to retest the pivot.
Currently, USNAS100 is consolidating between 22640 and 22790.
A 1H candle close below 22640 would signal a bearish correction toward 22520 and possibly 22410.
Pivot Line: 22640
Resistance Levels: 22790, 23000
Support Levels: 22520, 22410
previous idea:

NAS100 - The stock market is breaking the ceiling!The index is above the EMA200 and EMA50 on the four-hour timeframe and is trading in its medium-term channels. If it does not increase and corrects towards different zone, it is possible to buy the index near the reward.
Following a strong rally in U.S.equities, the S&P 500 and Nasdaq indices both achieved new all-time highs on Friday. It marks the first time since February that the S&P 500 has surpassed its previous peak, while the Nasdaq entered fresh price territory for the first time since December.
Despite ongoing market focus on economic data and the Federal Reserve’s interest rate policy path, the simultaneous surge in both indices reflects a renewed appetite for risk in the stock market—an appetite that has been accelerating since mid-April, especially in tech stocks.
In contrast, the Russell 2000 index, which tracks small-cap U.S. companies, still remains significantly below its prior high. To return to its October levels, it would need to rise over 13.5%. However, Friday’s 1.7% gain suggests capital is beginning to flow more broadly into underrepresented sectors.
Analysts argue that a strong breakout in the Russell 2000 could signal a broader rotation toward increased risk-taking—possibly driven by optimism over future rate cuts, easing inflation, and improved business conditions in the second half of the year.
Now that the S&P 500 has reached new highs and the Nasdaq has joined in, attention turns to the Russell 2000. If it begins to accelerate upward, markets could enter a new phase of sustained bullish momentum.
Following a week focused on gauging U.S. consumer spending strength, the upcoming holiday-shortened week (due to Independence Day) will shift attention to key employment and economic activity data.
On Tuesday, markets await the ISM Manufacturing PMI and the JOLTS job openings report. Wednesday will spotlight the ADP private employment report, and Thursday—one day earlier than usual due to the holiday—will see the release of several crucial figures, including the Non-Farm Payrolls (NFP), weekly jobless claims, and the ISM Services Index.
Currently, investor reaction to Donald Trump’s tariff commentary has been minimal. Market participants largely believe that any new tariffs would have limited inflationary effects and that significant retaliation from trade partners is unlikely.
Friday’s PCE report painted a complex picture of the U.S. economy. On one hand, inflation remains above ideal levels; on the other, household spending is showing signs of fatigue—a combination that presents challenges for policymakers.
Inflation-adjusted personal consumption fell by 0.3%, marking the first decline since the start of the year and indicating a gradual erosion of domestic demand. While wages continue to rise, their impact has been offset by declining overall income and reduced government support. To maintain their lifestyle, households have dipped into their savings, driving the personal savings rate down to 4.5%—its lowest level this year.
On the inflation front, the core PCE price index—the Fed’s preferred inflation gauge—rose 2.7% year-over-year, slightly above expectations. Monthly inflation also increased by 0.2%. Although these figures appear somewhat restrained, they remain above the Fed’s 2% target, with persistent price pressures in services—particularly non-housing services—still evident.
Altogether, the data suggest the U.S. economy faces a troubling divergence: weakening household income and consumption could slow growth, while sticky inflation in the services sector—especially under a potential Trump tariff scenario—could limit the Federal Reserve’s ability to cut interest rates.
NASDAQNASDAQ If the price cannot break through the 22728 level, it is expected that the price will drop. Consider selling the red zone.
🔥Trading futures, forex, CFDs and stocks carries a risk of loss.
Please consider carefully whether such trading is suitable for you.
>>GooD Luck 😊
❤️ Like and subscribe to never miss a new idea!
#202526 - priceactiontds - weekly update - nasdaqGood Evening and I hope you are well.
comment: Similar to dax and for most other markets. Cash index made a new ath and broke strongly above the trading range. This is W5 which I thought was cut short but I guess not. It’s most likely the end of the trend since the trading range went on for about 6 weeks, which in this case was likely the final flag. Futures could now aim to print 23000 and touch the bull trend line which began in 2021 and went though the ath from 2024-12.
current market cycle: resumption of the bull trend but likely the final flag and we most likely will top out here around/under 23000
key levels for next week: 22000 - 23000
bull case: Bulls printed 5 consecutive bull bars. They are in full control and could pump it to 23000. Purely based on momentum and squeezing shorts. Got nothing else for the bulls.
Invalidation is below 21500
bear case: Bears gave up on Monday and I doubt they want to fight this until we hit the bull trend line or 23000. Most bears will wait for a clear topping sign that bulls are beginning to take bigger profits before they think about shorts. As of now, bears have zero arguments on their side. Only a daily close below 22300 would confirm this bull trap and fake breakout above the bull channel and then we could test down to 21900ish but for now I think it’s most likely we go higher.
Invalidation is above 23100
short term: Neutral. Will only scalp longs on huge momentum and I will only start thinking about shorts once we break below 22300 again.
medium-long term - Update from 2024-06-29: No change in plans. I expect 20000 to get hit over the next 3 months and maybe 19000 again.
NASDAQ 100 TECH HEIST: Bullish Loot Before the Bear Trap!🚨 E-MINI NASDAQ 100 HEIST: Tech Rally or Bear Trap? (Thief Trading Blueprint) 🚨
🌟 Hola! Oi! Bonjour! Hallo! Salam! 🌟
Attention all Market Bandits & Tech Raiders! 🏴☠️💻💰
🔥 Thief Trading Intel: We're targeting the E-MINI NASDAQ 100 for a bullish loot grab! Long entry only—high-risk Red Zone ahead: overbought, consolidating, and primed for a reversal. Don’t let the bears ambush your profits!
"Claim your tech treasure and run—you’ve earned this steal!" 💰🚀
🚪 ENTRY: The Tech Vault is Open!
📈 "Swipe bullish loot at any price—the heist is LIVE!"
Buy Limit orders at recent swing lows/highs (15-30 min TF).
📌 Pro Thief Move: SET ALERTS! Don’t miss the breakout.
🛑 STOP LOSS: Escape Plan
📍 Thief SL (Smart Crew): Recent swing low (20,700.00, 4H TF).
📍 Adjust based on your risk, lot size, and orders.
🎯 TARGET: Loot & Exit!
🎯 22,600.00 (or bail early if the market flips!)
⚡ SCALPERS’ QUICK HIT
👀 Long scalps ONLY!
Deep pockets? Raid now.
Light wallet? Join swing traders.
Trailing SL = Your Profit Shield! 🛡️
📢 WHY THIS HEIST? (NASDAQ Bullish Momentum)
Tech rally brewing! Key drivers:
Fundamentals (COT, Macro, Geopolitics)
Sentiment & Intermarket Trends
Index-Specific Analysis & Positioning
🔗 Full intel? Bio linkss checkk! 👉🏻👉🏻👉🏻
⚠️ WARNING: News = Danger Zone! 📡🚨
Tech news moves FAST! Protect your loot:
❌ Avoid new trades during news.
🔒 Trailing SL = Lock profits.
💖 SUPPORT THE TECH HEIST CREW!
💥 SMASH THAT BOOST BUTTON! 💥
More boosts = bigger future heists!
Stronger crew = more $$$ for all!
Profit daily with Thief Trading Style! 📈🏆
Next tech raid coming soon—stay tuned! 🖥️🤑
US100 (NASDAQ) BREAKOUT BLUEPRINT: LOOT LIKE A SMART TRADER!🔥 NASDAQ 100 HEIST: STEAL THE TREND LIKE A MARKET BANDIT! 🚨💰
Locked & loaded for the US100 (NASDAQ 100) heist? This slick blueprint cracks the code to loot profits—blending killer technicals with macro intel. Ride the bullish wave, but dodge traps near the Overbought Zone. Bears lurk, so secure your bag before the reversal hits! 🐻💨
🎯 ENTRY: STRIKE LIKE A PRO THIEF
Long the breakout near 21,500.0 (or ambush pullbacks at 20,400.0 & 19600.0).
Set stealth alerts to catch moves in real-time. 🕶️🔔
🛡️ STOP LOSS: ESCAPE ALIVE
Hide stops under the last 4H swing low/wick—no reckless bets!
Adjust for your risk—survivors play smart. ⚡
💸 TAKE PROFIT: VANISH WITH THE LOOT
Main Target: 22,250.0 (or bail early if momentum fades).
Scalpers: Trail stops & ghost out with quick wins. 🏃♂️💨
📡 WHY THIS HEIST WORKS
NASDAQ 100’s on fire: Fundamentals + COT data + macro tides align.
Sentiment’s bullish, but stay sharp—links below for the full intel. 🔍🌐
⚠️ WARNING: NEWS = POLICE SIRENS
Avoid new trades during high-impact news. 📢
Lock profits with trailing stops if you’re already in. 🔐
🤝 JOIN THE TRADING MAFIA
Smash LIKE, drop a comment, & let’s dominate the US100! �
Ready for the next big move? Stay tuned. 👀
Happy hunting, chart pirates! 🏴☠️📉

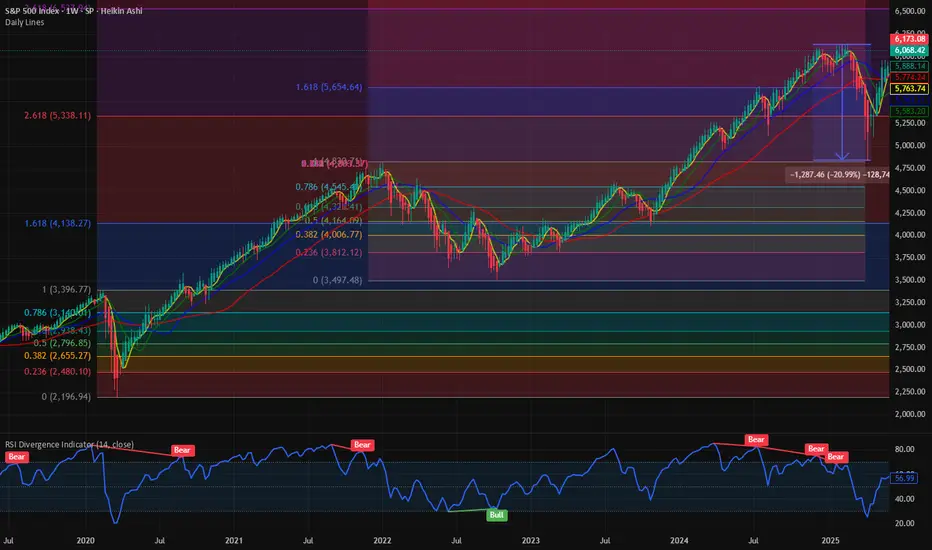
$SPX Path of least resistance is higher. Next Stop : 6500 This week we officially recovered all the losses from the liberation day low. We had a 20% bear market crash and since then there has been a V shaped rally in the major averages. NASDAQ:QQQ and SP:SPX have fully recovered the losses and then some. It is 0% form its ATH. We have been closely following the chart of SP:SPX for the last few weeks and have marked various Fib Retracement levels and Fib Extenstion. IN my opinion the Covid lows were one of the majot drawdown moments.
If we plot the Fib Extension on the COVID highs and lows, we can clearly see the Support and Resistance zones. As per the Fib Levels the next consequential level in SP:SPX will be 6550, which is the 3.618 Fib level. That I would suggest as the path to least resistance. First, we go higher before we can see any major correction. In case of a Major correction, we get support @ 5300.
Verdict : SP:SPX goes higher first before correction. 6550 is the next stop.
NASDAQ Potential UpsidesHey Traders, in today's trading session we are monitoring NAS100 for a buying opportunity around 22,380 zone, NASDAQ is trading in an uptrend and currently is in a correction phase in which it is approaching the trend at 22,380 support and resistance area.
Trade safe, Joe.
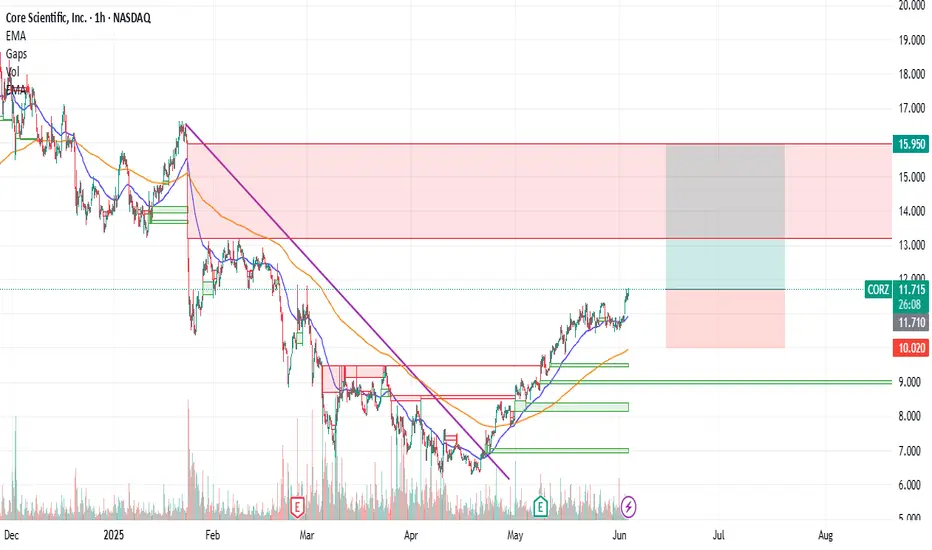
CORZ : Long Position with 2.5 Risk Reward RatioOur stock is trading on 50 and 200 period moving averages. (Timeframe : 1H)
Our first target level could be the level where the gap closes.
Stop - Loss can be placed around the 200 period moving average. Summary in light of this brief information:
Risk/Reward Ratio : 2.51
Stop-Loss : 15.95
Take Profit Level : 11.745
Edit : Sorry, I couldn't pull down the end of the trend line, so it was a slightly crooked trend line, but it doesn't ruin the main idea.
Regards.
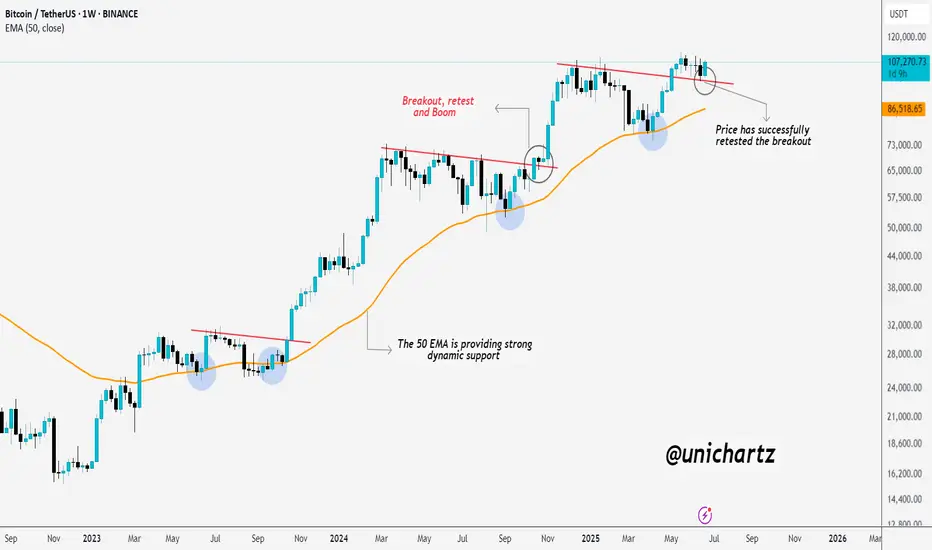
Bitcoin Bounced Right Where It ShouldBitcoin continues to respect the script — breakout, clean retest, and now holding strong.
The 50 EMA has been a reliable dynamic support throughout the entire uptrend, and once again, it helped catch the recent dip. Price has now successfully retested the breakout zone and is starting to bounce.
Structure looks healthy, momentum is building, and unless the support fails, the next leg up could be just around the corner.
Simple setups. No noise. Just trend.
DYOR, NFA
BTC - Will the Bears finally get their chance?Buy Side Liquidity Sweep in Progress
Price is currently climbing toward a region densely packed with resting buy side liquidity, marked by multiple previous highs. The area around 108,900 to 111,000 is especially significant, with two clear liquidity pools stacked above recent swing highs. These levels are likely to attract price as market participants seek to trigger stop orders and induce fresh buying interest—setting the stage for a potential reversal.
Weakness in the Current Impulse
The recent rally has advanced with minimal retracement and virtually no visible Gaps. This lack of corrective structure often indicates imbalance and suggests the move is overextended. When price moves upward too cleanly, it tends to leave behind thin liquidity zones, making the entire leg vulnerable to a sharper correction once exhaustion sets in.
Fair Value Gap as a Draw Below
Below current price lies a prominent bullish Fair Value Gap around 104,000. This inefficiency was left unfilled during the last leg up and may now serve as a magnet for price. These types of Gaps are often revisited by the market in an effort to rebalance supply and demand, especially after aggressive moves that break structure to the upside.
Once the higher liquidity levels are swept, watch for a clear reaction—either a strong rejection or lower timeframe structure shift—which could signal that the top is in. If that shift materializes, price may begin a downward leg targeting the unfilled Gap below. The magnitude of the move, combined with the lack of structure on the way up, leaves plenty of room for corrective action.
For those looking to engage, waiting for confirmation on a lower timeframe—such as a break of short-term bullish structure or the formation of a bearish Gap—can help time entries more precisely. In setups like these, patience is key: let the Sweep play out, observe how price reacts, and only then consider stepping in.

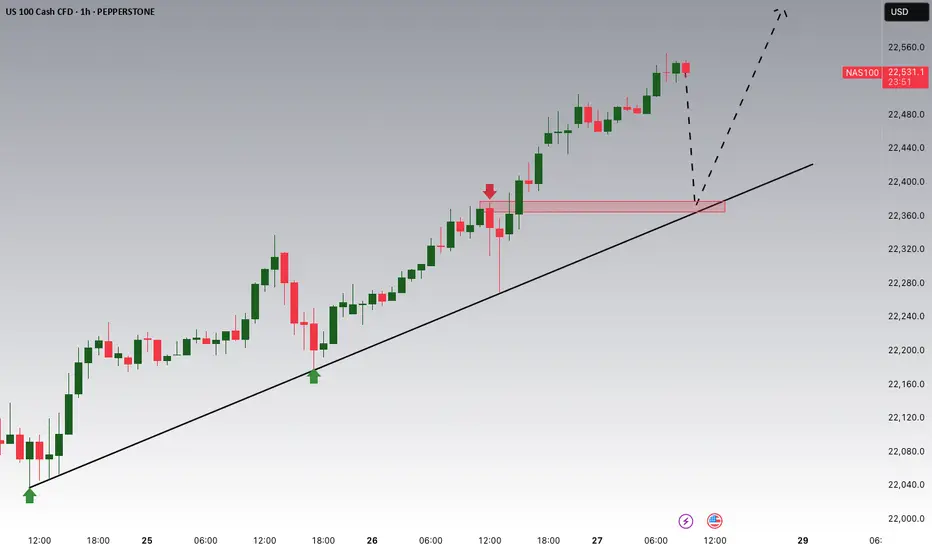
Nasdaq Hits New ATH at $22,570 – Eyes Now on $23,200 and $24,000By analyzing the #Nasdaq chart on the weekly timeframe, we can see that the index followed our previous analysis perfectly, hitting the $22,400 target and printing a new all-time high at $22,570!
Momentum remains strong and bullish, and we expect price to continue climbing toward the next targets. Based on the original projection, upcoming targets are $23,200 and $24,000.
Stay tuned for the next update!
Please support me with your likes and comments to motivate me to share more analysis with you and share your opinion about the possible trend of this chart with me !
Best Regards , Arman Shaban
USNAS100 Hits New ATH | Watch 22,520 for Possible Correction USNAS100 TECHNICAL OVERVIEW
Nasdaq 100 Prints New ATH | Eyeing 22,640, But Correction Risk Builds
USNAS100 recorded a new all-time high, supported by broad bullish sentiment across U.S. indices after upbeat S&P and inflation data boosted risk appetite.
Technically, the index remains bullish, but signs of short-term exhaustion are appearing.
If the price closes below 22,520 on the 1H timeframe, a correction toward the 22,280 zone is likely.
However, a clean break above 22,640 would confirm continuation toward the next upside target at 22,790.
Key Levels
Pivot Line: 22,520
Resistance: 22,640 → 22,790
Support: 22,410 → 22,280 → 22,200
Take a look at the previous idea to see more reality...

PCEs & attacks on PowellWe are carefully monitoring the PCEs today, to see, "wins" this small battle in the rate-lowering war. Let's dig in.
Let us know what you think in the comments below.
Thank you.
77.3% of retail investor accounts lose money when trading CFDs with this provider. You should consider whether you understand how CFDs work and whether you can afford to take the high risk of losing your money. Past performance is not necessarily indicative of future results. The value of investments may fall as well as rise and the investor may not get back the amount initially invested. This content is not intended for nor applicable to residents of the UK. Cryptocurrency CFDs and spread bets are restricted in the UK for all retail clients.

GRAB — Breakout Confirmation and Strong Upside PotentialGrab Holdings (GRAB) is currently forming a promising technical setup supported by a breakout from long-term consolidation. After printing a strong low and breaking out of a multi-year range, the price action confirms a bullish reversal with clear structure.
Technical Analysis
– Trendline breakout and bullish market structure shift
– Price is consolidating above the breakout level, forming a continuation zone
– Valid entries: market execution above $4.50 or limit orders near $4.00 support
– First profit target: $6.60 (around 40% growth)
– Second target: $10.15 (over 100% from entry)
The setup suggests increasing bullish momentum. A clean consolidation above previous resistance strengthens the case for a breakout continuation toward $6.60 and potentially $10.15.
Fundamental Backdrop
Grab is a Southeast Asian tech leader operating across ride-hailing, food delivery, and digital payments. The company continues to reduce losses, improve margins, and expand its fintech arm. With rising digital adoption in the region and a shift toward profitability, GRAB is gaining investor attention. Its most recent earnings report showed improving revenue trends and narrowing net losses — a strong signal of long-term sustainability.
Conclusion
Grab Holdings presents a well-aligned opportunity from both a technical and fundamental perspective. With a clear structure, breakout confirmation, and fundamental turnaround, this setup fits both swing and midterm investment strategies. Risk management is still key — stops should be placed below consolidation lows or key structure levels.
