NASDAQ READY TO CONTINUE THE LONG-TERM WEEKLY BULLISH RUN
FX:NAS100
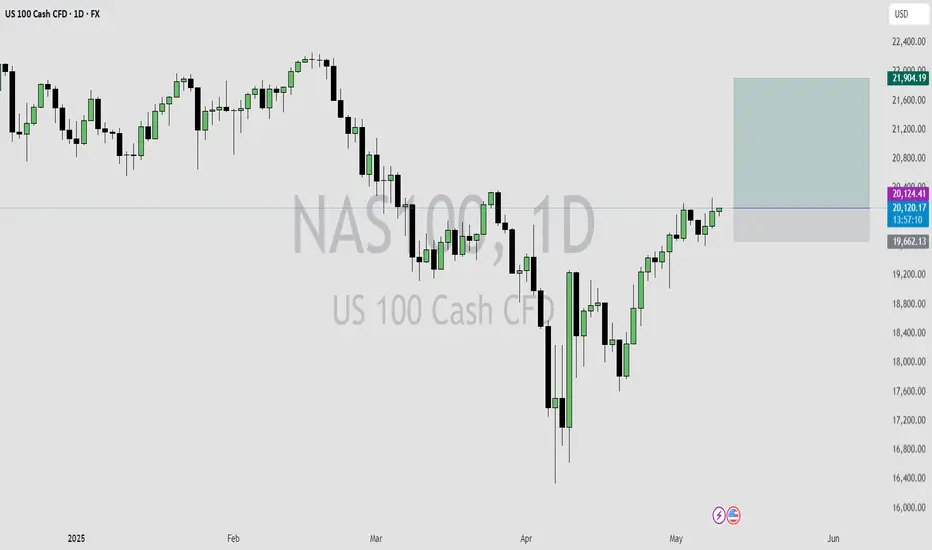
I just entered this buy trade on Nasdaq on the daily time frame.
The trade setup is a Swing trade following the monthly and weekly orderflow.
The Monthly is bullish, the weekly is also bullish, so I entered on the daily time frame retracement.
My overall take profit is a risk reward of 1:4.
Nasdaq
MicroStrategy another pull back before all time high?NASDAQ:MSTR analysis update..
📉 𝙇𝙤𝙣𝙜 𝙩𝙚𝙧𝙢 The weekly R5 pivot target is bold at $1500 but definitely possible as a max greed scenario when the triple tailwind of Bitcoin, SPY and Bitcoin treasury companies trends return.
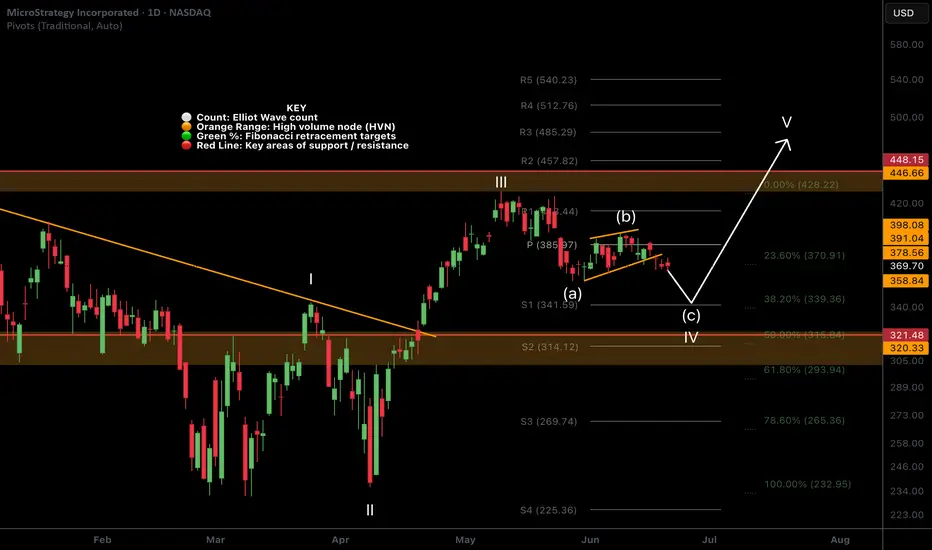
📉 𝙎𝙝𝙤𝙧𝙩 𝙩𝙚𝙧𝙢 retracement is expected to end around the S1 pivot at $341 and a secondary target of $321.
Irans conflict has investors shaken and not willing to hold assets over the weekend on the fear of worse. However, if the conflict is resolved soon investors could have a great buying opportunity.
𝙏𝙚𝙘𝙝𝙣𝙞𝙘𝙖𝙡 𝘼𝙣𝙖𝙡𝙮𝙨𝙞𝙨
Price appears to have completed wave (B) of an ABC correction in wave 4. Wave C is underway with an expected thrust down (such is the nature of wave C) towards the daily S1 pivot $341. This is also the 0.382 Fibonacci retracement, a high probability area for wave 4 to end. A deeper correction will bring up a triple shield of the High Volume Node, ascending daily 200EMA and 0.5 fibonacci retracement at £321.
Daily DEMA has death crossed.
Safe trading
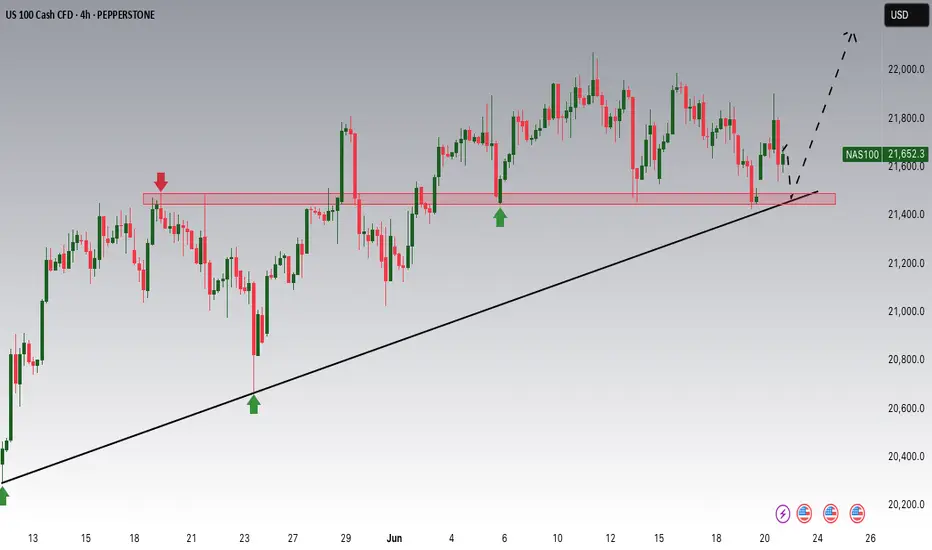
NASDAQ Potential UpsidesHey Traders, in the coming week we are monitoring NAS100 for a buying opportunity around 21,500 zone, NASDAQ is trading in an uptrend and currently is in a correction phase in which it is approaching the trend at 21,500 support and resistance area.
Trade safe, Joe.
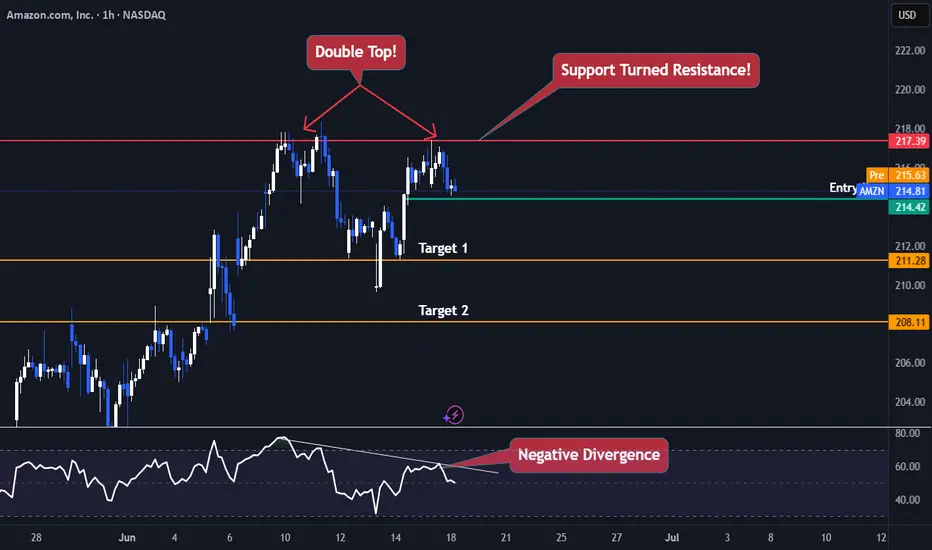
AMAZON TROUBLENASDAQ:AMZN Is currently trading Just 11% below its all time high and currently Facing exhaustion.
Amazon is currently trading 217$ range which was previous support now turned resistance (Daily Timeframe) , making a double top pattern and a negative divergence on the RSI.
The best Trades are the ones with multiple confirmations
- Trading at a resistance (1D chart)✅
- Negative Price Action at the resistance (Double Top Pattern)✅
- RSI negative divergence✅
- Market Structure ✅
Entry Criteria
- A Red candle at the entry Line Marked
- Stoploss Above the Entry Candle
Target 1- 211$
Target 2- 208$
Keep Your Risk Reward Intact! Not An investment Advice
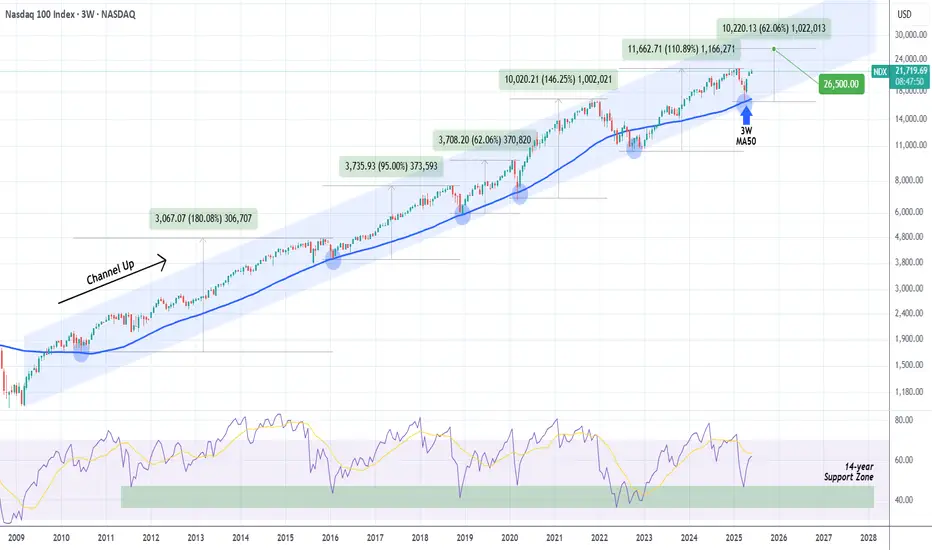
NASDAQ Long-term looks brighter than ever!Nasdaq (NDX) has been trading within a massive Channel Up since the bottom of the 2008 U.S. Housing Crisis and during the April 07 2025 bottom, a very distinct bullish signal emerged.
The index hit its 3W MA50 (blue trend-line) for the first time since May 2023. As you can see, since the 2008 Crisis, every time the market rebounded after hitting the 3W MA50, it posted a rise of at least +62.06% before the next time it touched it (and that was on the highly irregular COVID crash).
As a result, we expect to see NDX hit at least 26500 (+62.06%) before a new 3W MA50 test. Chances are we see the market move much higher though.
Note also the incredible bounce it made on the 3W RSI 14-year Support Zone.
-------------------------------------------------------------------------------
** Please LIKE 👍, FOLLOW ✅, SHARE 🙌 and COMMENT ✍ if you enjoy this idea! Also share your ideas and charts in the comments section below! This is best way to keep it relevant, support us, keep the content here free and allow the idea to reach as many people as possible. **
-------------------------------------------------------------------------------
💸💸💸💸💸💸
👇 👇 👇 👇 👇 👇
NASDAQ: Huge pivot can catapult it if broken.Nasdaq has turned neutral again on its 1D technical outlook (RSI = 54.712, MACD = 377..560, ADX = 20.644) as it has been struggling to cross above a hidden trendline, the Pivot P1 that was at the start of this Bull Cycle a support and after the trade war acts now as a resistance. If broken, we anticipate a +27.84% rise at least (TP = 28,440), which may very well be an end of year target.
## If you like our free content follow our profile to get more daily ideas. ##
## Comments and likes are greatly appreciated. ##

US100 / NASDAQ TodayUS100 / NASDAQ Today is still bearish
My SSM Reversal Pattern is comming.
This is just my view of course

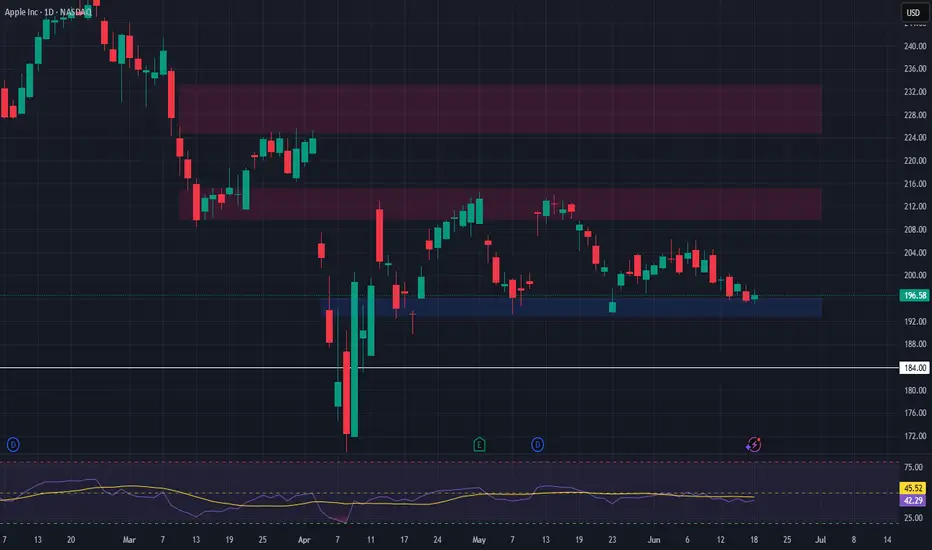
Apple Near Key Support — Long Setup DevelopingIntroduction:
Apple NASDAQ:AAPL is approaching a critical support zone that has consistently held over the past two months. As price retraces toward this level, it presents a potential long opportunity for traders looking to position ahead of the next bullish leg.
Technical Setup:
Support Zone: $193 – $196
This area has acted as a strong demand zone, providing multiple bounce points since April.
Price is now pulling back into this region, offering a potential entry for a long trade.
Trade Idea:
Entry: $193 – $196 (on confirmation of support holding)
Take Profit Targets:
First Target: $210 – $215
Second Target: $225 – $233
Stop Loss: Just below $184 (to protect against a breakdown from support)
#AAPL #Apple #Stocks #TechnicalAnalysis #SupportZone #LongSetup #TradingStrategy #NASDAQ #TechStocks #RiskReward
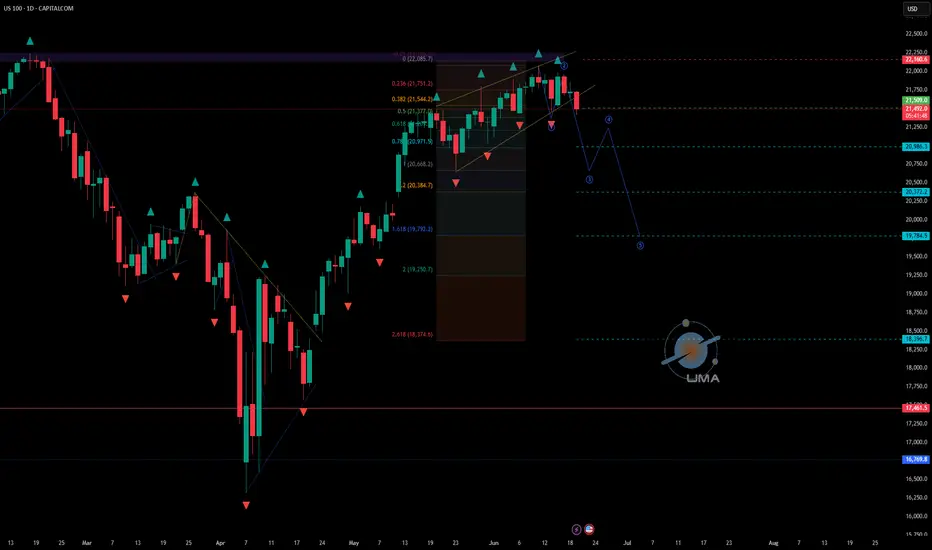
NASDAQ - UniverseMetta - Signal#NASDAQ - UniverseMetta - Signal
D1 - Formation of a narrowing diagonal + price broke through the lower trend line through a 3-wave structure. It is better not to increase risks. Stop behind the maximum of the 1st wave.
Entry: 21509.0
TP: 20986.3 - 20372.2 - 19784.5 - 18396.7
Stop: 22160.6
NASDAQ 2 Expected Scenarios Very Clear , Which One You Prefer ?Here is my opinion on Nasdaq on 4H T.F , The price still below my res so we can sell it if the price touch the res level again , and if we have a daily closure above my res then we can buy it with retest for the broken res , so it`s very easy if we still below the res we can sell and if we going up it we can buy it . but we need a daily closure above first .

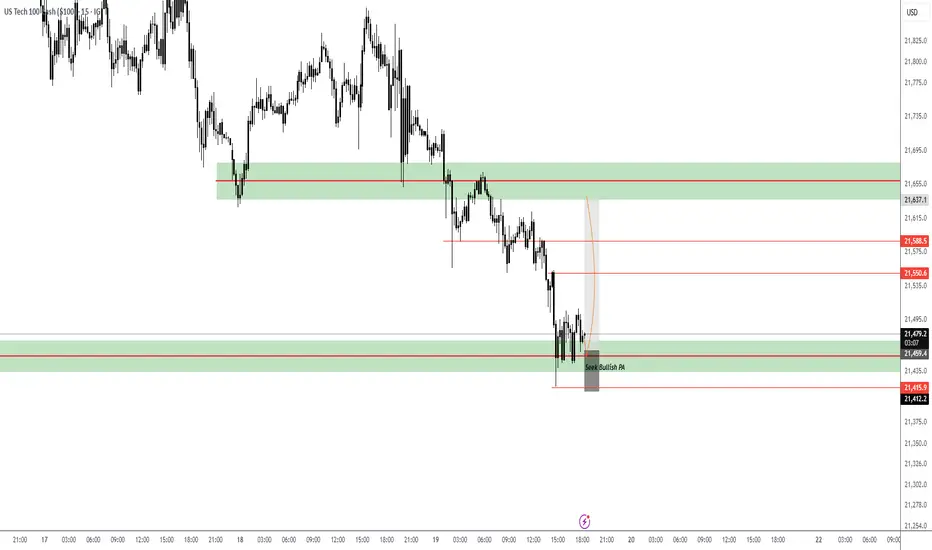
NASDAQ 100 Under Pressure –Watching 21470 Break for ContinuationUSNAS100 – Technical Overview
USNAS100 has reached the support level we highlighted yesterday and continues to trade within a bearish trend, especially after confirming a 1H close below 21635.
Bearish Outlook:
As long as the price remains below 21635, the next target is 21470.
A break below 21470 would confirm further downside toward the support zone at 21375 and 21250.
Bullish Scenario:
Bullish momentum may return if the price breaks above 21635 on the 1H timeframe, targeting 21780 and potentially 21930 and 22090.
• Support: 21470 / 21375 / 21250
• Resistance: 21780 / 21930 / 22090

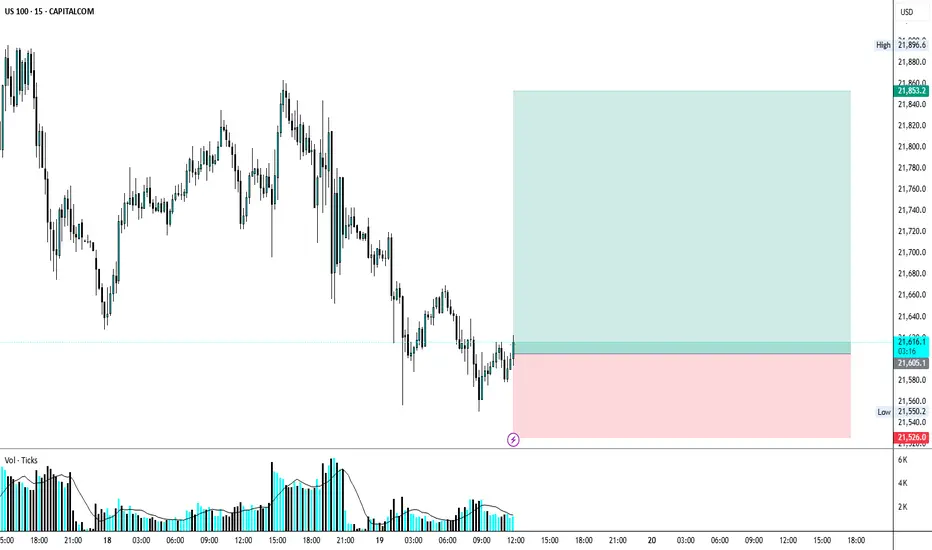
example of how to trade this is 1 ex of how to use alarms and think when u trade. identify high and lows setting alarms, triggers and setups , freeroll
Nasdaq - This starts the next +50% rally!Nasdaq - TVC:NDQ - might break out soon:
(click chart above to see the in depth analysis👆🏻)
Despite the quite harsh correction of about -25% which we saw in the beginning of 2025, the Nasdaq is clearly heading for new all time highs. It sounds almost incredible but if the Nasdaq breaks above the current confluence of resistance, a breakout rally of +50% will follow thereafter.
Levels to watch: $21.500, $33.000
Keep your long term vision!
Philip (BasicTrading)

Could Microstrategy be a 1 Trillion dollar mcap company?!Microstrategy and Michael Saylor evoke a spectrum of opinions, with analysts offering a diverse range of potential future valuations.
High risk, high reward!
The destiny of Microstrategy’s market capitalization is clearly linked to Bitcoin’s performance. The company has been utilizing debt to acquire the cryptocurrency, aiming to create significant spreads. This leverage is the reason why the stock has significantly outperformed Bitcoin throughout 2024.
I am confident that Bitcoin can indeed reach $200k, with a potential upper price target of $250K for this cycle, indicating a potentially explosive Q3 and Q4.
The lingering question is how much additional FOMO and premium Saylor can cultivate for his leveraged vehicle in such an environment?
That's why charting is such a key component to any personal investing strategy IMHO, as we navigate these markets.

NASDAQ Consolidation: Why Sitting Out Is Sometimes the Best PlayI'm currently monitoring the NASDAQ (US100) closely, and on the 4-hour chart, we can clearly see that the market is in a phase of consolidation 🔍
Yesterday, I was anticipating a bullish breakout, which could have signaled the start of a structure with higher highs and higher lows — something that would have presented a clean long opportunity 📈. However, during the U.S. session, the NAS100 momentum shifted and we instead saw a bearish breakdown, invalidating the previous setup 🚫
As things stand now, there's no clear directional bias on the 4H — just a sideways range with neither bulls nor bears in full control 🤝. This type of environment calls for patience and discipline.
It's worth noting that knowing when not to trade is just as important as knowing when to pull the trigger. Sitting on the sidelines and allowing the market to make the next move — whether that’s a break above or below this consolidation range — is a valid and often wise decision 🧘♂️📊
At the moment, my preference is to remain neutral and let price show its hand before committing to a position.
⚠️ Disclaimer:
This analysis is for educational purposes only and does not constitute financial advice. Always do your own research and apply proper risk management when trading.

NQ Bulls Teasing a Breakout – But Watch That 4H RSI Divergence We’re at a decision point here on NQ.
📌 Bullish case: We’ve got a clean inverse H&S on the 5-min sitting right on the weekly pivot. If we reclaim the daily pivot and the 30-min VWAP (red line), we could get a squeeze toward 21,960, where prior supply sits.
📉 Bearish case: A break below 21,650 cracks the head and confirms downside toward 21,480.
⚠️ Don’t ignore that 4H RSI divergence. Momentum is fading. If buyers want this, they’ve got to show up now.
📊 Timeframes used:
4H: macro momentum divergence
30M: chop zone with directional potential
5M: inverse H&S near key support
1M: low timeframe momentum shift
🔭 Scenarios plotted for both directions. Choose your trigger.
#nasdaq #futures #MNQ #tradingstrategy #priceaction #headandshoulders #vwap

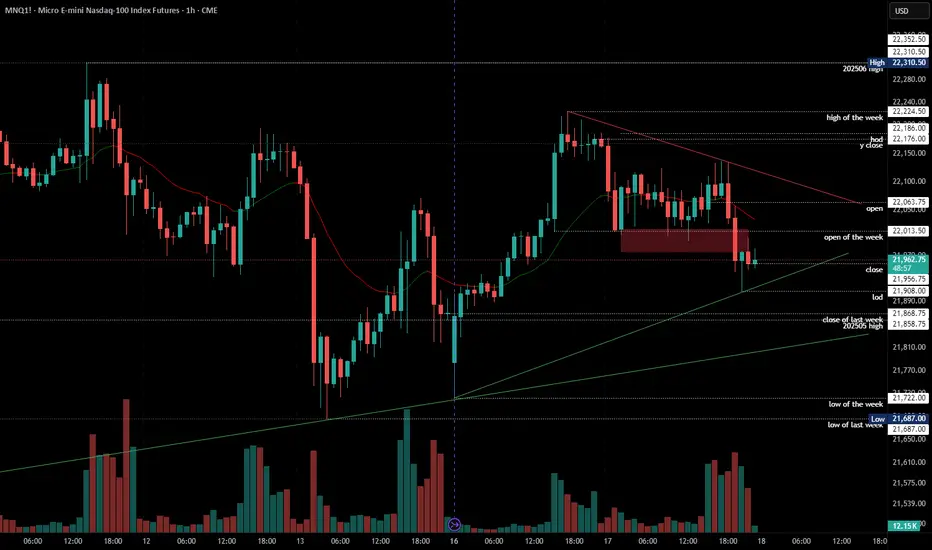
2025-06-17 - priceactiontds - daily update - nasdaq
Good Evening and I hope you are well.
comment: Big up, big down, big confusion. Market rallies 500 points yesterday and today we get a late bear breakout and close below 22000. Traps on both sides and I am not believing in bear strength what so ever. I see this as a triangle and 22000 is the middle. Chop chop.
current market cycle: trading range
key levels: 21700 - 22300
bull case: Bulls want to stay above 21900 and print a higher low to then re-test 22300. Today they were weak and let the bears close below 22000 which was unexpected, giving yesterday’s bullishness. Tomorrow we have FOMC and I doubt market can move far from 22000 tomorrow. Any longs closer to 21800 make sense.
Invalidation is below 21680.
bear case: Bears left behind a gap up to 22015 but I doubt it can stay open. We have to decent trend lines below us and bears would need to break strongly below 21900 to try and go for 800 or even 700. Bears do not have any arguments to go below 21700 so I won’t make up any. That doesn’t mean it can not happen but it’s unlikely.
Invalidation is above 22230.
short term: Completely neutral around 22000. Only interested in longs below 21900 and shorts closer to 22100.
medium-long term - Update from 2024-06-15: Daily close below 21450 is my validation for the new bear trend which has the first bigger target at 21000 but I think we will printed below 20000 again this year. Structure is obviously not yet bearish, so don’t be early if you want confirmation and can’t/won’t scale in to shorts higher.
trade of the day: Buy low, sell high and scalp. Clear range 22000 - 22100 and the late bear breakout was ok if you made your money before. I do think it was unusual that we did not close the gap to y close 22176.
NASDAQ 100 Bullish Breakout Potential: What to Watch NextI'm currently monitoring the NASDAQ 100 (NAS100) very closely. Building on yesterday’s outlook, we've now seen a clear bullish structural shift — price is holding firm above a recent higher high and higher low, suggesting the early stages of a potential trend continuation 📈
Zooming into the 30-minute chart, we can track price action more precisely. I’m watching for a decisive break above the current range high on this timeframe. If we get the break → retest → rejection pattern, this would confirm bullish momentum and provide a long opportunity 🚀
Should this scenario play out, we could also see JPY pairs strengthen to the upside, as a risk-on sentiment flows through the markets 🧭
🔍 This setup is developing — as always, patience and precision are key.

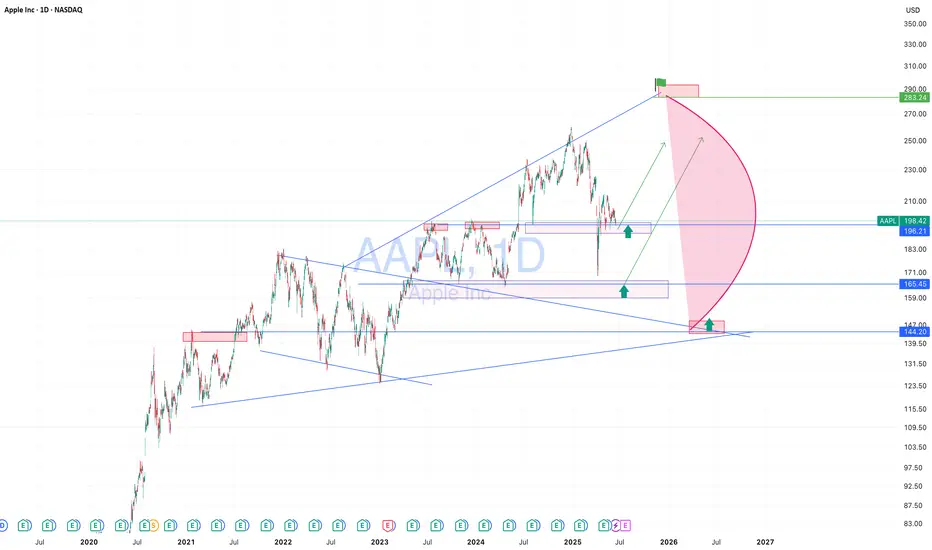
AAPL — Broadening Range and Accumulation Phase. Targeting $300Apple stock has been moving in a broadening pattern for an extended period, showing signs of accumulation. This price behavior suggests a potential bullish breakout. The upside target in the coming months is around $300, possibly by fall or winter. However, a corrective scenario remains on the table, with a potential pullback toward the $165–144 range, which could present a strong long entry opportunity. From a fundamental perspective, investor interest is likely to increase ahead of Apple’s expected product presentation in the fall, which historically supports bullish sentiment in the stock.
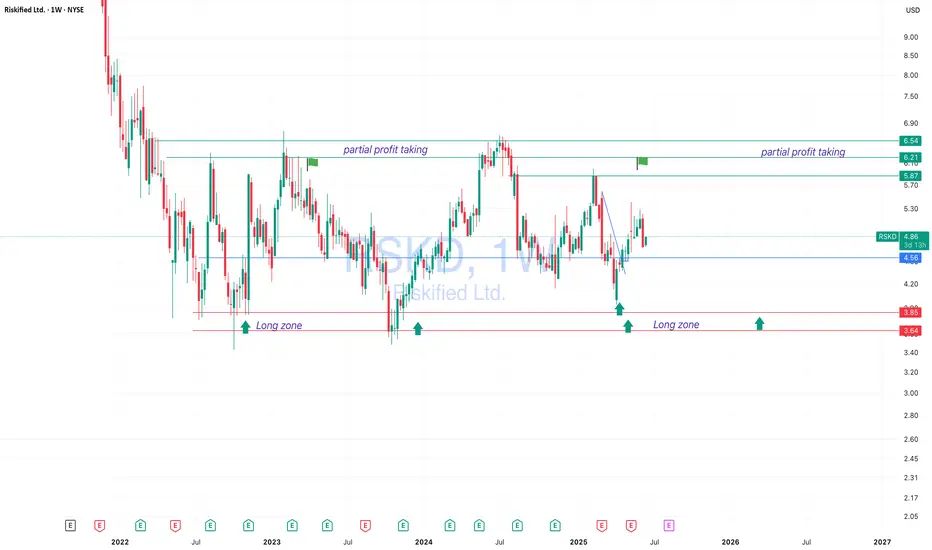
RSKD — 50–100% Return Potential Within a YearRiskified Ltd. (RSKD)
has been trading in a consistent long-term range, cycling between lows of 3.65–3.85 and highs of 6.20–6.54 approximately every 6 to 12 months.
This presents a swing opportunity with potential gains of up to 100%. We are currently mid-range and already in the trade, but as US indices show strength, additional buy setups may develop on retracements.
Fundamentally, investor interest in RSKD is supported by the growing demand for fraud prevention and identity verification solutions in e-commerce, client base expansion, and renewed attention to tech stocks during a potential sector recovery. Estimated holding time is 6–12 months.