NAS100 Trade Idea: Liquidity Sweep & Bullish Reversal Potential📊 NASDAQ 100 (NAS100) Trade Outlook 📈
The NASDAQ 100 is holding a strong bullish trend on the higher timeframes 🟢. However, we’re currently seeing a notable pullback into a key support zone ⚠️ — price has dipped beneath previous lows, tapping into what appears to be an institutional accumulation range 🏦.
This move is likely targeting the liquidity resting below those lows 💧, where sell stops are positioned. Price is also reacting off a significant bullish order block 🧱 — a confluence area that could produce a strong reversal.
🎯 What to look for next:
Wait for a bullish break in market structure 🔁 to confirm a potential entry. If that occurs, consider a long setup with your stop loss below the swing low 🛑 and a 1:2 risk-to-reward target 🎯.
🚫 This is for educational purposes only and not financial advice.
Nasdaq100

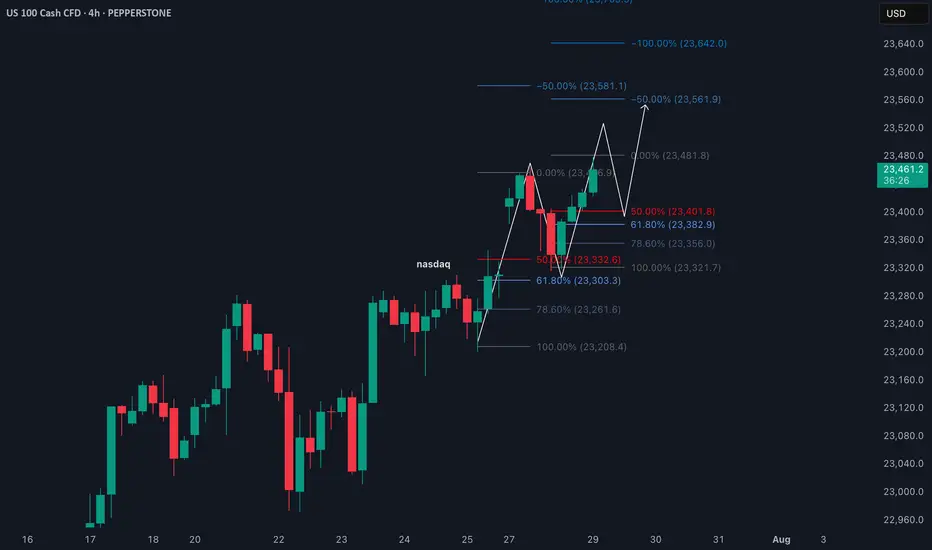
Fibonacci Retrace Strategy NAS100 Trade Idea📈 NASDAQ 100 (NAS100) is holding a strong bullish trend 🚀. After a weekend gap-up 🕳️➡️📈, price retraced back into the gap zone—exactly what you'd expect in a healthy trending market.
🔍 I'm applying my Fibonacci Expansion + Retrace Strategy 🔢, watching closely for a pullback into equilibrium ⚖️ within the previous price swing. That’s where I’ll be waiting for a bullish market structure break 🔓📊 to confirm my long bias.
🧠 Patience is key here—let the setup come to you.
📌 As always, this is not financial advice!
OUR TRADE TODAY ON NASDAQBeen a while since I last posted here, today I’m sharing with you our trade we took 15min ago with an RR of 3
Follow for more
$NDX 3rd Bearish EngulfingSlowly but surely we are seeing deteriorating conditions in every major indices.
NASDAQ:NDX closed and formed the 3rd BEARISH engulfing in 2 weeks, RARE!
Light volume so it's not definitive, but alarming.
TVC:DJI keeps weakening.
SP:SPX many RED candles & bearish engulfing as well.
Light volume though.

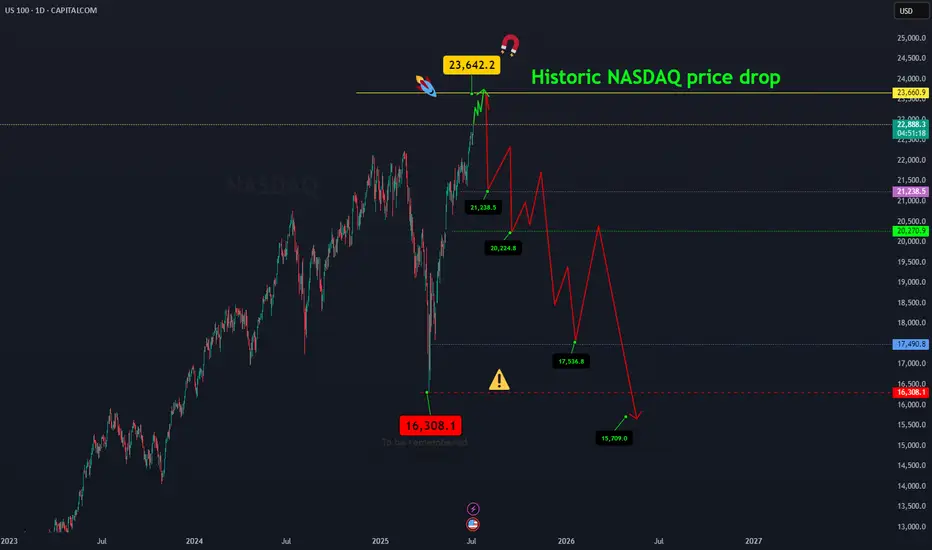
NASDAQ price dropAfter the Nasdaq price reaches around 23642.2, a historic drop will occur and the target is to drop to 16308.
Whatever happens at the highest price, the final destination is towards 16308.
I have identified the price levels in the middle of this expected drop that can cause the price to correct.
IG:NASDAQ
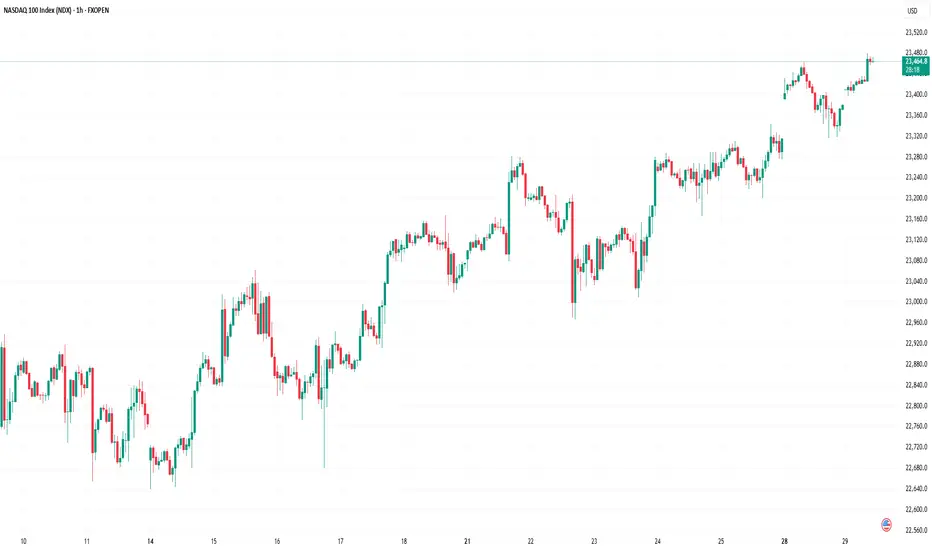
Nasdaq 100 Index Hits New Highs Ahead of Big Tech EarningsNasdaq 100 Index Hits New Highs Ahead of Big Tech Earnings
Earlier, we noted signs of optimism in the Nasdaq 100 index as the market anticipated earnings reports from major tech firms.
Now, companies such as Alphabet (GOOGL) and Tesla (TSLA) have already released their results (we previously covered their charts → here and here). Up next are the most highly anticipated earnings reports: this week, tech giants including Microsoft (MSFT), Amazon (AMZN), Meta Platforms (META), and Apple (AAPL) are set to publish their results. The combined market capitalisation of these four companies exceeds $11 trillion, and their reports could have a significant impact on a stock market that is already showing strong bullish sentiment:
→ The Nasdaq 100 index has climbed to an all-time high, surpassing the 23,400 mark.
→ The signing of trade agreements between the US and Europe (and earlier, Japan) has eased concerns about the negative impact of tariff barriers.
Technical Analysis of Nasdaq 100
The chart supports growing signs of optimism: earlier in July, the price remained within a rising channel (marked in blue). However, towards the end of the month, price action has begun to follow a steeper upward trajectory (marked in purple).
What could happen next? Much will depend on the earnings results and forward guidance from these tech giants.
On the one hand, continued enthusiasm around AI adoption could accelerate further growth. The stronger the optimism, the more fuel it may add to discussions around a potential bubble — with some analysts already drawing parallels to the dot-com era of the early 2000s.
On the other hand, earnings could temper market excitement and prompt a correction. For example, the index may retreat to the support level around 23,020, which is reinforced by the lower boundary of the blue trend channel.
This article represents the opinion of the Companies operating under the FXOpen brand only. It is not to be construed as an offer, solicitation, or recommendation with respect to products and services provided by the Companies operating under the FXOpen brand, nor is it to be considered financial advice.
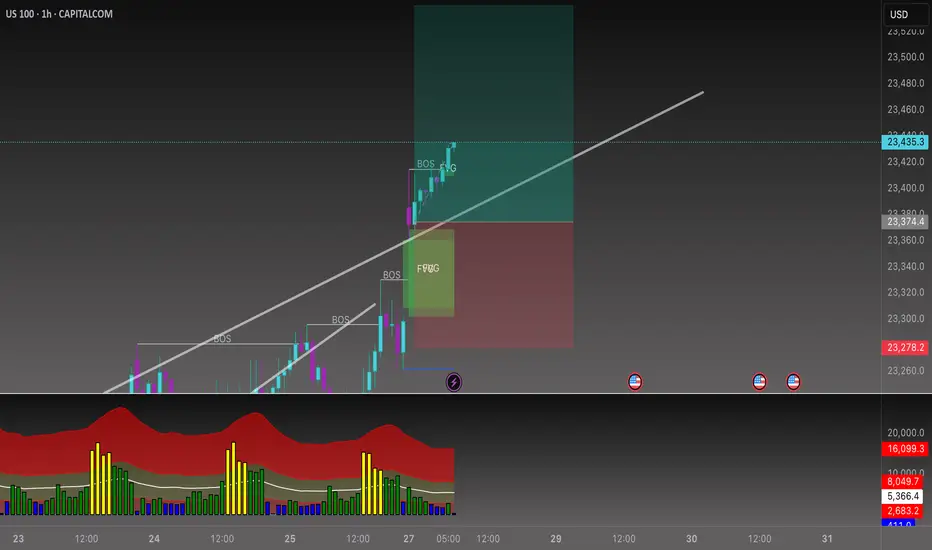
Beyond the Chart – NAS100 Through Technicals & Fundamentals📊 CAPITALCOM:US100 Analysis
Today, NAS100 opened with a huge gap up following former President Trump’s announcement that the U.S. has officially reached a trade agreement with the European Union.
🕳️ After price rejected the gap zone, and volume gets low low. I’m now looking for a potential test of the 23,540 level.
💼 With Q2 earnings season kicking off, stock-moving news will be hitting fast. While retail traders might scramble to catch up, smart money is already positioning for surprise earnings beats.
Stay sharp, this week could set the tone for the next major move.
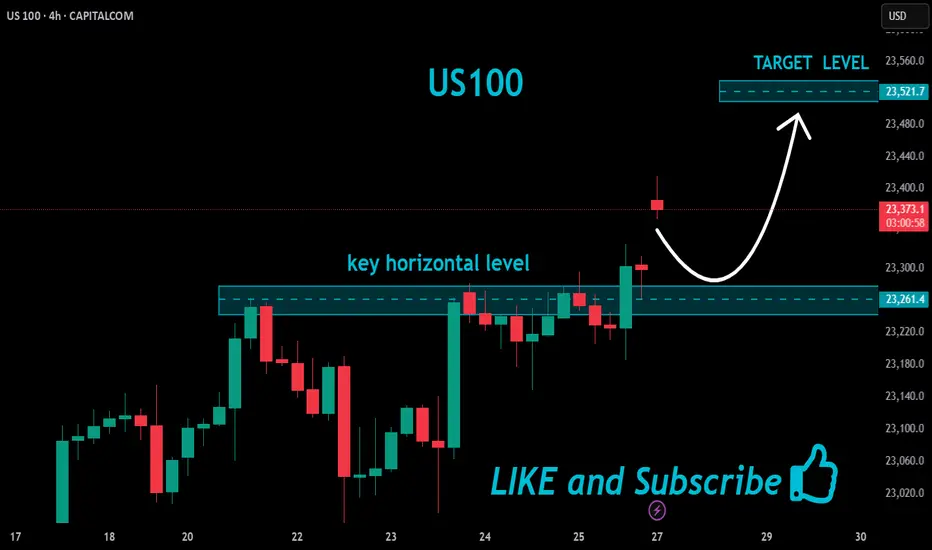
US100 Bullish Breakout!
HI,Traders !
#US100 is trading in a strong
Uptrend and the price made a
Bullish breakout of the key
Horizontal level of 23261.4
So we are bullish biased
And we will be expecting a
Further bullish move up !
Comment and subscribe to help us grow !
"NASDAQ 100 Heist – Scalp, Swing, or Hold? (Full Plan)🔥 NASDAQ 100 HEIST PLAN – BULLISH LOOT AWAITS! 🔥
🚨 Attention Market Robbers & Money Makers! 🚨
(Swing/Day Trade Strategy – High-Risk, High-Reward Play)
🎯 Mission Objective: Loot the NDX100/US100 (NASDAQ 100) Like a Pro!
Based on Thief Trading’s ruthless technical & fundamental analysis, we’re executing a bullish heist—targeting the Red Zone (high-risk, high-reward area).
⚠️ WARNING: Overbought market, consolidation zone, potential bear traps—weak bears may get slaughtered! Strong hands only!
🔐 ENTRY: The Vault is OPEN!
"SWIPE THE BULLISH LOOT!" – Any price is a steal, but smart thieves use:
Buy Limit Orders (15m-30m TF) near recent swing lows/highs.
DCA/Layering Strategy – Multiple limit orders for max loot.
Breakout Confirmation – Don’t jump in early; wait for the real move!
🛑 STOP LOSS: Protect Your Stash!
Thief’s SL Rule: Nearest 4H swing low (22,600) – WICK LEVEL ONLY!
DO NOT place SL before breakout! (Patience = Profit.)
Adjust SL based on risk, lot size, and number of orders.
🎯 TARGETS: Escape Before the Cops Arrive!
Main Take-Profit: 24,400 (or exit early if momentum fades).
Scalpers: Longs ONLY! Use trailing SL to lock in profits.
Swing Traders: Ride the wave like a true market pirate!
📰 FUNDAMENTAL BACKUP: Why This Heist Will Work
Bullish momentum in NDX100 driven by:
Macro trends (Fed, inflation, tech earnings).
COT Report & Institutional positioning.
Geopolitical & Sentiment Shifts.
Intermarket correlations (USD, Bonds, Tech Sector).
(Stay updated—markets change FAST!)
⚠️ TRADING ALERT: News = Danger Zone!
Avoid new trades during high-impact news.
Trailing SL = Your best friend.
Lock profits early if volatility spikes!
💥 BOOST THIS HEIST! 💥
👉 Hit LIKE & FOLLOW to strengthen our robbery crew!
🚀 More heists coming soon—stay tuned, thieves! 🚀

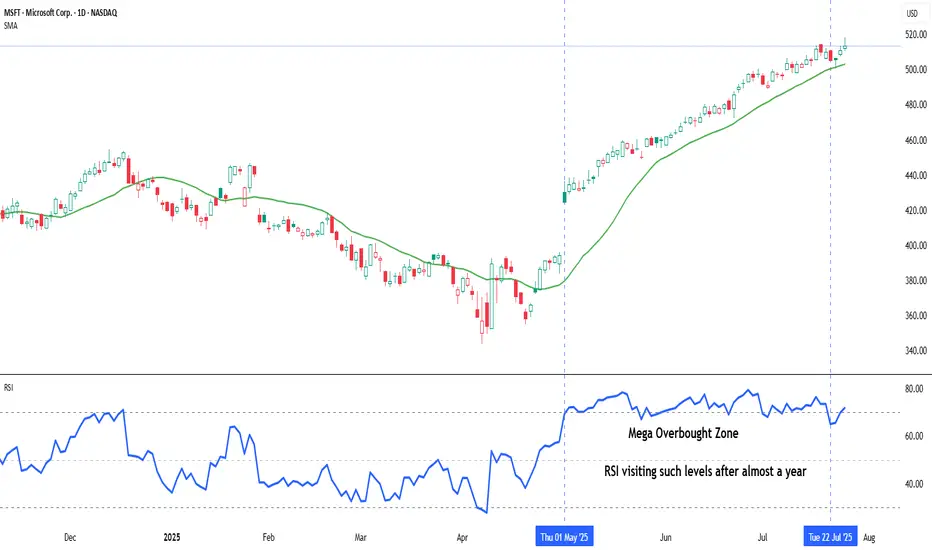
Indicator Decoded: RSI Mega Zones: Signals from the EdgeMost traders are familiar with the textbook RSI levels—70 indicating overbought and 30 indicating oversold. But markets, especially in strong momentum phases, do not always obey these boundaries. That is where the concept of Mega Overbought and Mega Oversold zones becomes vital. These are not fixed thresholds, but adaptive zones often beyond 80 and below 20, where the RSI reflects extreme strength or weakness. Rather than acting as reversal points, these levels often signal trend continuation.
A reading above 80 is typically seen during powerful uptrends or post-breakout rallies. It indicates not just buying, but unhesitating, aggressive demand, especially after key resistance zones have been cleared. Such RSI levels have often not been seen in several months—if not more than a year—making their appearance especially significant. Rather than a signal of exhaustion, this may be the start of a major trend, suggesting that the broader structure of the stock or index has shifted decisively. Traders who misinterpret this as a reversal signal often find themselves fighting momentum. Instead, price tends to grind higher, sometimes pausing briefly before further gains. This is why the chapter suggests using Mega Overbought zones as confirmation of bullish control, not a trigger for counter-trades.
The inverse applies to the Mega Oversold zone—RSI falling below 20. This is usually not a buy-the-dip moment, especially if the broader trend and chart structure are bearish. Such readings typically accompany panic-driven breakdowns, where sellers dominate without any counterforce. These extreme values are often rare and may not have appeared for months or even over a year, marking a moment where the market’s character may be undergoing a structural change. As with Mega Overbought, context is critical. If RSI hits such depths after prolonged distribution or a topping pattern, it does not indicate value—it confirms that the tide has turned, and a strong downtrend may be setting in.
Both Mega zones are best used in conjunction with structure—trendlines, volume shifts, anchored VWAP zones, or price patterns. The RSI alone is not enough. But when it aligns with other technical signals, a Mega Overbought or Oversold status becomes a momentum amplifier, not a contrarian prompt. In fact, your RSI chapter rightly warns that entering against such zones can be fatal unless clear divergences, climax patterns, or volume exhaustion are also present. Think of these extremes not as ceilings or floors, but as accelerators when backed by structure.
A word of caution: These signals are rare and often widely spaced. The real challenge lies in managing risk–reward, as strong momentum and shallow pullbacks can make it difficult to find entries with favourable R:R ratios.
Chart: Microsoft Corp. (MSFT) – Daily Chart with 20-DMA and RSI (as on July 25, 2025)
Microsoft continues its strong upward trajectory, with price action staying well above the rising 20-day simple moving average. The recent surge in RSI into the mega overbought zone marks a significant shift in momentum, as the indicator revisits such elevated levels after nearly a year—an occurrence that often coincides with extended bullish phases.
NASDAQ (CASH100) SHORT - double top H6Risk/reward = 4.3
Entry price = 23 282
Stop loss price = 23 398
Take profit level 1 (50%) = 22 871
Take profit level 2 (50%) = 22 663
If current H6 goes back into range, I will open short position.
All variables on checklist have been met.
I was out last night so I missed my initial entry. Hoping for a second chance.
Hopefully this short works because the last few higher time frame short setups have failed, although because of exit plan I have made very little losses.

NASDAQ100 continue its strength due to the strong earning seasonFundamental:
USTEC (NASDAQ100) continues its strength, propelled by robust Alphabet (GOOG) earnings that buoyed technology companies. Cloud services recorded the largest growth at 32% YoY, primarily driven by AI. Concurrently, the company plans to allocate $85 bln to capital expenditure in 2025 for AI, an increase from $75 bln, signaling continued surging demand for AI infrastructure.
In addition, recent US economic data indicated strong consumption and optimism, with the July Services PMI expanding to 55.2 from 52.9 in the previous month. Initial Jobless Claims also fell to 217k, the lowest in 14 weeks, reinforcing optimism regarding the labor market, alongside stronger-than-expected Nonfarm Payrolls from early July.
Inflation data showed a minor impact from tariffs, and tariff negotiations have progressed favorably. Trade deals have been secured with Vietnam, Indonesia, Japan, and the Philippines, and potential trade agreements with the Eurozone and India are anticipated before the deadline.
Major earnings releases are slated for next week, including MSFT, META, and QCOM on July 30. AMZN and APPL's results the following day could provide a clearer picture of USTEC's overall earnings.
Meanwhile, USTEC's forward P/E currently stands at 27x, aligning with its 5-year average despite reaching a new record high, suggesting further upside potential.
Technical:
The index is trading above its EMAs, which are extending, signaling a continuation of the rally.
If USTEC sustains its momentum, the index may reach 24000 upon breaking above the potential resistance at 23400.
Conversely, a pullback near the swing high may suggest a retest of the support at 23000.

Here’s a fresh Nasdaq100 analysis I’ve put together for you.Hey Guys,
Here’s a fresh Nasdaq100 analysis I’ve put together for you.
I’ve marked the buy zone between 23,252 and 23,240. If price dips into that range, I’m anticipating a potential move upward toward 23,294.
Your likes and support are my biggest source of motivation to keep sharing these insights.
Huge thanks to everyone backing me with a thumbs-up!

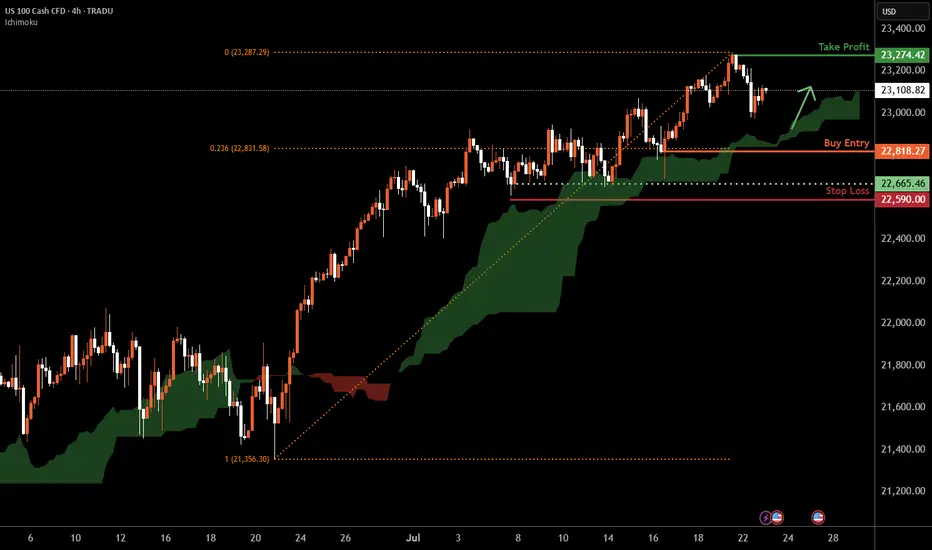
Nasdaq-100 H4 | Bullish uptrend to extend higher?The Nasdaq-100 (NAS100) is falling towards a swing-low support and could potentially bounce off this level to climb higher.
Buy entry is at 22,818.27 which is a swing-low support that aligns with the 23.6% Fibonacci retracement.
Stop loss is at 22,590.00 which is a level that lies underneath a multi-swing-low support.
Take profit is at 23,274.42 which is a swing-high resistance.
High Risk Investment Warning
Trading Forex/CFDs on margin carries a high level of risk and may not be suitable for all investors. Leverage can work against you.
Stratos Markets Limited (tradu.com ):
CFDs are complex instruments and come with a high risk of losing money rapidly due to leverage. 66% of retail investor accounts lose money when trading CFDs with this provider. You should consider whether you understand how CFDs work and whether you can afford to take the high risk of losing your money.
Stratos Europe Ltd (tradu.com ):
CFDs are complex instruments and come with a high risk of losing money rapidly due to leverage. 66% of retail investor accounts lose money when trading CFDs with this provider. You should consider whether you understand how CFDs work and whether you can afford to take the high risk of losing your money.
Stratos Global LLC (tradu.com ):
Losses can exceed deposits.
Please be advised that the information presented on TradingView is provided to Tradu (‘Company’, ‘we’) by a third-party provider (‘TFA Global Pte Ltd’). Please be reminded that you are solely responsible for the trading decisions on your account. There is a very high degree of risk involved in trading. Any information and/or content is intended entirely for research, educational and informational purposes only and does not constitute investment or consultation advice or investment strategy. The information is not tailored to the investment needs of any specific person and therefore does not involve a consideration of any of the investment objectives, financial situation or needs of any viewer that may receive it. Kindly also note that past performance is not a reliable indicator of future results. Actual results may differ materially from those anticipated in forward-looking or past performance statements. We assume no liability as to the accuracy or completeness of any of the information and/or content provided herein and the Company cannot be held responsible for any omission, mistake nor for any loss or damage including without limitation to any loss of profit which may arise from reliance on any information supplied by TFA Global Pte Ltd.
The speaker(s) is neither an employee, agent nor representative of Tradu and is therefore acting independently. The opinions given are their own, constitute general market commentary, and do not constitute the opinion or advice of Tradu or any form of personal or investment advice. Tradu neither endorses nor guarantees offerings of third-party speakers, nor is Tradu responsible for the content, veracity or opinions of third-party speakers, presenters or participants.
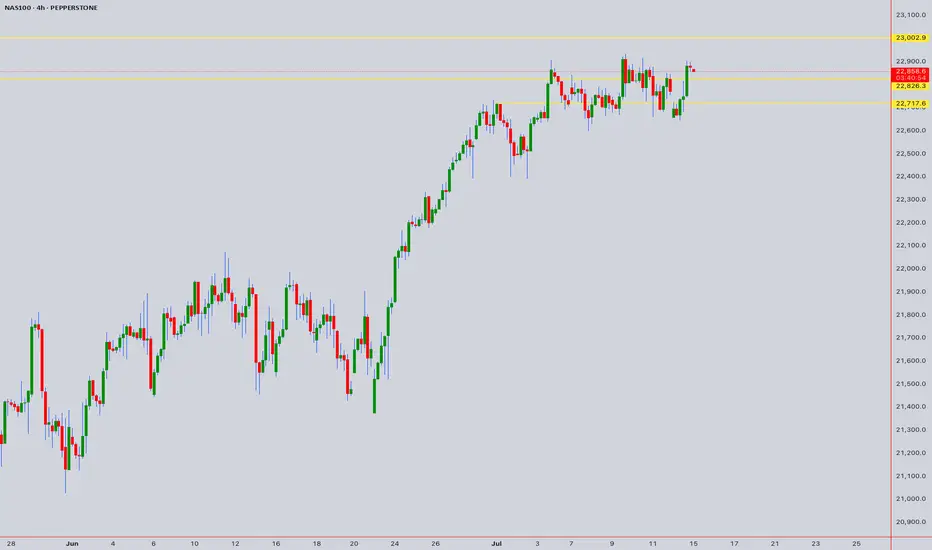
NAS100 Bullish Setup: Clean Structure & Entry Zone Pending📊 NASDAQ 100 (NAS100) remains bullish, showing a clean, well-structured uptrend—higher highs and higher lows 🔼📈.
Price has now pulled back into my optimal entry zone 🎯. At this stage, I’m waiting for a bullish break in market structure before considering an entry 🟢🔓.
Patience is key—let the structure confirm first.
Not financial advice ❌💼

NASDAQ (CASH100) SHORT - Double TOP H4Risk/reward = 11.3
Entry price = 23 190
Stop loss price = 23 270.4
Take profit level 1 (50%) = 22 674
Take profit level 2 (50%) = 22 053
All variables met, and entered the trade.
What is everyone's thoughts on shorting or longing cash100?

Nasdaq 100: Market Optimism Builds Ahead of Big Tech EarningsNasdaq 100: Market Optimism Builds Ahead of Big Tech Earnings
The earnings season is gaining momentum. This week, major technology companies such as Alphabet (GOOGL) and Tesla (TSLA) are scheduled to release their quarterly results.
Given that 85% of the 53 S&P 500 companies that have already reported have exceeded analysts’ expectations, it is reasonable to assume that market participants are also anticipating strong results from the big tech names. The Nasdaq 100 index (US Tech 100 mini on FXOpen) set an all-time high last week — a level that may be surpassed (potentially more than once) before the end of August.
Technical Analysis of the Nasdaq 100 Chart
Price movements have formed an upward channel (marked in blue), with the following dynamics observed:
→ The bearish signals we highlighted on 7 July did not result in any significant correction. This may be interpreted as a sign of a strong market, as bearish momentum failed to materialise despite favourable technical conditions.
→ Buyers have shown initiative by gaining control at higher price levels (as indicated by the arrows): the resistance at 22,900 has been invalidated, while the 23,050 level has flipped to become support.
→ A long lower shadow near the bottom boundary of the channel (circled on the chart) underscores aggressive buying activity.
Should the earnings and forward guidance from major tech firms also come in strong, this could further reinforce the sustainable bullish trend in the US equity market.
This article represents the opinion of the Companies operating under the FXOpen brand only. It is not to be construed as an offer, solicitation, or recommendation with respect to products and services provided by the Companies operating under the FXOpen brand, nor is it to be considered financial advice.

NASDAQ: Still Bullish! Look For Valid Buys!Welcome back to the Weekly Forex Forecast for the week of July 21-25th.
In this video, we will analyze the following FX market:
NASDAQ (NQ1!) NAS100
The Stock Indices are strong, and showing no signs of selling off. Buy it until there is a bearish BOS.
Enjoy!
May profits be upon you.
Leave any questions or comments in the comment section.
I appreciate any feedback from my viewers!
Like and/or subscribe if you want more accurate analysis.
Thank you so much!
Disclaimer:
I do not provide personal investment advice and I am not a qualified licensed investment advisor.
All information found here, including any ideas, opinions, views, predictions, forecasts, commentaries, suggestions, expressed or implied herein, are for informational, entertainment or educational purposes only and should not be construed as personal investment advice. While the information provided is believed to be accurate, it may include errors or inaccuracies.
I will not and cannot be held liable for any actions you take as a result of anything you read here.
Conduct your own due diligence, or consult a licensed financial advisor or broker before making any and all investment decisions. Any investments, trades, speculations, or decisions made on the basis of any information found on this channel, expressed or implied herein, are committed at your own risk, financial or otherwise.

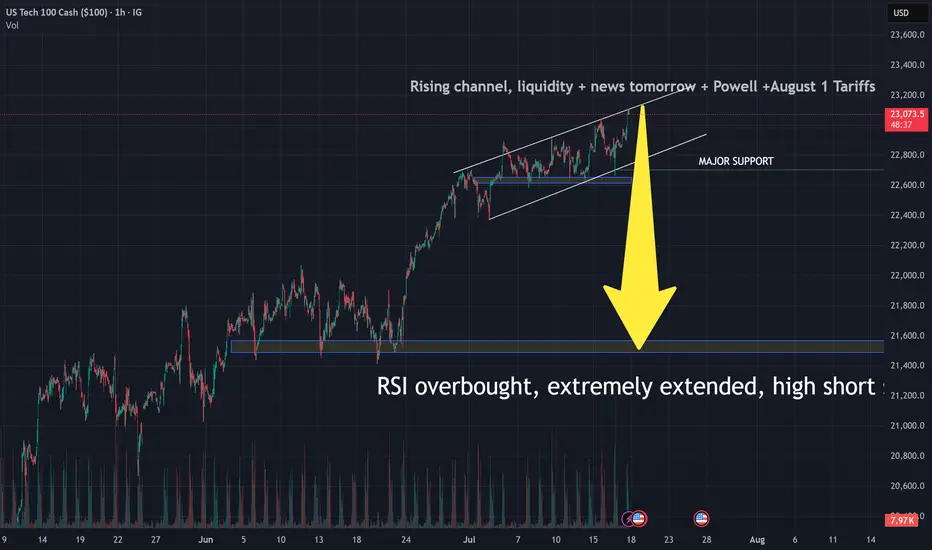
NASDAQ will fall to 21500 until August 1Nearly all Indicators, Geopolitics, uncertainties, Trade Tariffs, Powell vs Trump- tell us to sell, marking a bearish perception on Stock Market. Although your right analysis to sell is still bougt by super fast algorithms, there are facts that neither investors nor programms can ignore, and they are about to come. If housing market stambles tomorrow, which, probably, will be the fact, it will be the first step towards this deep dive. Wish us all profitable trading. Remember, it is not about being right or wrong, it is about making money, so even if you are wrong-dont compete with your own money against you, stay focused falks. See ya.
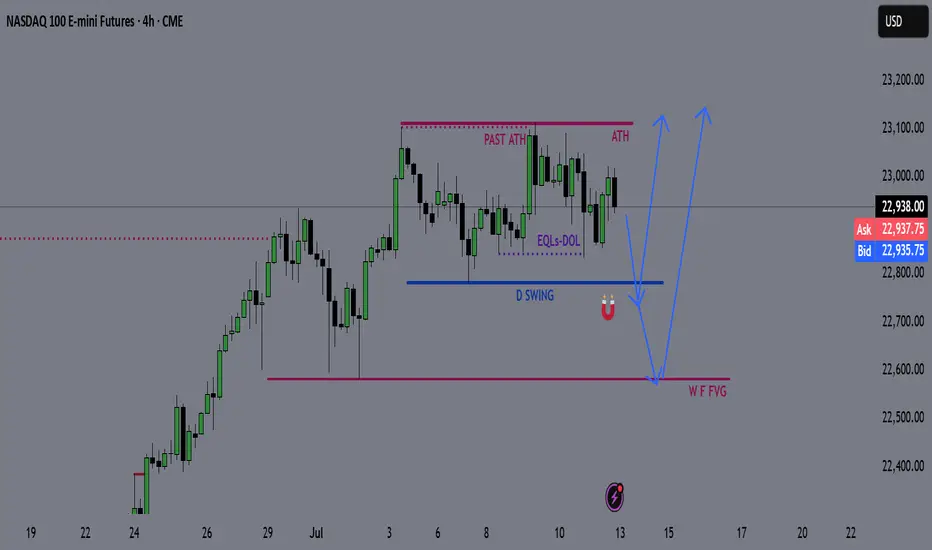
NQ Weekly Recap-Projection 13.07.2025NQ Weekly Recap + Outlook
1️⃣ Recap:
NQ made a new All-Time High, but the breakout ended up being a deviation. Price got rejected and started pulling back.
This signals potential weakness and suggests price may want to explore lower levels.
2️⃣ Bearish Scenario:
📍Target: Daily Swing low (Blue line)
📍Deeper target: Weekly Fair Value Gap (Purple zone)
I’ll look for LTF confirmations around these zones to position for potential longs.
3️⃣ Bullish Catalyst Watch:
There’s increasing speculation that Powell may resign this week.
If that happens, we could see:
✅ Strong bullish momentum
✅ Little to no retracement
✅ Immediate push into new ATHs
Weekly Plan Summary:
🔸 Scenario 1 - Pullback Continuation:
Look for reactive long setups at Daily Swing or W FFVG zone.
🔸 Scenario 2 - Powell Resignation:
Expect a breakout move with momentum — potentially no retrace.
Stay nimble. Trade what the chart confirms, not what the news promises.
NASDAQ 100: AI Momentum and Resilient Earnings Drive New HighsThe NASDAQ 100 continues its strong uptrend 📈, recently breaking to new highs after a period of consolidation. The rally is broad-based but remains led by heavyweight tech names and AI-related stocks 🤖.
Key Fundamental Drivers:
AI & Tech Growth 🤖💡: The biggest catalyst is the ongoing boom in artificial intelligence and digital transformation. Companies in the index, especially the “Magnificent Seven” (like NVIDIA, Microsoft, Apple), are seeing robust earnings growth and strong investor demand for AI exposure. Global IT spending is projected to grow by over 9% in 2025, with AI spending up nearly 30% year-on-year.
Earnings Resilience 💪💰: Despite high interest rates and inflation, tech companies have adapted well, maintaining strong margins and growth. The sector is expected to remain a top performer through 2025.
Fed Policy & Rate Expectations 🏦🔮: Markets are increasingly pricing in a pause or even cuts in US interest rates later in 2025, which is bullish for growth stocks and tech-heavy indices like the NASDAQ 100.
Geopolitical & Macro Factors:
Reduced Uncertainty 🌏🕊️: The market has absorbed major geopolitical shocks (such as the Israel-Iran conflict and US-China trade tensions), and the resolution or de-escalation of these risks has reduced uncertainty, supporting risk assets.
US Election & Policy 🇺🇸🗳️: The outcome of the US election and expectations for stable or pro-business policies have also contributed to positive sentiment.
Global Supply Chains & Resilience 🌐🔗: While some risks remain (e.g., cyber threats, regulatory changes, and supply chain disruptions), the tech sector’s global reach and adaptability have helped it weather these challenges.
Why is it rallying now?
AI optimism and strong tech earnings are the main drivers 🤖💹.
Expectations of easier Fed policy and a resilient US economy are fueling risk appetite 🏦📈.
Geopolitical risks have eased or are being priced in, allowing investors to focus on growth 🌍🕊️.
Summary:
The NASDAQ 100’s rally is powered by AI-driven tech growth 🤖, resilient earnings 💪, and easing macro/geopolitical risks 🌏. The index remains a global leader as investors bet on the next wave of technology and digital innovation 🚀.

$SMH / $QQQ: Ratio below ATH; Still more room for upside It’s the semis which are the hallmark of a cyclical bull market. It is always the Semis which indicate the start of a bull market and the first to fold over towards the end of a cyclical bull market. Hence the outperformance of Semis as a momentum sector is important from a symbolism perspective and from a market indicator perspective.
When the semis outperform the NASDAQ100 we have momentous bull markets. Today we looked at the ratio chart between NASDAQ:SMH vs $QQQ. This measures the relative outperformance or the underperformance of Semis over the broader NASDAQ100.
This ratio of NASDAQ:SMH / NASDAQ:QQQ touched its ATH on June 2024. Since then, the Semis lost momentum with NASDAQ:NVDA and NASDAQ:AVGO going sideways for a year. Now the momentum is on the side of Semis. Even if the NASDAQ:SMH is at 287 $ and at ATH with price is at its 2.618 Fib Retracement level, still the NASDAQ:SMH / NASDAQ:QQQ is not at its ATH. The ratio is currently @ 0.5. Before we hit 0.56 in the ratio chart just like last June 2024, SMH must outperform the NASDAQ100. If that must happen what should be the price of NASDAQ:SMH ? My prediction is the ratio NASDAQ:SMH / NASDAQ:QQQ tops @ 0.56 and NASDAQ:SMH goes to 400$ this year.
Verdict: Long NASDAQ:SMH over $QQQ. NASDAQ:SMH / NASDAQ:QQQ tops 0.56. NASDAQ:SMH price target 400$.

NAS100 Forecast 24HAs of Tuesday, July 15, 2025, 2:03:11 AM UTC+4 the forecast for US100 (Nasdaq 100) in the next 24 hours presents a mixed outlook, with underlying bullish sentiment but caution due to ongoing market dynamics and potential for short-term pullbacks.
Factors Contributing to a Bullish Bias:
Underlying Strength and Breakout Behavior: Despite some short-term bearish technical signals, the Nasdaq is described as being in "breakout mode," decisively overriding key levels. This suggests underlying bullish momentum.
AI as a Growth Driver: Artificial intelligence (AI) remains a primary growth driver for the US economy and the technology sector, which heavily influences the Nasdaq 100. Confidence in secular tailwinds like cloud computing and semiconductor demand also persists .
Temporary US Dollar Weakness: The US Dollar Index (DXY) is currently in a retracement phase, pulling back after strength. A weaker dollar can provide a relief rally for risk assets like the Nasdaq, making US tech stocks more attractive to international investors.
Potential for Federal Reserve Rate Cuts: While no rate cuts are expected over the summer, a rate cut is considered likely in September. Historically, phases of moderate interest rate cuts in the absence of a recession have been positive for the US stock market.
"Buy on Dip" Mentality: Some analyses suggest that any short-term declines could be viewed as buying opportunities, indicating an underlying positive sentiment among investors.
Strong Earnings Expectations (for some tech): Despite general market concerns, some technology companies associated with AI innovation are expected to perform well, contributing positively to the index.
Factors Suggesting Caution and Potential for Bearish Movement/Volatility:
Escalating Trade Tensions (Trump's Tariffs): President Trump's continued aggressive protectionist stance and new tariff threats (e.g., against Canada) are a significant risk. These can create uncertainty, weigh on corporate profits, and lead to market volatility. This is frequently cited as the main risk for US indices.
Short-Term Technical Bearishness: Some technical analyses indicate a high chance of bearish candle closures across various timeframes (1H, 4H, Daily, Weekly, Monthly) , and some traders are eyeing selling opportunities from specific resistance zones (e.g., around 22,800-22,869).
Overvalued Growth Stocks: Following a recent rally, US stocks, particularly growth stocks, are trading at a premium to fair value. This can limit upside potential and make the market more susceptible to corrections if tariff negotiations falter or earnings guidance disappoints.
Market Seasonality: As we move into the latter half of July, market seasonality can shift from bullish to a more bearish stance.
Earnings Season and "Sell on the News" : While major financial institutions are kicking off Q2 earnings season, there's a potential for a "sell on the news" response, even if earnings aren't particularly bad, given the strong rally stocks have already staged.
Mixed Global Signals: European markets showing mixed performance and pressure from US futures suggest cautious global risk sentiment, which could cap upside for the Nasdaq.
Unfilled Stock Imbalances: Some technical analysis points to an unfilled stock imbalance around 22,300, which could act as a reaction point if the price pulls back.
Key Levels to Watch (Approximate):
Support: 22,600, 22,300 (unfilled imbalance), 21,611 (resistance-turned-support), 20,673 (Fibonacci extension and prior high).
Resistance: 22,800, 22,869, 23,000-23,100 (potential re-entry targets for rally continuation), 25,000-25,100 (approximate imbalance level to be filled).
In conclusion, for the next 24 hours, the US100 is likely to face a battle between underlying bullish momentum driven by AI and potential Fed policy, and the immediate headwinds of escalating trade tensions and some short-term technical bearishness. Traders should be prepared for volatility and quick shifts in sentiment based on news flow, particularly regarding trade and upcoming earnings reports.
For those interested in further developing their trading skills based on these types of analyses, consider exploring the mentoring program offered by Shunya Trade.
I welcome your feedback on this analysis, as it will inform and enhance my future work.
Regards,
Shunya Trade
⚠️ Disclaimer: This post is educational content and does not constitute investment advice, financial advice, or trading recommendations. The views expressed here are based on technical analysis and are shared solely for informational purposes. The stock market is subject to risks, including capital loss, and readers should exercise due diligence before investing. We do not take responsibility for decisions made based on this content. Consult a certified financial advisor for personalized guidance.