"US100 / NASDAQ 100 / US TECH" Indices Market Bullish Heist Plan🌟Hi! Hola! Ola! Bonjour! Hallo!🌟
Dear Money Makers & Robbers, 🤑 💰
Based on 🔥Thief Trading style technical analysis🔥, here is our master plan to heist the "US100 / NASDAQ 500 / US TECH" Indices Market market. Please adhere to the strategy I've outlined in the chart, which emphasizes long entry. Our aim is the high-risk Red Zone. Risky level, overbought market, consolidation, trend reversal, trap at the level where traders and bearish robbers are stronger. 👀 So Be Careful, wealthy and safe trade.💪🏆🎉
Entry 📈 : You can enter a Bull trade at anypoint,
however I advise placing Buy limit orders within a 15 or 30 minute timeframe. Entry from the most recent or closest low or high level should be in retest.
Stop Loss 🛑: Using the 4H period, the recent / nearest low or high level.
Goal 🎯: 22,800.0
Scalpers, take note : only scalp on the Long side. If you have a lot of money, you can go straight away; if not, you can join swing traders and carry out the robbery plan. Use trailing SL to safeguard your money 💰.
Warning⚠️ : Our heist strategy is incompatible with Fundamental Analysis news 📰 🗞️. We'll wreck our plan by smashing the Stop Loss 🚫🚏. Avoid entering the market right after the news release.
Take advantage of the target and get away 🎯 Swing Traders Please reserve the half amount of money and watch for the next dynamic level or order block breakout. Once it is resolved, we can go on to the next new target in our heist plan.
💖Supporting our robbery plan will enable us to effortlessly make and steal money 💰💵 Tell your friends, Colleagues and family to follow, like, and share. Boost the strength of our robbery team. Every day in this market make money with ease by using the Thief Trading Style.🏆💪🤝❤️🎉🚀
I'll see you soon with another heist plan, so stay tuned 🫂
Nasdaq100

Elliott Wave Analysis on MNQ: Anticipating Wave 3Hello, TradingView community! As I am exploring the Elliott Wave Theory with the Micro E-mini Nasdaq-100 Index Futures (MNQ), I've observed the potential start of a new impulse wave sequence after completing an ABC correction on Friday morning and starting new impulse wave 1 with corrective wave 2 in the afternoon. Based on this, I expect we may be entering the longest wave 3, aiming for a target of 22,800, supported by the 161.8% Fibonacci extension.
This target for wave 3 I chose for its typical strength and reach. The 12/18 liquidity level is critical here; a breakthrough could indicate strong buy-side support, confirming the bullish trend. I used Fibonacci levels to manage potential pullbacks and determine profitable exits 1 and 2. Additionally, monitoring market structure shifts helps validate the continuation of the upward trend.
I am eager to hear your thoughts or corrections on this analysis, as I am still grinding my skills in applying Elliott Wave principles effectively.

Actionable Nasdaq insights: 30-Dec-2024Rise and shine, traders! Start your day with actionable Nasdaq insights. Let's grow your skills together, one chart at a time.

We already bottomed, you just don't know it yet! NASDAQ:QQQ
We already bottomed, you just don't know it yet!
Daily Chart analysis:
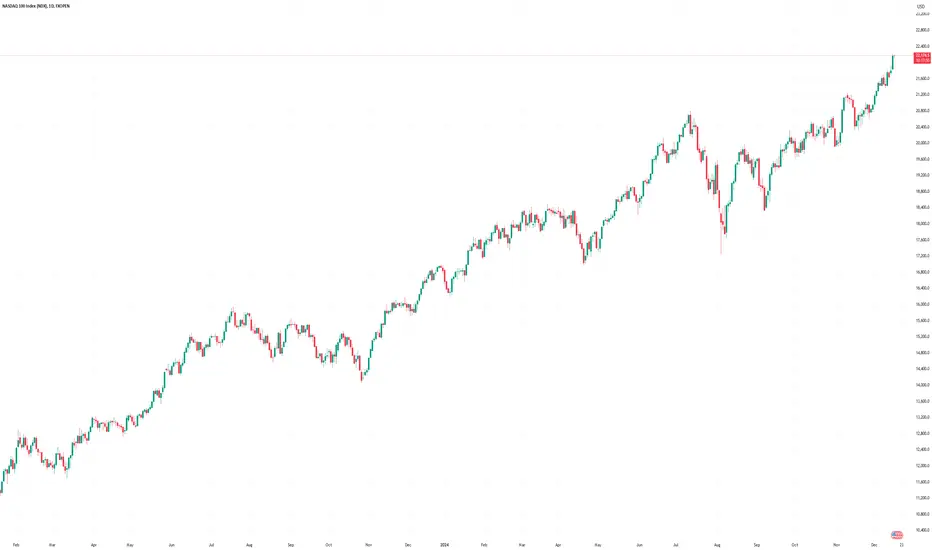
A look back at 2024 shows us that every time we have come down to the Green support line on the Wr% we've bounced hard all the way back up to the red barrier.
It coincides with every time we've went below the 9ema that this occurs then we rocket back up. This time could be different but what I'm seeing on the weekly chart as well it doesn't look like it to me as we've already rebound back above the 9ema to this point.
I'm just a nerd who loves all things stock market, I'm no oracle but from my TA and my GUT we should bounce hard heading into the new year and back up to ATH's in January friends!
Not financial advice.

Actionable Nasdaq insights: 27-Dec-2024Rise and shine, traders! Start your day with Actionable Nasdaq insights. Let's grow your skills together, one chart at a time.

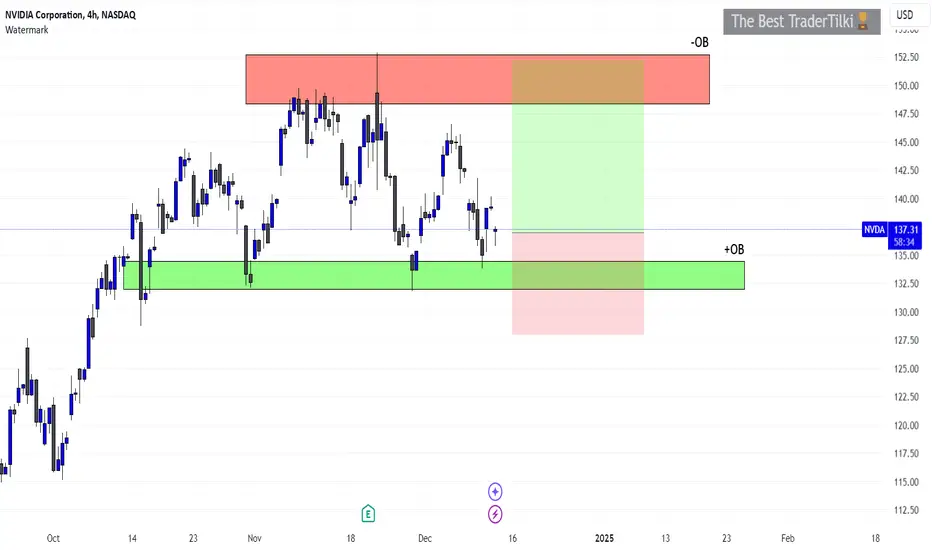
NVIDIA | 4 HOUR TIMEFRAME | STOCK TRADINGHello guys, I made NASDAQ:NVDA analysis for you. For this kind of analysis, please value my analysis with your likes Thank you very much to everyone who supports me by liking
SIGNAL ALERT
BUY NVIDIA 137.26 - 134.44
🟢TP1: 140,90
🟢TP2: 144.90
🟢TP3: 150.90
🔴SL: 128,03
Stay with love guys.
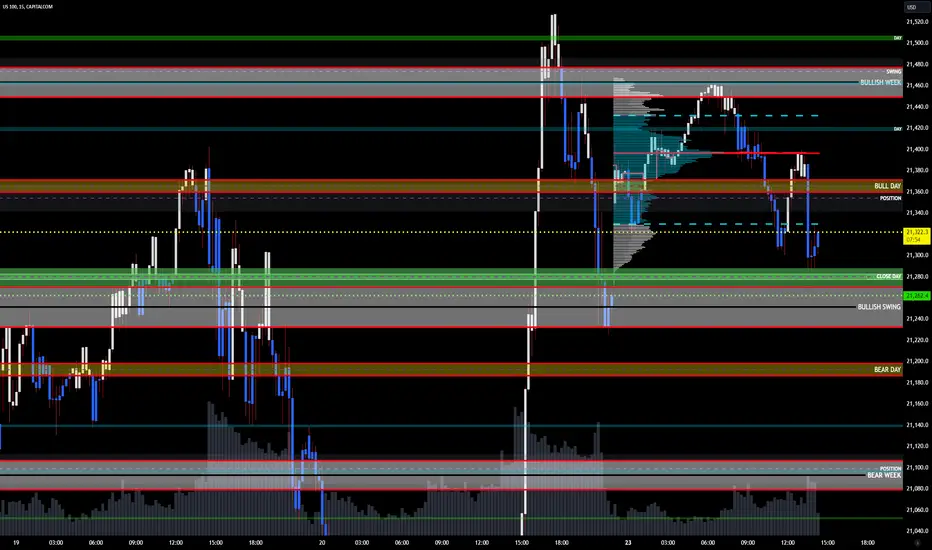
Below is a quick, high-level read on what the chart suggests for1. Recent Downward Momentum
Price has clearly dropped from a swing high (around the mid‑21,400s to 21,480 area) and is now trading in the low 21,300s.
The series of lower highs on the way down suggests near-term bearish pressure or at least a corrective pullback.
2. Key Support Zones
There’s a notable support band around 21,280 – 21,250 (green boxes/lines on your chart). This area appears to have propped the market up once already.
Below that, the next region of interest is near 21,200 – 21,180, which may act as a secondary support if the first zone fails.
3. Overhead Resistance
Near-term resistance looks to be the 21,360 – 21,400 zone. The market rejected in that region not long ago.
A break and hold above 21,400 could indicate buyers are regaining control, potentially setting up a run toward prior swing levels in the 21,450–21,480 range.
4. Volume Profile Observations
There’s heavier volume around the mid-21,200s and again in the upper 21,300s/21,400 region. These are likely to remain “hot spots” where price may stall or pivot due to heavier trading activity.
The 21,250–21,280 band also shows a fair amount of transactional volume, reinforcing that support zone.
5. Short-Term Bias
As long as price stays below the 21,360–21,400 ceiling, the immediate tilt is mildly bearish or consolidative, leaning negative.
If bulls manage a strong push above 21,400, it would suggest short-term buyers are stepping in; failing that, watch for a retest of the 21,250 zone or potentially the 21,200 handle.
Bottom Line
Short-Term Bearish Bias: Lower highs and a clear downward swing off recent highs.
Immediate Supports: 21,280 → then 21,250 → deeper support near 21,200.
Immediate Resistances: 21,360 → 21,400 → beyond that, 21,450+.
Keep an eye on how price reacts at those volume-rich zones—if momentum breaks above 21,400, that could quickly shift sentiment more bullish in the immediate term. If support near 21,280/21,250 fails, expect a further leg down.
Nasdaq market analysis: 23-Dec-2024Good morning, traders! Welcome to today's Nasdaq market analysis. Compare my price action insights with your own charts and enhance your trading skills.

HAPPY HOLIDAYS! Stock Market Weekly Preview: Dec. 23rd 📊Stock Market Weekly Preview: Dec. 23rd
NASDAQ:QQQ AMEX:SPY AMEX:IWM
In this video, we’re talking about:
🔹Stock Market & Overall Forecast
🔹Lessons Learned this past week
🔹Technical Analysis: H5 & Williams CB
🔹Current Trades
P.S. I'm getting coal for XMAS because I lied about it being a short video. 😅
Let’s dive into this Holliday Week! 👇

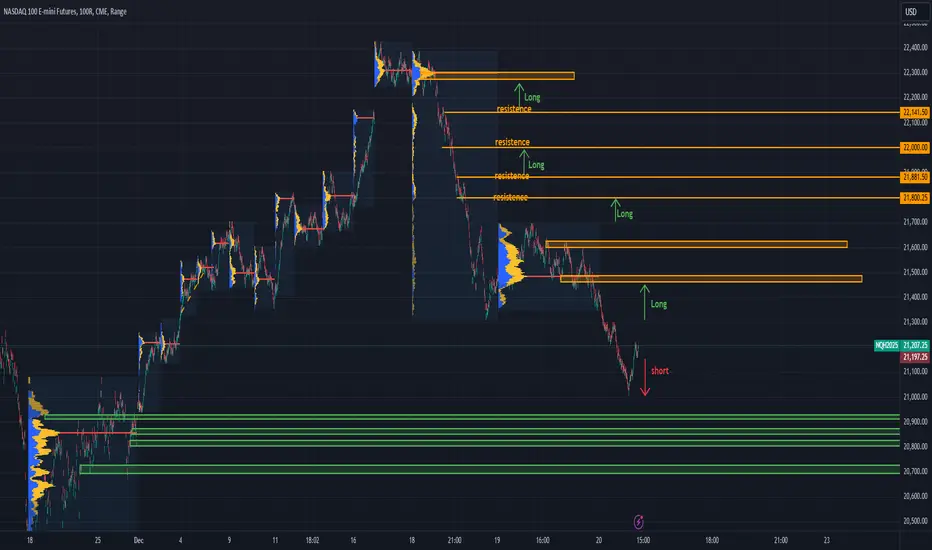
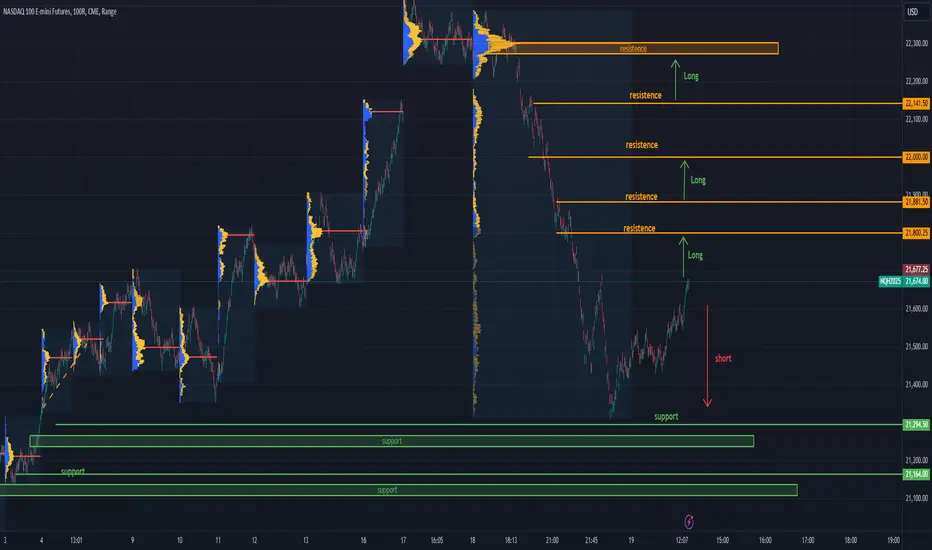
Intraday Levels for Nasdaq 100 Futures - 12/20/2024This analysis focuses on the Nasdaq 100 Futures, aiming to identify potential support and resistance levels where the price could experience intraday bounces or trend reversals, as well as zones where the price might potentially break higher or move lower.
Considerations
The range used in this analysis serves only as a reference for broader-level insights.
For intraday operations, it is advisable to utilize a lower timeframe to refine entry and exit points more accurately.
To confirm the validity of these levels, it is essential to evaluate real-time conditions as the price approaches these zones. Factors such as pressure, trading volume, and Order Flow will play a critical role in determining whether these supports hold or are likely to be broken.
Nasdaq Intraday Review - Thursday 19 Dec 2024I trade Nasdaq exclusively
Trading in GMT time zone
Sharing my post day review and analysis in case it can help you!
Did my analysis at +- 5:30 am GMT (00:30 am EST)
Economic news - None - FOMC on Wednesday night
News - None
Directional bias - BUY
Note: Did not trade FOMC on Wednesday, because generally I don’t like to trade news. For me, it’s more of a gamble than a situation where I can stack the probabilities in my favour.
Morning analysis:
FOMC reaction was huge, with price plummeting through the floor.
4H and Daily fib levels were all smashed. The last remaining fib level in the morning was the W 0.618 fib level.
A huge DT had formed on the D TF (marked in green lines). D neckline was broken down and price had travelled to the profit target zone (as marked by the green vertical line).
Price had touched the W 0.618 fib level and moved back up, showing a strong reaction to this last line of defence for the bulls.
In this case, because price had reached profit target, I was looking for a buy.
If price had not yet reached profit target, I would have been cautious with a buy because I have noted how respectful Nasdaq can be of profit targets.
It is normally the case that price would re-test the neckline of the market pattern just broken, once price has reached profit target, so I felt confident with a buy.
As the morning progressed a falling wedge pattern started forming (marked with blue lines). These usually break upwards, but can break either direction.
Price broke the pattern upwards and I entered at the lower hand icon.
Confirmations:
1. Market pattern - Two market patterns where at play here. A falling wedge broken upwards + DB on the 1H TF with the neckline (drawn in orange) broken upwards.
2. S&R - Market patterns where forming at a weekly S&R area.
3. Trend - Buy is in the same direction as the overall market trend. DB was forming right at the uptrend line area on the bigger timeframes (marked with the diagonal red line). Temporary downtrend line of falling wedge broken upwards
4. Fib - Long wick candle spike down to W 0.618 fib level
5. Candlesticks - Long wick candle showing a strong reaction to the W 0.618 fib level.
Mental stop was placed at the thick pink line, i.e. half of the height of the DB.
Price moved up well.
Now for setting TP's.
Setting take profit in these situations is difficult. Usually, I would use the fib level that I entered on, to provide guidance as to TP1 and TP2 (fib extensions).
But in this case, we are not in a trending market and aiming for the Weekly TP (because that is the fib level at play here) is too ambitious.
The highlighted green areas are very strong sell areas of confluence. I set these two areas as potential take profit zones.
Depending how strong bulls are, they may push all the way to the D neckline and push through, or they may just touch an EMA or sell fib level and price reverses downwards.
I have left a lot of money on the table in these scenarios before, by just assuming bulls will break the D neckline back upwards. So was determined today to learn from my past mistakes.
I ended up taking partial profit at +- 1000 pips, because I didnt like the strong reaction to the 30min EMA. With Nas, if price is VERY bullish or bearish, then price will react to the 30 EMA. So the fact that bears were so prominent at the 30 EMA, made me want to lock in some profits.
Price continued to move up and had a strong reaction to the D EMA (where it was at that time in history). Price had not even reached the area of sell confluence marked in green, and we were seeing a strong bearish push. Decided to take profit again at the top hand icon (+- 1'700 pips) and leave a runner open.
Runner got taken out at entry when price came tumbling down.
I am happy with my take profit decisions. This was the first time that I capitalised correctly on the move I was looking for.
I feel this proves the value of screen time and really trying to make sense of how price is reacting in various situations.
You may feel no progress at first, but in the long run, you will slowly start handling situations better and better.
Looks now like the market has turned bearish.
Weekly EMA and fist W fib level are very far down. Uptrend line on high TF's is also broken.
The buy wont just happen in a heart beat (in my opinion). Price will first start consolidating as bulls build strength and momentum and make a reversal pattern on the higher TF's before truly making a big move up.
Hope you had a good day! If you were in with a sell on FOMC, its caviar and champagne for the holiday season! ;)
Stats:
The total bullish move for the day was 2'572 pips:
I captured 66% (1'700pips) of the total move - Happy with that!
Abbreviations:
TF = timeframe
TP = take profit
1H = 1 hour
4H = 4 hour
D = day
W = week
M = month
S&R = support & resistance
H&S = head & shoulders
EMA = exponential moving average
SL = stop loss

Nasdaq analysis: 20-Dec-2024Good morning, traders! Today's Nasdaq analysis will help you achieve your trading goals. Let's work together towards success.

Intraday Levels for Nasdaq 100 Futures - 12/19/2024This analysis focuses on the Nasdaq 100 Futures, aiming to identify potential support and resistance levels where the price could experience intraday bounces or trend reversals, as well as zones where the price might potentially break higher or move lower.
Considerations
The range used in this analysis serves only as a reference for broader-level insights.
For intraday operations, it is advisable to utilize a lower timeframe to refine entry and exit points more accurately.
To confirm the validity of these levels, it is essential to evaluate real-time conditions as the price approaches these zones. Factors such as pressure, trading volume, and Order Flow will play a critical role in determining whether these supports hold or are likely to be broken.
Nasdaq 100: Make-or-Break Trendline SupportChart Analysis:
The US 100 Index has pulled back from recent highs but remains above its rising trendline (black), maintaining the broader bullish structure.
1️⃣ Rising Trendline:
The trendline, originating from the August lows, has been a key dynamic support for the index. Price is currently testing this level around 21,150, making it a critical area to watch.
2️⃣ Moving Averages:
50-day SMA (blue): The index remains above the 50-day SMA at 20,818, confirming short-term bullish momentum.
200-day SMA (red): Positioned at 19,438, reflecting a long-term bullish trend.
3️⃣ Momentum Indicators:
RSI: At 51.88, signaling neutral momentum, giving room for the index to either bounce or consolidate further.
MACD: The MACD line has turned downward, suggesting weakening bullish momentum but no decisive bearish crossover yet.
What to Watch:
A bounce from the trendline could signal a continuation of the uptrend, with immediate resistance near the recent highs around 21,600.
A break below the trendline may shift attention to the 50-day SMA or the 20,800 level for potential support.
The US 100 Index remains within a broader bullish structure, with the rising trendline acting as a critical support level for near-term price action.
-MW

Nvidia Short Daily chart Target SMA200Nvidia Short Daily chart Target SMA200
After that run for top price should try to go into the daily sma200 and than even more

Nasdaq 100 Index Plummets After Fed DecisionNasdaq 100 Index Plummets After Fed Decision
On 17th December, analysing the Nasdaq 100 chart (US Tech 100 mini on FXOpen), we:
→ Drew a blue upward channel relevant for 2024;
→ Noted that the price was near the upper boundary of the channel, while the RSI indicator had entered the overbought zone;
→ Suggested that bulls might face difficulties in pushing the price to a new all-time high.
Yesterday, the Fed cut the interest rate by 0.25%. Although it was anticipated, the market reaction was sharply negative. The Nasdaq 100 (US Tech 100 mini on FXOpen) dropped by approximately 4%.
The steep market reaction was driven by Fed Chair Jerome Powell’s comments during the press conference, where he stated that the FOMC plans to cut rates only twice in 2025, contrary to market expectations of four cuts.
Technical analysis of the Nasdaq 100 (US Tech 100 mini on FXOpen) chart shows that:
→ The price remains in the upper half of the channel, supported by the 21,230 level, which previously acted as resistance (as indicated by arrows).
→ We can assume that the area around the median of the blue channel (marked by orange lines) could act as a barrier to further downward momentum, as medians often serve as equilibrium zones where supply and demand balance out.
What’s next? According to analysts at Zacks, record highs for the tech stock index may not be a topic of discussion in the near future.
There is a possibility that a local descending channel could form, potentially driving the price into the lower half of the broader upward channel.
This article represents the opinion of the Companies operating under the FXOpen brand only. It is not to be construed as an offer, solicitation, or recommendation with respect to products and services provided by the Companies operating under the FXOpen brand, nor is it to be considered financial advice.

Nasdaq market analysis: 19-Dec-2024Good morning! Join me for today's Nasdaq market analysis. Share your charts, ask questions, and let's discuss trading strategies.

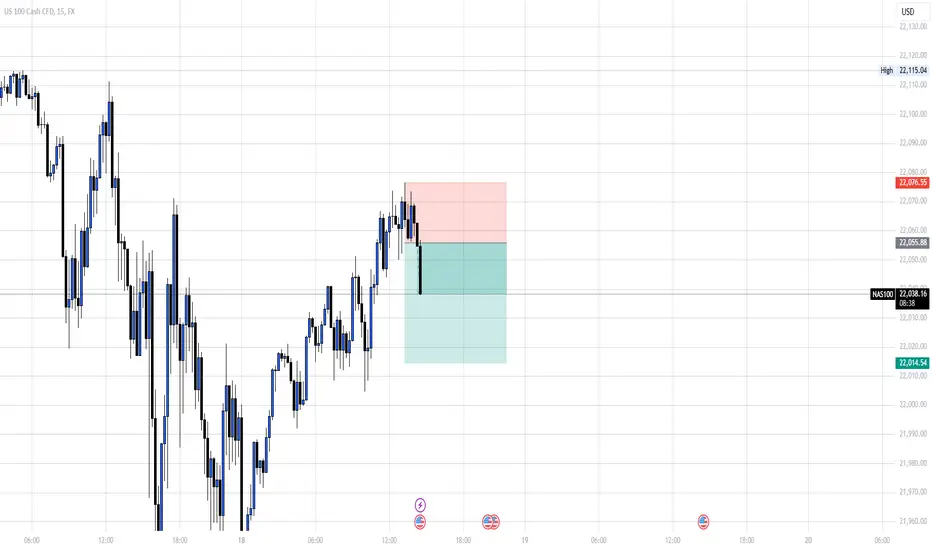
TP REACHED ON NASDAQMinutes ago I posted to sell on NASDAQ and the market reached our TP, a small quick trade to start the day with.
Follow for more!
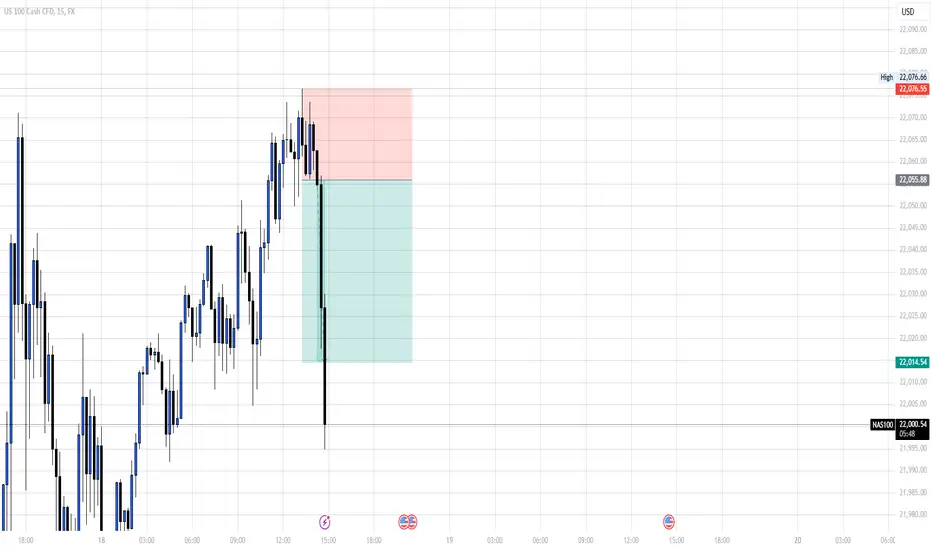
SELL NASDAQ I'm sharing with you a quick trade on NASDAQ, you can sell and target the same level as mine.
Follow for more!
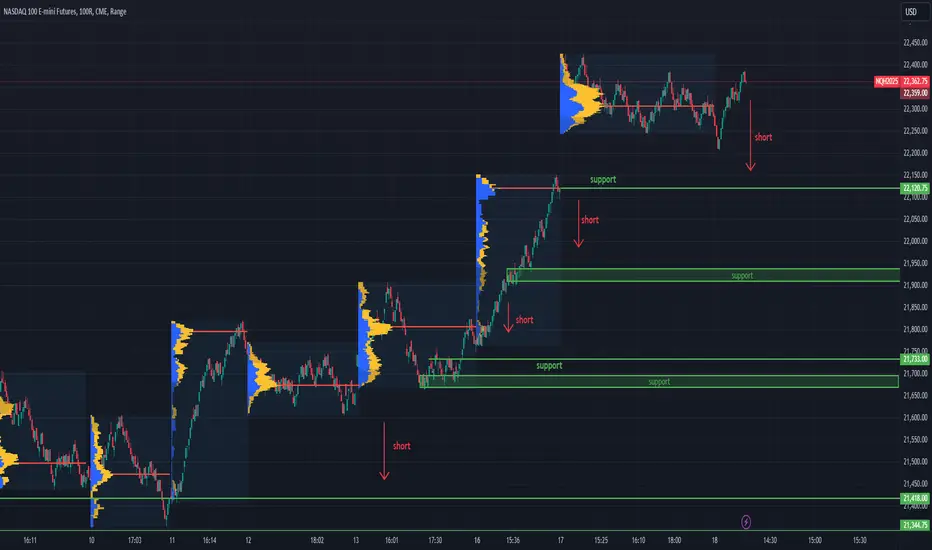
Intraday Levels for Nasdaq 100 Futures - 12/18/2024This analysis focuses on the Nasdaq 100 Futures, aiming to identify potential support and resistance levels where the price could experience intraday bounces or trend reversals, as well as zones where the price might potentially break higher or move lower.
Considerations
The range used in this analysis serves only as a reference for broader-level insights.
For intraday operations, it is advisable to utilize a lower timeframe to refine entry and exit points more accurately.
To confirm the validity of these levels, it is essential to evaluate real-time conditions as the price approaches these zones. Factors such as pressure, trading volume, and Order Flow will play a critical role in determining whether these supports hold or are likely to be broken.
Nasdaq trading zones: 18-Dec-2024Good morning, traders! As a seasoned price action trader, I'll share my Nasdaq insights to help you improve your trading skills.

Intraday Levels for Nasdaq 100 Futures - 12/17/2024This analysis focuses on the Nasdaq 100 Futures, aiming to identify potential support and resistance levels where the price could experience intraday bounces or trend reversals, as well as zones where the price might potentially break higher or move lower.
Considerations
The range used in this analysis serves only as a reference for broader-level insights.
For intraday operations, it is advisable to utilize a lower timeframe to refine entry and exit points more accurately.
To confirm the validity of these levels, it is essential to evaluate real-time conditions as the price approaches these zones. Factors such as pressure, trading volume, and Order Flow will play a critical role in determining whether these supports hold or are likely to be broken.

Nasdaq 100 Reaches Record HighNasdaq 100 Reaches Record High
On 29th October, analysing the Nasdaq 100 (US Tech 100 mini on FXOpen) chart, we:
→ Drew a blue upward channel relevant for 2024.
→ Noted that the price was in a consolidation phase (indicated by narrowing purple lines) at the channel's median, suggesting a potential balance of supply and demand forces.
→ Warned that earnings season could trigger a volatility spike.
→ Suggested that the price was likely heading toward a new all-time high.
Since then:
→ Amid company earnings reports, we observed a volatility spike in November, which was further amplified by the release of US presidential election results.
→ The index achieved a new all-time high.
The Nasdaq 100 (US Tech 100 mini on FXOpen) chart shows that the index surpassed the $22,000 level for the first time yesterday. This was supported by positive trader sentiment ahead of tomorrow's Fed interest rate decision. According to Forex Factory, the rate will be cut by another 25 basis points (returning to the February 2023 level).
Meanwhile, the technical analysis of the Nasdaq 100 (US Tech 100 mini on FXOpen) reveals that:
→ The price has approached the upper boundary of the upward channel, which could serve as strong resistance.
→ Since early December, the index has risen by approximately 5.5%, and the RSI indicator has entered the overbought zone for the first time since July.
Under such conditions, bulls may struggle to continue the upward momentum, as more investors might look to lock in profits ahead of the holiday season. Additionally, the market's reaction to tomorrow's Fed interest rate release at 21:00 GMT+2 may play a key role.
This article represents the opinion of the Companies operating under the FXOpen brand only. It is not to be construed as an offer, solicitation, or recommendation with respect to products and services provided by the Companies operating under the FXOpen brand, nor is it to be considered financial advice.