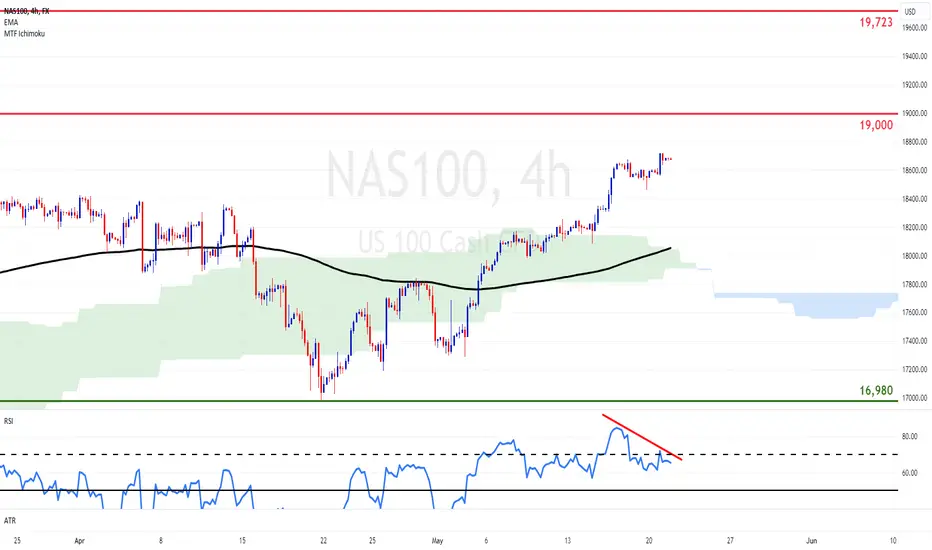
NAS100 Hits Record Ahead of NVIDIA but RSI DivergesThe tech-heavy index runs its best month of the year, extending the advance to new record highs. After last week’s CPI moderation, markets strengthened their bets for two rate cuts by the Fed this year, beginning in June. NAS100 now eyes the psychological 19K mark.
On the other hand, the disinflation process has slowed this year and Fed officials have turned cautious around a pivot, adopting a higher-for-longer narrative, while the hawkish commentary continued this week from various policymakers. On the technical side, the RSI did not follow prices higher, in a divergence that creates risk for a pullback towards the EMA200 (black line). Daily closes below it, would pause the bullish bias, but that would need strong catalyst.
Even if a pullback ensues, the path of least resistance is higher. NAS100 has looked past the Fed’s cautious shift, largely due to the generative AI boom and investors now await Wednesday’s results by NVIDIA, its enabler and main beneficiary. After February’s last report, the stock had jumped more than 12% and had lifted NAS100 with it, so there is potential for volatility.
NVIDIA expects new record revenues due to AI demand and growth to the tune of 235% y/y. This would mark a small slowdown in pace and markets will want to see if it can continue to post eyewatering numbers, or if cracks will begin to appear.
Stratos Markets Limited (www.fxcm.com):
CFDs are complex instruments and come with a high risk of losing money rapidly due to leverage. 68% of retail investor accounts lose money when trading CFDs with this provider. You should consider whether you understand how CFDs work and whether you can afford to take the high risk of losing your money.
Stratos Europe Ltd (trading as “FXCM” or “FXCM EU”), previously FXCM EU Ltd (www.fxcm.com):
CFDs are complex instruments and come with a high risk of losing money rapidly due to leverage. 73% of retail investor accounts lose money when trading CFDs with this provider. You should consider whether you understand how CFDs work and whether you can afford to take the high risk of losing your money.
Stratos Trading Pty. Limited (www.fxcm.com):
Trading FX/CFDs carries significant risks. FXCM AU (AFSL 309763). Please read the Financial Services Guide, Product Disclosure Statement, Target Market Determination and Terms of Business at www.fxcm.com
Stratos Global LLC (www.fxcm.com):
Losses can exceed deposits.
Any opinions, news, research, analyses, prices, other information, or links to third-party sites contained on this video are provided on an "as-is" basis, as general market commentary and do not constitute investment advice. The market commentary has not been prepared in accordance with legal requirements designed to promote the independence of investment research, and it is therefore not subject to any prohibition on dealing ahead of dissemination. Although this commentary is not produced by an independent source, FXCM takes all sufficient steps to eliminate or prevent any conflicts of interests arising out of the production and dissemination of this communication. The employees of FXCM commit to acting in the clients' best interests and represent their views without misleading, deceiving, or otherwise impairing the clients' ability to make informed investment decisions. For more information about the FXCM's internal organizational and administrative arrangements for the prevention of conflicts, please refer to the Firms' Managing Conflicts Policy. Please ensure that you read and understand our Full Disclaimer and Liability provision concerning the foregoing Information, which can be accessed via FXCM`s website:
Stratos Markets Limited clients please see: www.fxcm.com
Stratos Europe Ltd clients please see: www.fxcm.com
Stratos Trading Pty. Limited clients please see: www.fxcm.com
Stratos Global LLC clients please see: www.fxcm.com
Past Performance is not an indicator of future results.
Nasdaq100
Nasdaq 100 - Futures Day Trading - 15min HypoYesterday we took the all-time high with a liquidity sweep creating a market structure shift on the 15min timeframe. Asia/London session is now in a range market. 8.30 Am we have Canadian CPI news. Careful for manipulation. I will be looking for clear indications and confirmation to trade in direction of the American market open. The overall value migration is up for long term investors, however with this temporary market structure shift model I will be looking for an intraday short when sweeping Asia/London highs.

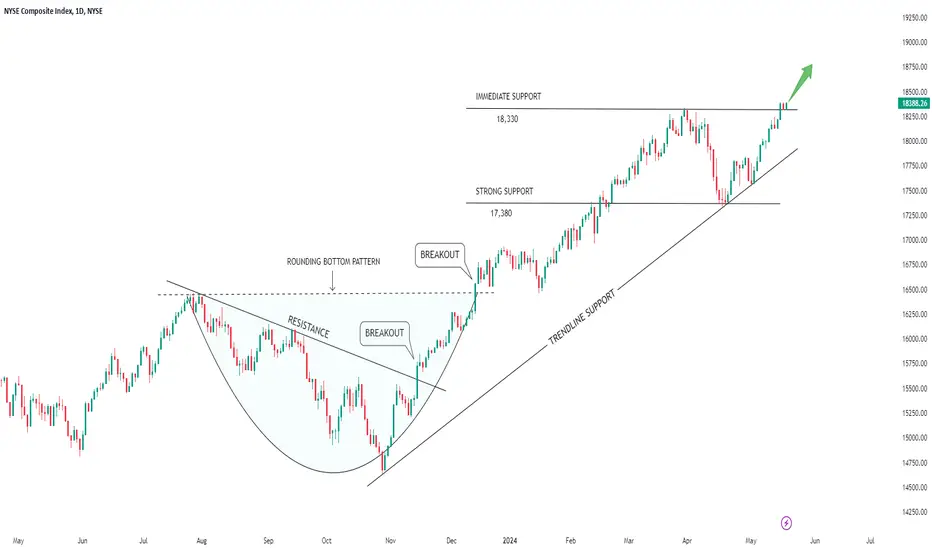
Technical Analysis Of NYSE Composite Index In Daily Timeframe
(1) After the breakout of the Rounding Bottom pattern, price has given a sharp upside rally and reached to its previous All Time High at near 18,340.
(2) After that, a sharp correction has been seen, which was quite natural. Price took support at near 17,380 level.
(3) Then with a strong up move, price made a fresh All Time High at near 18,400 level.
(4) 18,330 level will act as an immediate support level for the price and It is expected that the price will go up again from this level and achieve new highs.
(5) The overall sentiments will remain positive until the price is trading above the 17,380 level.
QQQ Double Top on Bearish DivergenceIf you haven`t bought the dip on QQQ:
Then it's important to understand that it's currently exhibiting a double top formation, known as one of the most bearish chart patterns, along with a substantial bearish divergence. I foresee a retracement soon, possibly to $416, but I still expect it to finish the year on a positive note!

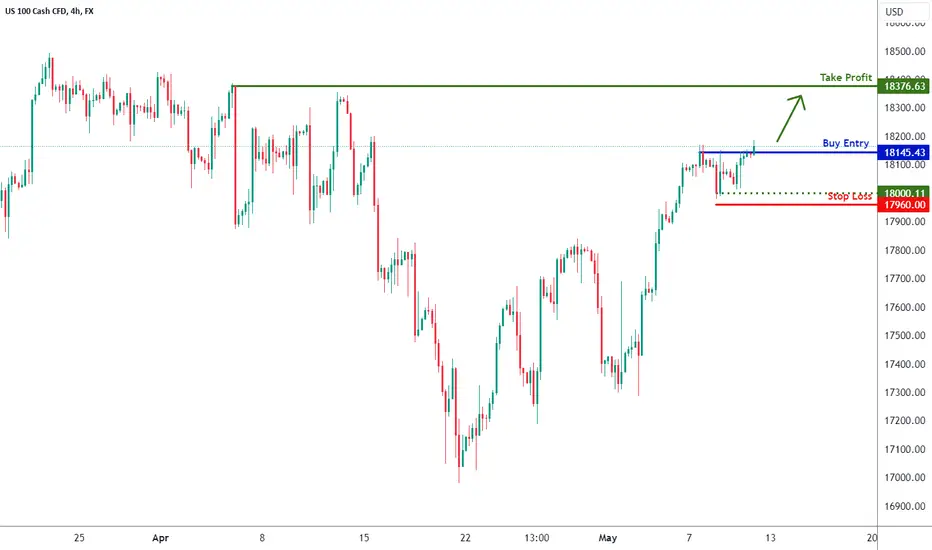
NAS100 H4 | Potential bullish breakout for TechThe Nasdaq-100 (NAS100) is trading close to a breakout level and the bullish momentum could potentially push it higher from here.
Buy entry is at 18,145.43 which is a potential breakout level ( Wait for the 1-hour candle to close above this level for confirmation ).
Stop loss is at 17,960.00 which is a level that lies underneath a pullback support.
Take profit is at 18,376.63 which is a pullback resistance.
High Risk Investment Warning
Trading Forex/CFDs on margin carries a high level of risk and may not be suitable for all investors. Leverage can work against you.
Stratos Markets Limited (www.fxcm.com):
CFDs are complex instruments and come with a high risk of losing money rapidly due to leverage. 68% of retail investor accounts lose money when trading CFDs with this provider. You should consider whether you understand how CFDs work and whether you can afford to take the high risk of losing your money.
Stratos Europe Ltd, previously FXCM EU Ltd (www.fxcm.com):
CFDs are complex instruments and come with a high risk of losing money rapidly due to leverage. 70% of retail investor accounts lose money when trading CFDs with this provider. You should consider whether you understand how CFDs work and whether you can afford to take the high risk of losing your money.
Stratos Trading Pty. Limited (www.fxcm.com):
Trading FX/CFDs carries significant risks. FXCM AU (AFSL 309763), please read the Financial Services Guide, Product Disclosure Statement, Target Market Determination and Terms of Business at www.fxcm.com
Stratos Global LLC (www.fxcm.com):
Losses can exceed deposits.
Please be advised that the information presented on TradingView is provided to FXCM (‘Company’, ‘we’) by a third-party provider (‘TFA Global Pte Ltd’). Please be reminded that you are solely responsible for the trading decisions on your account. There is a very high degree of risk involved in trading. Any information and/or content is intended entirely for research, educational and informational purposes only and does not constitute investment or consultation advice or investment strategy. The information is not tailored to the investment needs of any specific person and therefore does not involve a consideration of any of the investment objectives, financial situation or needs of any viewer that may receive it. Kindly also note that past performance is not a reliable indicator of future results. Actual results may differ materially from those anticipated in forward-looking or past performance statements. We assume no liability as to the accuracy or completeness of any of the information and/or content provided herein and the Company cannot be held responsible for any omission, mistake nor for any loss or damage including without limitation to any loss of profit which may arise from reliance on any information supplied by TFA Global Pte Ltd.
The speaker(s) is neither an employee, agent nor representative of FXCM and is therefore acting independently. The opinions given are their own, constitute general market commentary, and do not constitute the opinion or advice of FXCM or any form of personal or investment advice. FXCM neither endorses nor guarantees offerings of third-party speakers, nor is FXCM responsible for the content, veracity or opinions of third-party speakers, presenters or participants.
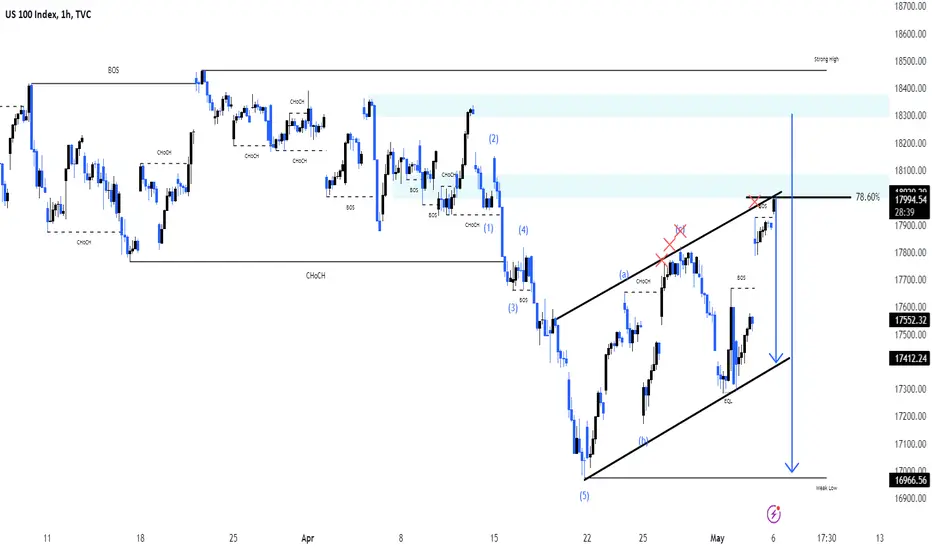
NASDAQPair : NASDAQ
Description :
Completed " 12345 " Impulsive Waves
RSI - Divergence
Break of Structure
Bullish Channel as an Corrective Pattern in Short Time Frame
Fibonacci Level - 78.60%
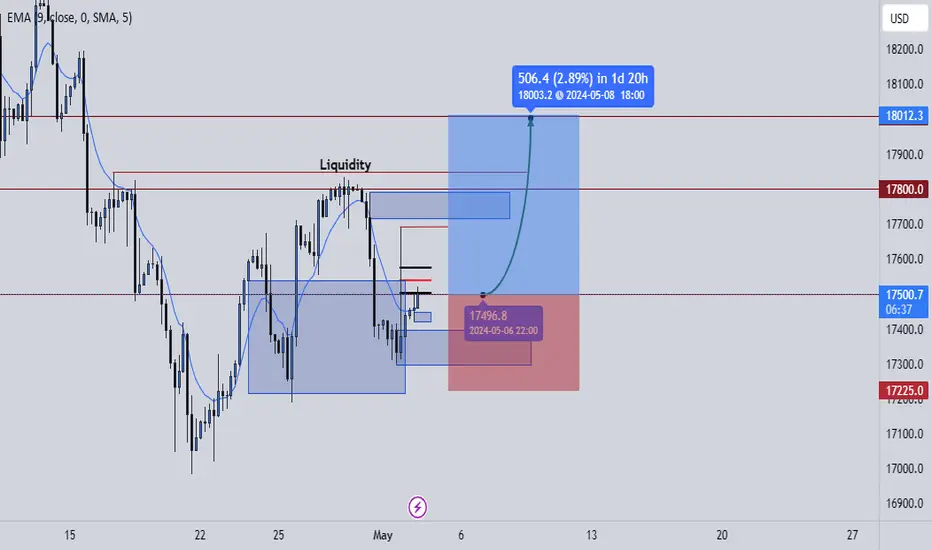
NASDAQ - Daily ready to fall?The NASDAQ has ascended for a second leg and is now poised for a potential deep pullback to test the support zone. This support area aligns with a key weekly level that typically needs to be retested before the index can mount a continued rise. You should keep a close eye on this trend, as it could present a significant opportunity in the coming period.

Nasdaq 100 Peak 2024 ?Will the 2021 peak happen again ?
consolidation occurs like in 2021, will history repeat itself?

NAS100 SETUP PREDICTIONHHello traders this my trading setup in the higher time frame
My tactics ;
TECHNICAL ANALYSIS
Key Support & Resistance
Market Structure , Price Swings
Open Interest
Order Blocks & breaker block=> Expansion
liquidity => Reversal
imbalance => Retracement
Consolidation => Equalibrium
Market Maker Models buy and sell
Weekly Profiles
If you like my content please follow and hit the like button and show some love
wish you good luck and good tradinG
Nas100 Trading setup Institutional tacticsHello traders this my trading setup in the higher time frame
My tactics ;
TECHNICAL ANALYSIS
Key Support & Resistance
Market Structure , Price Swings
Open Interest
Order Blocks & breaker block=> Expansion
liquidity => Reversal
imbalance => Retracement
Consolidation => Equalibrium
Market Maker Models buy and sell
Weekly Profiles
If you like my content please follow and hit the like button and show some love
wish you good luck and good trading

N1We had quite a few trades in the past week, but we were either too early so we taken out or in too late so we took short profits.
WEEKLY
March we had the peak of price, first time in it's history (18400). When we look left, whenever price peaks it drops for quite a bit before it goes back up. So we can assume we might see 16000 again.
DAILY
We just have an ascending channel within a bullish trend so we can assume that the overall demand is up. The DXY will give us more clues as to what can happen, American countries as well need to be monitored for new IPO's and their financial year results to get more information. This will add to our portfolio of evidence. We can see we are in the correction phase, but because it's so deep we can expect it to go further down for quite some time.
4H
In the bigger correction, we're in a smaller correction. So the assumption is that price is going down. We are not children of the market so the assumption is just that, an assumption not the forecast. We still need more candlestick confirmation and pattern formation before making a final forecast. 17600, is an area of interest as this is where price will do something unless it breaks right through.
1H
We are struggling to break 17800, so we know that it is a strong resistance level. NFP being this week does not mean that we have to trade, it means we need to make informed decisions based on news and reports.
Nasdaq - Shifting back bearish?Hello Traders and Investors, today I will take a look at the Nasdaq.
--------
Explanation of my video analysis:
For over a decade the Nasdaq has been trading in a pretty obvious rising channel formation. We saw the last retest of support in 2022 which was followed by an enormous +70% rally towards the upside. Considering that the Nasdaq is now retesting the upper resistance, there is a quite high chance that we will see at least a short term correction lower before the Nasdaq will follow its overall uptrend.
--------
Keep your long term vision,
Philip (BasicTrading)

Correction in a larger degree of wave (Bear scenario)Esteemed analysts and traders,
I hope this correspondence finds you in good health and high spirits, prepared to tackle the upcoming week with renewed energy. I extend my best wishes for your continued success in all your business endeavors. It is worth noting that success in trading is largely dependent on the consistent definition and adherence to one's own rules.
As a supporter of the Elliott Wave Principle, I consider this methodology an invaluable tool for market analysis. After three years of personal experience, I have developed my approach by combining this principle with meticulous consideration of different market scenarios. I strive to avoid market surprises by maintaining a range of market prospects, which enables me to recognize the market structure forming with 100% accuracy.
I am pleased to share my analysis with you, with the caveat that I do not provide buy or sell signals. My perspective on idea analysis is entirely impartial, and if my analysis meets your standards, it may serve as a guide to making an informed decision.
For your reference and comparison, I have attached my previous analysis of the same market. All the details of my analysis are clearly labeled for ease of comprehension. Nonetheless, familiarity with the Elliott Wave Principle theory would facilitate an understanding of the analytical idea.
My study of the Elliott Wave Principle took nearly three years, during which my understanding and experience with this invaluable tool have grown. My progress thus far is a testament to the legacy of Ralph Nelson Eliot, whose genius has provided the foundation for my achievements. May he rest in peace.
I express my gratitude for your continued support and kindness, and welcome your comments and critiques.
May my analysis be a valuable asset to your business journey, and I remain sincerely yours,
Mr. Nobody
Bullish scenario

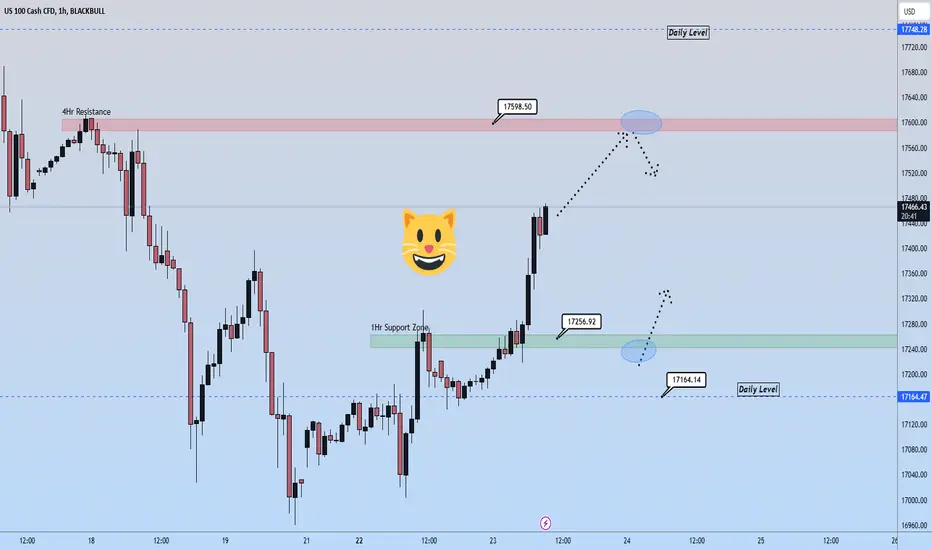
U.S. Stock indices higher on Bad economic data? 🤔Risk-On Sentiment has taken over the markets today despite bad manufacturing and services data.. and it began yesterday on Nasdaq with the Daily candle closing back above the Daily Level 17,164. Other confluences for the increase on Nasdaq include 1) Jerome Powell's hawkish comments on April 16th.
2) Dollar Index 5 minutes chart : Here we can observe the Risk on sentiment with the data this morning. The dollar Index represents the U.S. dollar of course and puts it againsgt a basket of currecies(4) . Since the USD is a safe haven.. and the dollar index is going down.. this represents money flowing into other asset classes as ivestors see better retruns elsewhere such as Nasdaq (Risk-On U.S. stock index). This is what we would expect to see with bad USD data
3)The Fakeout price action on Monday suggesting Buys today
4) Volatility Index (Vix) 5 minutes chart : We can observe that price decreased during london session and through the not so great USD data release. This means that more investors are buying call options in the S&P500 companies anticpating that the stock indexes will rebound to the upside. This could have been correlated with buying the stock indexes like Nasdaq after it jumped up with the data release this morning.
Let me know what your thoughts are on the Nasdaq! These publications are for general and educational purposes only. Not trading or financial advice.
Nasdaq 100 IndexWhere we stand in Nasdaq 100 Index.
Going through the chart I got these counts and looks valid to me.
This is just my opinion not any trading advisory.
I reserve the right to be wrong.
Thanks
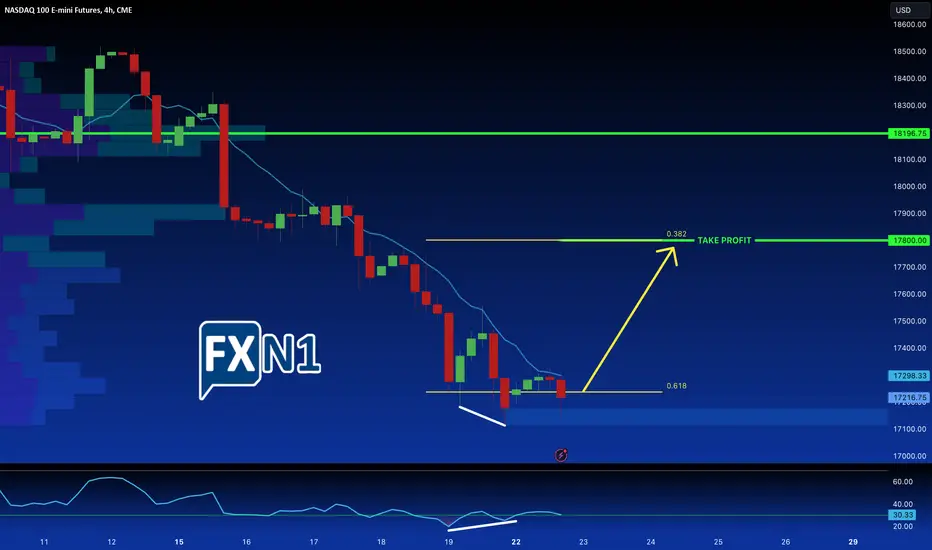
Nasdaq Analysis: Fibonacci Retracement and RSI DivergenceThe Nasdaq has reached an intriguing point around the 17200 area, where it sits at the 61.8% Fibonacci retracement level from the previous swing low. Price action appears to be responding to this level on lower timeframes, and we've also observed a divergence on the RSI indicator on the H4 timeframe, coinciding with the price attempting to move out of oversold conditions. We are considering a scalp position with a potential take profit at the 38.2% Fibonacci level, and possibly at the Point of Control (POC) Volume for an extended take profit.
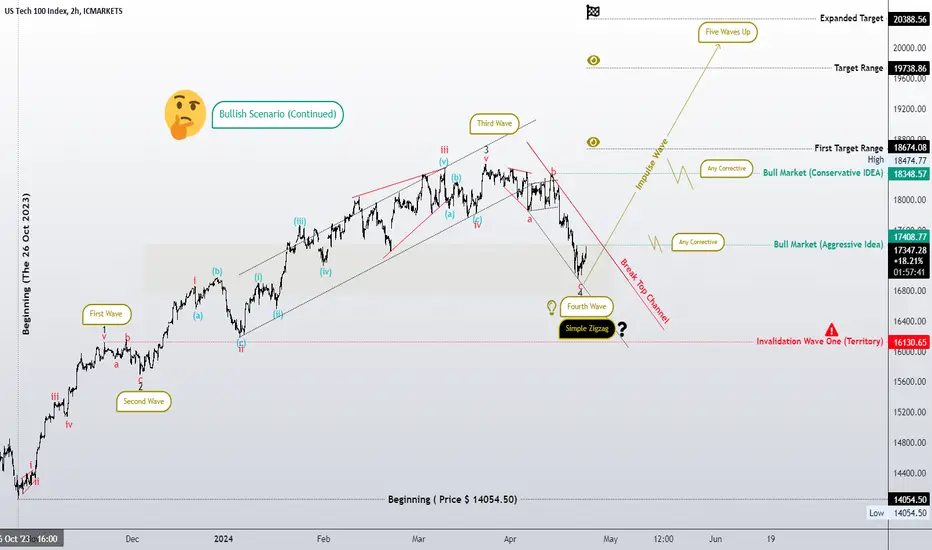
The idea of a bullish scenario! Think about structureEsteemed analysts and traders,
I hope this correspondence finds you in good health and high spirits, prepared to tackle the upcoming week with renewed energy. I extend my best wishes for your continued success in all your business endeavors. It is worth noting that success in trading is largely dependent on the consistent definition and adherence to one's own rules.
As a supporter of the Elliott Wave Principle, I consider this methodology an invaluable tool for market analysis. After three years of personal experience, I have developed my approach by combining this principle with meticulous consideration of different market scenarios. I strive to avoid market surprises by maintaining a range of market prospects, which enables me to recognize the market structure forming with 100% accuracy.
I am pleased to share my analysis with you, with the caveat that I do not provide buy or sell signals. My perspective on idea analysis is entirely impartial, and if my analysis meets your standards, it may serve as a guide to making an informed decision.
For your reference and comparison, I have attached my previous analysis of the same market. All the details of my analysis are clearly labeled for ease of comprehension. Nonetheless, familiarity with the Elliott Wave Principle theory would facilitate an understanding of the analytical idea.
My study of the Elliott Wave Principle took nearly three years, during which my understanding and experience with this invaluable tool have grown. My progress thus far is a testament to the legacy of Ralph Nelson Eliot, whose genius has provided the foundation for my achievements. May he rest in peace.
I express my gratitude for your continued support and kindness, and welcome your comments and critiques.
May my analysis be a valuable asset to your business journey, and I remain sincerely yours,
Mr. Nobody
The bearish scenario of any corrective pattern and trend continuation
Indices higher with the Vix as Support 🧐Hello traders.. kicking off the week here the stock indices are up alongside the USD strength. We have the vix which sold off dring the london session and this tells us that sentiment is leaning towards risk on as call options are being bought. The Nasdaq is moving up here and we could mirror some of the candles to the left handside that we observed during Friday of last week. We could move up to 17,303 or at least towards there since we have clean traffic on the 1hr chart and 4hr. Oil has continued to selloff as I anticpated and gold has sold off even more denoting some risk-off sentiment from commodities. Bond yields are up slightly denoting some risk on sentiment to begin the week here. The overall trend for yields has been up the last few weeks. It will be important to observe how candles close around 17,164 daily level as this will tell us of impending strength or weakness in Nasdaq. We may retreat towards 17,070 if price cannot sustain around 17,164 daily level.

Nasdaq - Correction already over?Hello Traders and Investors, today I will take a look at the Nasdaq.
--------
Explanation of my video analysis:
For more than 10 years the Nasdaq has been trading in a pretty obvious and also profitable rising channel formation. We saw the last retest of support back in 2023 which was followed by a significant rally of +70% towards the upside. As we are speaking the Nasdaq is actually retesting resistance so there is a quite high chance that we will see at least a little more bearish continuation.
--------
Keep your long term vision,
Philip (BasicTrading)

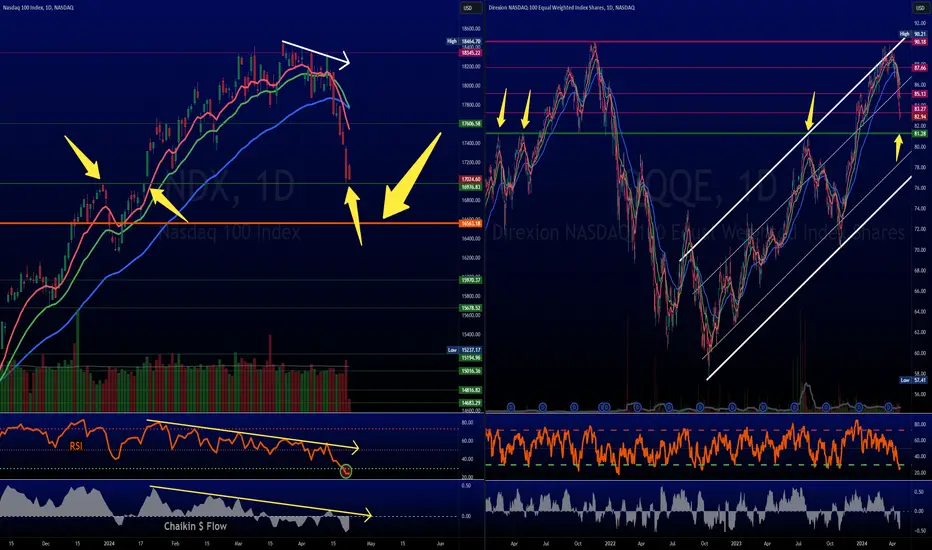
$NDX getting very close to support levels, close to real bounceMakes sense for NASDAQ:NDX to get a bounce here as it is at the 1st Support level after the December breakout & it is Oversold.
NASDAQ:QQQE = Equal Weight #NASDAQ100
Never broke its ATH & it is Oversold on the daily chart.
Weekly charts put it in the middle of the range.
RSI needs to stay here to remain bullish.
$ Flow has slowly waned.
Nasdaq 4h Daily Commentary
"#Nasdaq : On the 4-hour chart, there's a clear indication that the price continues to move downwards. If we are bearish, I expect to see the price fill the liquidity gap and then break the previous low, directing the liquidity in Tue 16 Orderblock. However, if we break the last bearish defense in the chart, it will lead us to anticipate a rally upwards. I will provide daily updates on the 4-hour charts. If you have any questions or something you would like me to include in my analysis tomorrow, please leave it in the comment section below.
Good luck to everyone in their trading endeavors!"

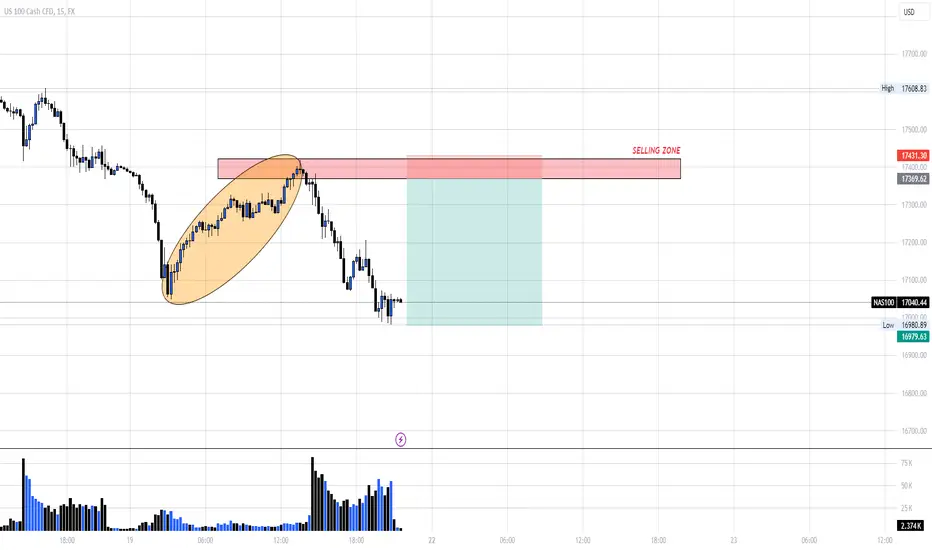
SELL NASDAQAs you can see on the chart,
The market has depleted all the buyers power in the last up move (as shown on the chart) and got overtaken by the sellers.
Now we'll wait for the market to go up to our Selling zone at 17369.62, SL and TP as sat on the chart.
For further questions doon't hesitate to ask!
Nasdaq-100 Index. Meet and Greet March Quarter Earnings Season.US stock indices, including the benchmark American economy S&P500 index (SPX) and US BigTech Nasdaq-100 index (NDX), are retreating from their yearly highs, moving to a more aggressive decline last Friday, April 12.
Investors digest the first portion of earnings reports for March quarter 2024 - traditionally starting with financial sector Earnings reports.
New Earnings season has begun! Perfect!
Well... sounds good. Anyway...
JPMorgan (JPM), Citigroup (C) and Wells Fargo (WFC) reported first-quarter earnings that beat forecasts, but a large number of persistent inflation pressures are still building and continuing.
JPMorgan CEO James "Jamie" Dimon warned that while the stock market is healthy and most economic indicators look favorable, there are still significant risks that could arise at any time.
"Looking ahead, we remain alert to a number of significant uncertain forces. First, the global landscape is troubled, horrific wars and violence continue to cause suffering, and geopolitical tensions are rising. Second, there appear to be a large number of persistent inflationary pressures. Pressure that is likely to continue," - Dimon said on the conference call.
On the inflation front, US import prices rose for the third straight month in March, slightly above the consensus forecast of 0.4% month-on-month. Almost all of the rise in import prices was driven by the recent rise in oil prices.
The fight against inflation - which has transformed into a classic chronic illness from a relatively minor cyclical problem driven by a low Covid-19 base - appears to have reached a stalemate, and the first rate cut will not occur until December, Bank of America (BAC) now says.
Despite the fact that at the beginning of 2024, the market was almost 100% confident that at least one rate cut would take place by the June FOMC meeting, and by the December meeting, the number of rate cuts could reach three.
Monetary easing by June is looking more and more like an unattainable dream, tempered by the latest data.
Recent inflation data, while in line with expectations, doesn't give the Federal Reserve much reason to rush.
But if the central bank doesn't cut rates by June, it will likely delay any cuts until March 2025, Bank of America strategists said.
In reality, long-term forecasting of the US Federal Reserve's monetary policy curve is not an easy task, given that only forecasts for the next FOMC meeting, which is scheduled for May 1, and for which the market does not factor in a change in interest rates, can be relatively reliable.
Of much greater significance is that the same arguments and theses that are presented in the reports of the largest American banks - the locomotive of the American economy - may find their repetition or imitation in Earnings reports for Q1'2024 of dozens and hundreds of other companies over the next two-three months.
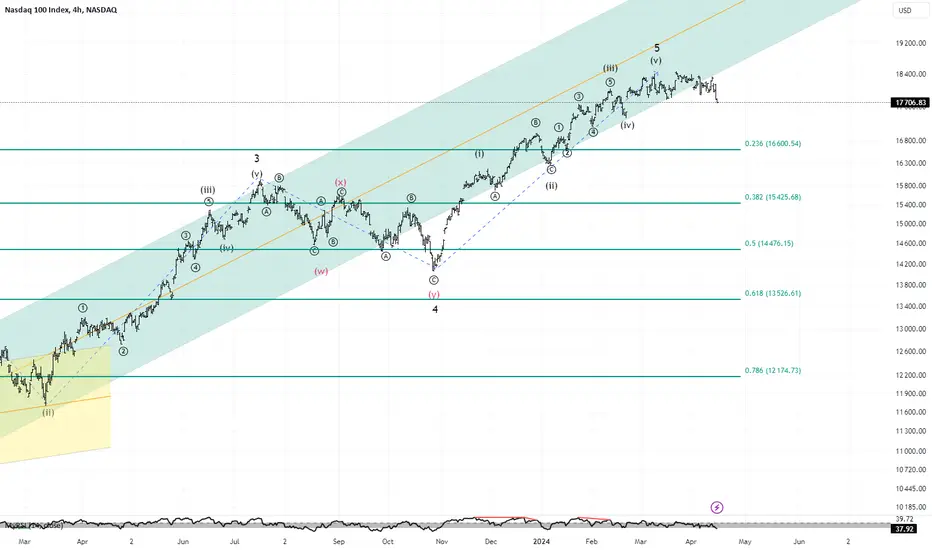
Technically, the main chart of the Nasdaq-100 Index (NDX) featured in the idea is in a long-term positive trend of a weakly rising channel, above its 5-year SMA.
At the same time, taking into account the possibility of escalation of macroeconomic and political risks, one cannot exclude the prospect of its decline to the lower border of the channel - down to the levels of 12,500 - 13,000 points.
Also lets take into account the fact that the entire 10-12 percent Nasdaq-100 increase from Q4'21 highs to nowadays can be easily represented as the transposition of a 200% increase in the shares of only one company - Nvidia (with its near 6% allocation in the index), - which increased in price from $320 to over $960 per share over the same period of time - from Q4'21 by Q1'24.
