Nasdaq (us100)
Hello
Let's have a new update of Nasdaq
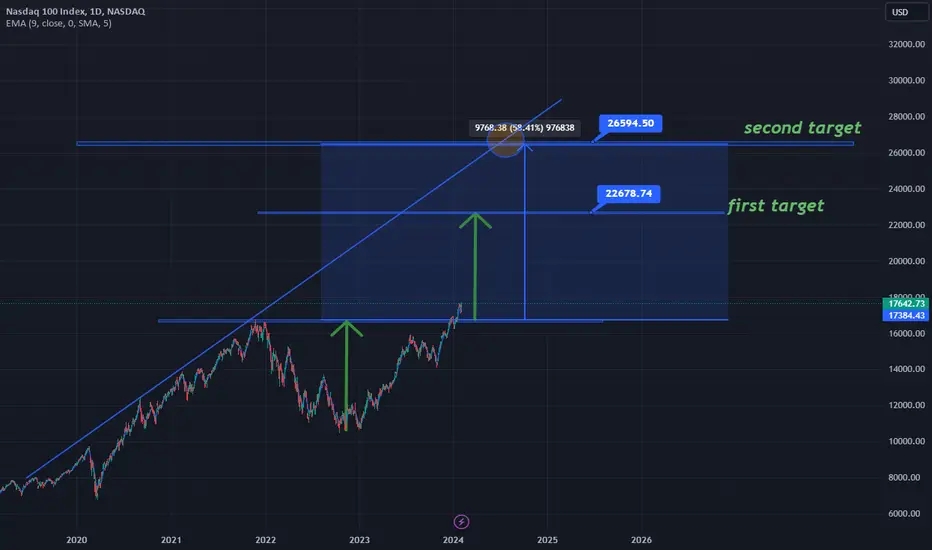
Well, we see that we are strongly bullish. Be careful, friends, do not enter into sales transactions
Only sell as a quick scalp
With this bullish intensity, targets of 19,000 and 20,000 will be available
Do not enter into any transaction without confirmation
Nasdaq100

Perhaps a 'Santa Rally' is just one step away to begin this yearStock markets often enjoy a seasonal share boost during the festive period.
It's been an unpredictable year for stock markets after gloomy 2022 but all we are, traders, investors, TradingViewers are hoping for a successful end-of-year boost in the form of a so-called Santa rally.
Shares have delivered a mixed performance so far in 2023, amid SVB crisis, high inflation and interest rate hikes, so while children are compiling their Christmas lists, traders also want some sweet candies.
Traditionally, festive cheer and holiday household spending make the markets more optimistic during the holiday season, boosting investor portfolios.
But will 2023 follow the trend?
The "Santa rally", a term coined in 1972 by Yale Hirsch, the founder of the Stock Trader’s Almanac, "describes a tendency for the stock market to go up by 1% to 2%" over final five trading days of the outgoing year and the first two of the new one, said Forbes Advisor .
This period has "historically" shown higher stock prices in the S&P 500 CBOE:SPX 79.2% of the time, says Investopedia .
What drives the Santa rally?
Reasons for the Santa rally are vary and one explanation is the cheery "end of year mood" that means investors are in more of a "buying temperament" rather than selling shares, which pushes up stock prices
Will there be a Santa rally this year?
Probably, Yes. November "capped off the best three months" for global shares since the pandemic stock market recovery in 2020, so there are a lot of hopes that stars will align, and momentum in the markets, helped by declining U.S. Treasuries rate, will push prices higher in the run-up to Christmas.
Sure, there is "no guarantee", though. Sometimes it happens. Sometimes not.
The odds of a Santa rally may be in your favor, but the "best option" (author's opinion) is to do nothing, remain invested and be "pleasantly surprised" by another strong month by the new year.
The main technical graph for SPDR S&P500 ETF Trust AMEX:SPY says that we right now somewhere around 460 U.S. dollars per share (relevant to 4'600 points for CBOE:SPX Index), and just one step to break it out to reach CBOE:SPX 5'000 Milestone by the end of the year.
Just follow the major upside trend, that's been taken from Q4'22. And that is all.
Merry Christmas y'all, TradingViewers! See you in a Happy New 2024 Year! 💖💖

Nasdaq Intraday Review - Thursday 8 Feb 2024I trade Nasdaq intraday exclusively
Trading in GMT time zone
Sharing my post day review and analysis in case it can help you!
Looking exclusively for buys - the trend is your friend! :)
Did my analysis at +- 5:20am
During analysis noted the following:
Bulls rallied over 2000 pips yesterday and overnight, had managed to keep price at this level.
Market has consolidated in a triangle / rising wedge pattern (I felt it was more a rising wedge pattern based on the bodies of the candles)
Rising wedge patterns tend to break down, but can break either way
Pivot point and fib levels are far down from where price currently is, +- 800 pips. So I need to be careful buying because if the market does retrace, it is a big draw down that I will have to handle.
Initial jobless claims will be released today - I feel that due to the sensitivity of the Fed / interest rate debate, this may cause volatility at time of release.
Pivot point zone looks of interest to me as a potential buy zone because it is close to the 1H 0.382 fib level, creating an area of confluence.
This fib drawn from swing low at A. to swing high at B.
To make matters a bit more exciting, I am not able to be at my trading screens today. This means I need to set my buy limits and hope for the best.
I set my buy limit for 50% of my usual position size at C. - Confirmations:
Fib - This represented the 0.382 fib level
S&R - pivot point
I set a second buy limit at D. for 50% of my usual position size - Confirmations:
Fib - This represented the 0.618 fib level
Trendline - blue uptrend line, intersecting this area
S&R - 4H 20 EMA was roughly at this level
Unfortunately, price never reached my buy zones.
When I returned to my screens and did my analysis, I noted that the entry for today would have been quite clear.
If I was trading properly today, I would have entered at E. because price made a nice double bottom just above my zone, by the 1H EMA.
I would have entered on the break of the neckline, which also meant that price had broken back above the 1H EMA
There was also a nice inverted hammer candle on the 1H TF, followed by a green momentum candle at E. further supporting the buy entry.
Market moved up from here +- 700 pips.
What could I have done differently?
Nothing, as I wasn’t able to be at my desk today! :(
Hope you had a good trading day!
TF = timeframe
TP = take profit
1H = 1 hour
4H = 4 hour
D = day
W = week
M = month
S&R = support & resistance
EMA = Exponential moving average

NASDAQ Elliott Wave Analysis for Friday 09/02/2024We are looking at wave (3) in the higher time frame. Wave 1 of wave (3) could be finished or we had a relatively short wave (3). This is unclear for now. We reached the limits of the bearish scenario, we need to see downside from the current level.

Nasdaq Intraday Review – Wednesday 7 Feb 2024I trade Nasdaq intraday exclusively
Trading in GMT time zone
Sharing my post day review and analysis in case it can help you!
Did my analysis at +- 5:20am
During analysis noted the following:
The 4H EMA has acted as a strong support for 2 x 4H candles (marked at A.)
The D neckline (you see it better on the line chart) that was previously broken down and re-tested by market, is resistance turned support & is acting as a strong support
Trend is clearly uptrend - nearly seen from D line chart
Looking exclusively for a buy - The trend is your friend
Entered a sell (even though I just said I was looking for buys ;) ) at B -
Confirmations:
- Market Patterns - Market had broken the 4H neckline marked in pink, travelled down the same distance as the height of the pattern i.e. reach profit target and was now returning to test the neckline. The early morning bulls had pushed past the neckline but met bear resistance at C. It looked as if bears had won the battle as price was pushed below 1H + 30min EMA + pivot point at E. So even though I was looking for a buy, I believed market would sell as neckline failed the bull re-test
- Candlesticks - Strong bear momentum candles between E. and B. on 15min through to 1 H TF
- Fib - Point C. was at the seller's 0.618 fib retracement level and market was moving aggressively down
- S&R - Pivot point had failed as support and 30min + 1H EMA was acting as resistance
- Trendline - This was against the trend but I looked to me like a trend change in progress
The 4H EMA + the red support line of the "D Neckline " was too strong for bears to break down and ultimately market moved up from here.
I closed at my mental stop, which was the thick pink line, taking a loss of 445 pips.
Usually I would have been discouraged that my first entry for the day did not work out. Usually, self-doubt creeps in and I become very insecure and hesitant.
Today, I was determined not to let that happen and keep my mental state as level as possible.
Watching price action carefully and needing to be convinced that market had indeed properly broken through the neckline, I entered a buy at D. -
Confirmations:
- Market Pattern - My initial reason for selling is not turned around so, price seemed to have convincingly broken through the neckline, meaning that the down trend was over and an uptrend would begin
- Fib - Point B. was at the buyers 0.50 fib level, representing a strong fib level
- Candlesticks - I opened a buy after a very long wick green hammer candle closed on the 15min TF. This represented market testing the pivot point one last time with a big rejection.
- S&R - The 30min + 1H EMAs + pivot had turned into support
- Trend - Trading with the overall trend which usually tends to be my most profitable trades. Also the orange temporary down trend had been broken
Usually when self-doubt creeps in, I tend to open very small positions in an attempt not to increase my losses for the day. But this time I opened at my full position size.
As market moved up, I closed partial profits to cover my losses for the day and still have a runner open which I will close as per what the candles are saying.
Market has moved 1886 pips from my position, I am trading risk free (stop loss at entry) with my losses covered for the day.
So I am a happy chappy!
Ultimately I closed my position at 17739, when a double top started forming on the 30 min.
What could I have done differently?
I had analysed in the morning that the 4H EMA and the red slanted support line were very strong, but I choose to ignore that when I entered my sell as price was right at this level.
I should have waited to see how price would react to these strong elements before jumping in.
Hope you caught this nice buy!
TF = timeframe
TP = take profit
1H = 1 hour
4H = 4 hour
D = day
W = week
M = month
S&R = support & resistance
EMA = Exponential moving average

Copper futures. Disinflation is almost there to comeCopper futures fell further to around $3.8 per pound, marking a weekly loss driven by concerns over demand from China and heightened US interest rates.
China's manufacturing sector contracted for the fourth consecutive month in January, contributing to the negative sentiment.
With a robust US jobs report, expectations of a Federal Reserve rate cut in March have diminished.
Weaker Q1 industrial activity is expected to dampen demand, although Glencore's projected 5% production decline in 2023, along with an anticipated additional drop in 2024, could offset this.
Despite these challenges, there is still hope that China will implement measures to stabilize its economy.
Technical graph illustrates also, 5-years SMA is a massive long term support in this time for Copper futures COMEX:HG1! , as it breakthrough can deliver solid further losses for Copper futures prices, like in 2020 (30% off), in 2014-16 (40% off) and in 2008-09 (50% off).

NASDAQ ANALYSIS💸NASDAQ💸
Chart : 4Hour
Overall Trend : Bullish
Current Market Structure : Consolidation
Scenario 1 :
Market has been respecting our supply area at 17690 , As you can see price is failing to break above this area .
we can look for short term selling set ups if the market gives us one . We trade on confirmation only .
If we do get a break to the downside , we will be targeting the following demand area at 17200.

Wolfe Research thinks NAS100 moves higherWolfe Research thinks NAS100 moves higher
Several mega-cap entities, including Meta and Nvidia, are propping up the Nasdaq 100, following Jerome Powell's 60 Minutes interview on Sunday, which has further diminished the likelihood of a March rate cut (currently below 20%, according to the Financial Times).
Potential support zones might materialize around the 17,450 and 17,100 levels, with the latter representing the bottom of last week's significant wick. Positioned just above this level is the 20-day moving average.
Short-term declines could be possible entry opportunities into the market, with a particular focus on the support levels. Wolfe Research anticipates the market's upward grind to persist until U.S. economic growth expectations diverge from current projections, with smaller-cap stocks overperforming as they play catch-up to their mega-cap counterparts. The first resistance worth monitoring appears near 17,600, roughly aligning with the all-time highs for the index.

NASDAQ Elliott Wave Analysis for Wednesday 07/02/2024We are looking at wave (3) in the higher time frame. Wave 1 of wave (3) could be finished or we had a relatively short wave (3). This is unclear for now. We reached the limits of the bearish scenario, we need to see downside from the current level.

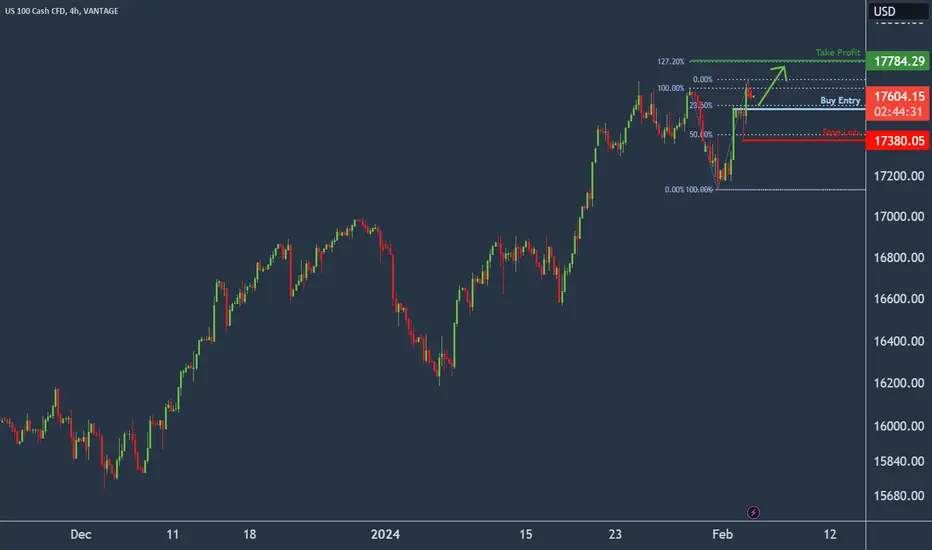
Nasdaq-100 H4 | Falling to pullback supportThe Nasdaq-100 (NAS100) is falling towards a pullback support and could potentially bounce off this level to rise towards our take-profit target.
Entry: 17,539.30
Why we like it:
There is a pullback support that aligns with the 23.6% Fibonacci retracement level
Stop Loss: 17,380.05
Why we like it:
There is a pullback support that aligns close to the 50.0% Fibonacci retracement level
Take Profit: 17,784.29
Why we like it:
There is a resistance that aligns with the 127.2% Fibonacci extension level
Please be advised that the information presented on TradingView is provided to Vantage (‘Vantage Global Limited’, ‘we’) by a third-party provider (‘Everest Fortune Group’). Please be reminded that you are solely responsible for the trading decisions on your account. There is a very high degree of risk involved in trading. Any information and/or content is intended entirely for research, educational and informational purposes only and does not constitute investment or consultation advice or investment strategy. The information is not tailored to the investment needs of any specific person and therefore does not involve a consideration of any of the investment objectives, financial situation or needs of any viewer that may receive it. Kindly also note that past performance is not a reliable indicator of future results. Actual results may differ materially from those anticipated in forward-looking or past performance statements. We assume no liability as to the accuracy or completeness of any of the information and/or content provided herein and the Company cannot be held responsible for any omission, mistake nor for any loss or damage including without limitation to any loss of profit which may arise from reliance on any information supplied by Everest Fortune Group.
NASDAQ Elliott Wave Analysis for Monday 05/02/2024 (+ HTF)We are looking at wave (3) in the higher time frame. Wave 1 of wave (3) could be finished or we had a relatively short wave (3). This is unclear for now. We reached the limits of the bearish scenario, we need to see downside from the current level.

NDX / 4H / TECHNICAL ANALYSIS NASDAQ:NDX The support level at 16019 indicates the formation of a bearish wedge pattern and an AB=CD pattern. I have identified my targets on the chart based on these formations.
Like and comment if you find value in our analysis.
Feel free to post your ideas and questions at the comments section.
Good luck

NASDAQ100 Slows Down For An Intraday CorrectionNasdaq100 is in strong bullish trend and there can be room for more upside within a projected intraday five-wave bullish cycle. Nasdaq100 futures recently slide as Alphabet shares drop on disappointing Google ad revenue. However, that's pretty nice textbook 17300 - 17200 support area within an (a)-(b)-(c) correction for wave "iv", so ahead of today's FED meeting, be aware of a bullish continuation for wave "v". Invalidation level is at 17050.

Nasdaq-100 H1 | Potential bearish reversalThe Nasdaq-100 (NAS100) is rising towards an overlap resistance and could potentially reverse off this level to drop lower.
Sell entry is at 17,336.83 which is an overlap resistance that aligns with the 38.2% Fibonacci retracement level.
Stop loss is at 17,550.00 which is a level that sits above the 61.8% Fibonacci retracement level and a pullback resistance.
Take profit is at 17060.59 which is an overlap support that lies above the 61.8% Fibonacci retracement level.
High Risk Investment Warning
Trading Forex/CFDs on margin carries a high level of risk and may not be suitable for all investors. Leverage can work against you.
Stratos Markets Limited (www.fxcm.com):
CFDs are complex instruments and come with a high risk of losing money rapidly due to leverage. 66% of retail investor accounts lose money when trading CFDs with this provider. You should consider whether you understand how CFDs work and whether you can afford to take the high risk of losing your money.
Stratos Europe Ltd, previously FXCM EU Ltd (www.fxcm.com):
CFDs are complex instruments and come with a high risk of losing money rapidly due to leverage. 70% of retail investor accounts lose money when trading CFDs with this provider. You should consider whether you understand how CFDs work and whether you can afford to take the high risk of losing your money.
Stratos Trading Pty. Limited (www.fxcm.com):
Trading FX/CFDs carries significant risks. FXCM AU (AFSL 309763), please read the Financial Services Guide, Product Disclosure Statement, Target Market Determination and Terms of Business at www.fxcm.com
Stratos Global LLC (www.fxcm.com):
Losses can exceed deposits.
Please be advised that the information presented on TradingView is provided to FXCM (‘Company’, ‘we’) by a third-party provider (‘TFA Global Pte Ltd’). Please be reminded that you are solely responsible for the trading decisions on your account. There is a very high degree of risk involved in trading. Any information and/or content is intended entirely for research, educational and informational purposes only and does not constitute investment or consultation advice or investment strategy. The information is not tailored to the investment needs of any specific person and therefore does not involve a consideration of any of the investment objectives, financial situation or needs of any viewer that may receive it. Kindly also note that past performance is not a reliable indicator of future results. Actual results may differ materially from those anticipated in forward-looking or past performance statements. We assume no liability as to the accuracy or completeness of any of the information and/or content provided herein and the Company cannot be held responsible for any omission, mistake nor for any loss or damage including without limitation to any loss of profit which may arise from reliance on any information supplied by TFA Global Pte Ltd.
The speaker(s) is neither an employee, agent nor representative of FXCM and is therefore acting independently. The opinions given are their own, constitute general market commentary, and do not constitute the opinion or advice of FXCM or any form of personal or investment advice. FXCM neither endorses nor guarantees offerings of third-party speakers, nor is FXCM responsible for the content, veracity or opinions of third-party speakers, presenters or participants.

NASDAQ Elliott Wave Analysis for Friday 02/02/2024We are looking at wave (3) in the higher time frame. Wave 1 of wave (3) could be finished or we had a relatively short wave (3). This is unclear for now. We reached the limits of the bearish scenario, we need to see downside from the current level.

NASDAQ 100 E-mini Futures SHORT ALERT This is not a signal is just my opinion. Trade at your own risk!

NASDAQ Falls by 1.5% after Tech Giants ReportsNASDAQ Falls by 1.5% after Tech Giants Reports
NASDAQ E-Mini futures fell 1.5% in early trading after the publication of quarterly earnings reports from technology giants Google (GOOG), Microsoft (MSFT) and Advanced Micro Devices (AMD):
→ The parent company of Google, Alphabet Inc., reported revenue of 86.3 billion dollars (forecast = 85.2), however, the slowdown in advertising revenue – the most important article in the company's revenue – caused the price of GOOG shares to drop by 2.7% after publication report
→ Microsoft's revenue amounted to 62.0 billion US dollars, increasing by 10% (forecast = 61.2%). Despite the high performance of the cloud segment Azure, the price of Microsoft shares decreased by 3.2% after the publication. Perhaps the MSFT stock market is overbought due to the extreme optimism associated with AI implementation.
→ AMD, the leading semiconductor manufacturing company, also exceeded expectations. Its income was 6.16 billion US dollars (forecast = 6.12). However, the company made a cautious forecast for the next quarter. The price of AMD shares fell by 4.5%.
The cumulative effect of these messages strongly influenced the price of the NASDAQ E-Mini index. Perhaps the market is “letting off steam” after the impressive growth that began in 2023. MarketWatch conveys the opinions of JPMorgan analysts — they believe that today's stock market, which is dominated by large technology companies, has signs of a dotcom bubble.
The NASDAQ 100 chart shows that:
→ price forms a bear pattern head-and-shoulders;
→ the price is located near the support block, which forms the median line of the ascending channel (shown in blue) and the support level is 17333.
If bearish sentiments intensify at the opening of the main trading session, the bears can break through the specified support block and direct the price to the block that forms the psychological level of 17,000 and the lower border of the channel.
This article represents the opinion of the Companies operating under the FXOpen brand only. It is not to be construed as an offer, solicitation, or recommendation with respect to products and services provided by the Companies operating under the FXOpen brand, nor is it to be considered financial advice.
NASDAQ Elliott Wave Analysis for Wednesday 31/01/2024We are looking at wave (3) in the higher time frame. Wave 1 of wave (3) could be finished or we had a relatively short wave (3). This is unclear for now. We reached the limits of the bearish scenario, we need to see downside from the current level.

Nasdaq Intraday Review – Monday 29 Jan 2024I trade Nasdaq intraday exclusively
Trading in GMT time zone
Sharing my post day review & analysis in case it can help you :)
Did my analysis at +- 5:20am.
My feeling about today’s price action was that price would just consolidate as we all wait for this action packed week to kick off.
No amount of technical analysis will help – bears or bulls will step in depending on the earnings + guidance provided this week and FOMC.
My ideal plan would be to get a buy in as low as possible and then hopefully market would start pushing up in anticipation for the earnings on Tuesday. Then I would just hold as I expect earnings + guidance to be good and a further rally to ensue.
At time of analysis I noted the following:
Formation of a consolidation triangle (marked with turquoise lines)
Double top had formed on 1H TF (marked at yellow dot with purple lines), reached profit target (at B.) and now coming back to test neckline
Bears stepped in previously at A. (as seen by the red candles at A. on the 1H TF) but support of pivot point and 30min + 4H EMA was holding strong.
Turquoise uptrend line confirmed with 3rd touch and close above at B. therefore validating this uptrend line.
Green doji candle close on 1H TF at C.
I entered a buy at D. – confirmations:
S&R – price respecting 30min EMA well (when market is very bullish then this EMA is respected). When price started closing above the 1H EMA and 4H EMA, I knew that these EMA’s would not act as resistance.
Candlesticks – 1H green doji right on pivot point
Fib – none
Trendline – Turquoise uptrend line respected
It was an aggressive entry as 1H neckline still had not been broken through, but I felt that if market was going to drop from the neckline, then it would have done so at A. already.
Due to aggressive nature of this entry, I entered only 20% of my usual position size.
Mental stop was placed at thick pink line.
Market moved up, I secured at entry but bulls could not break through the 4H neckline at E. on this attempt.
Unfortunately, market came back down to take me out at entry.
I decided to stay out as market was choppy.
Unfortunately, price eventually took off without me. So I missed out on the move that I was anticipating and hoping for.
But Nasdaq is never short of entry opportunities, and I live to trade another day.
Hope you caught the buy!
What could I have done differently:
I should have set a buy limit at B. the night before, because price had not travelled the full distance as the height of the market pattern at the yellow dot.
This would have been such a great level to enter and hold for earnings!
Next time ;)
TF = timeframe
TP = take profit
1H = 1 hour
4H = 4 hour
D = day
W = week
M = month
S&R = support and resistance
EMA = exponential moving average

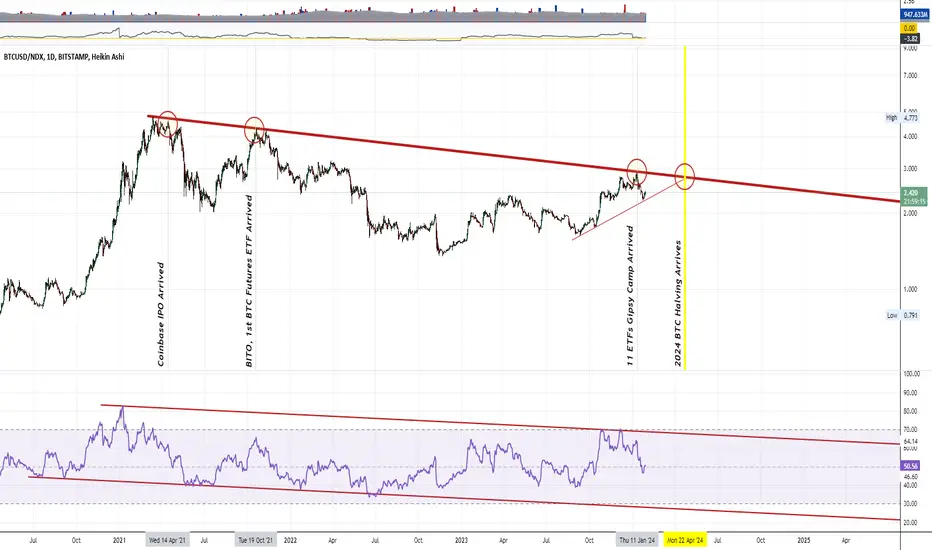
BTC VS NDX. FOLLOWING THE BEARISH SCENARIOPreviously in the Series..
👉 Launch of BTC futures on December 18, 2017
Bitcoin is down more than 10 percent in a week and crashed 80+ percent in a year.
👉 Launch of trading on Coinbase IPO NASDAQ:COIN on April 14, 2021
Bitcoin is down more than 10 percent for the week and crashed 50+ percent for the quarter.
👉 Launch of AMEX:BITO - the first fund based on BTC futures, on October 19, 2021
Bitcoin is down more than 10 percent in a week and crashed 80+ percent in a year.
👉 Launch of ̶G̶i̶p̶s̶y̶ ̶C̶a̶m̶p̶ 11 ETFs on BTC, incl. on BTC spot, on January 11, 2024.
Bitcoin has slumped by more than 10 percent in a week and further losing its shores.
The main technical graph is a ratio between Bitcoin BITSTAMP:BTCUSD and NASDAQ:NDX Nasdaq-100 Index.
Indeed, BTC underperforms against NDX, almost for a 3 years in a row..
But blind faith is ineradicable..
Who knows, what BTC halving has to say..
The truth is One and Only - just trend is your real friend ! 😄
Nasdaq (us100)
Hello dear friends
Let's go with beautiful weekly analysis
We are watching Nasdaq on Saturdays to see how it reacts to the drawn areas. We can make good profits from the market with the areas drawn and explained in the video
Stay with us

NASDAQ Elliott Wave Analysis for Monday 29/01/2024We are looking at wave (3) in the higher time frame. Wave 1 of wave (3) could be finished or we had a relatively short wave (3). This is unclear for now. We reached the limits of the bearish scenario, we need to see downside from the current level.
