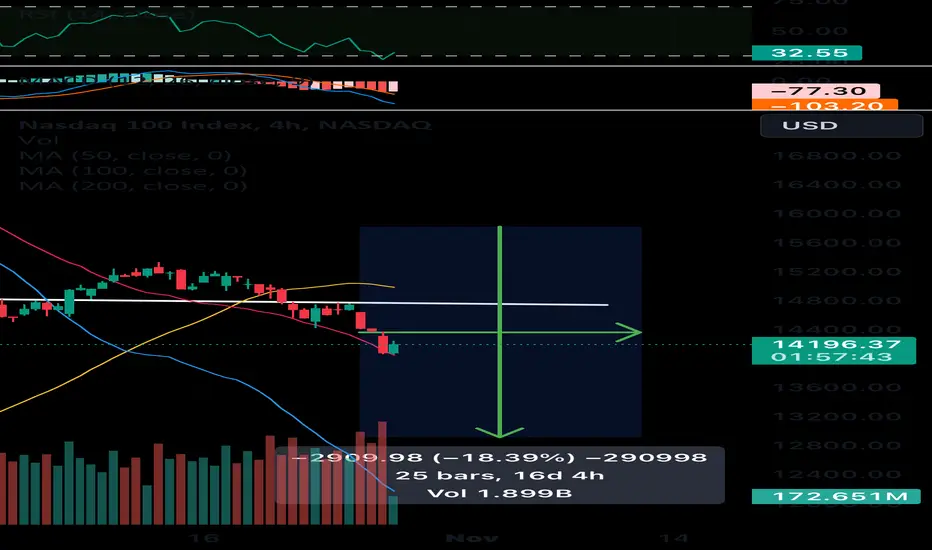
USTECH Trade Plan Timeframe: 4HUSTECH Trade Plan Timeframe: 4H
#NDX100 #NASDAQ #USTECH #TradingwithBelieve #TradingOpportunity #Divergence #TradingSignal #USTECHtradingsignal #Forex
Hey traders! 👋 Let's dive into a potential trading opportunity on the USTECH pair using technical analysis. 📊
📉 Previously Bullish Trend:
Firstly, on the 4H- timeframe, we've been witnessing a Bullish trend in the USTECH pair. 🐻
🔄 Divergence on HH’s:
However, it's crucial to note that recently, we have started to observe a divergence pattern on the HH’s. This is an important signal that the Bullish momentum might be weakening. 📉🔄:
📊 Trade Opportunity:
Currently, we are looking at a potential trade opportunity with a Bearish bias.
📈 Entry Price: 15212
🎯 Stop Loss Level: 15407
🚀TP1: 15013
🚀TP2: 14824
💰 Investment Advice:
Please remember that trading carries risks, and it's essential to have a well-defined trading plan, proper risk management, and stop-loss orders in place. This analysis is for educational and informational purposes only and should not be considered as financial advice. Make sure to do your research and consider your risk tolerance before entering any trade.
Happy trading, and may the pips be in your favour! 🚀📈💰 #HappyTrading #ProfitOpportunity #TradeSmart #CryptoSignal #StockSignal #TradingwithBelieve
Nasdaq100

NASDAQ Elliott Wave Analysis for Thursday 09/11/2023The WXY structure as a wave (4) was invalidated. Therefore, the primary scenario now calls for the end of wave (4) as a WXYXZ structure. In the lower time frame, we are looking at an ending impulse but it is too early to call for the high.

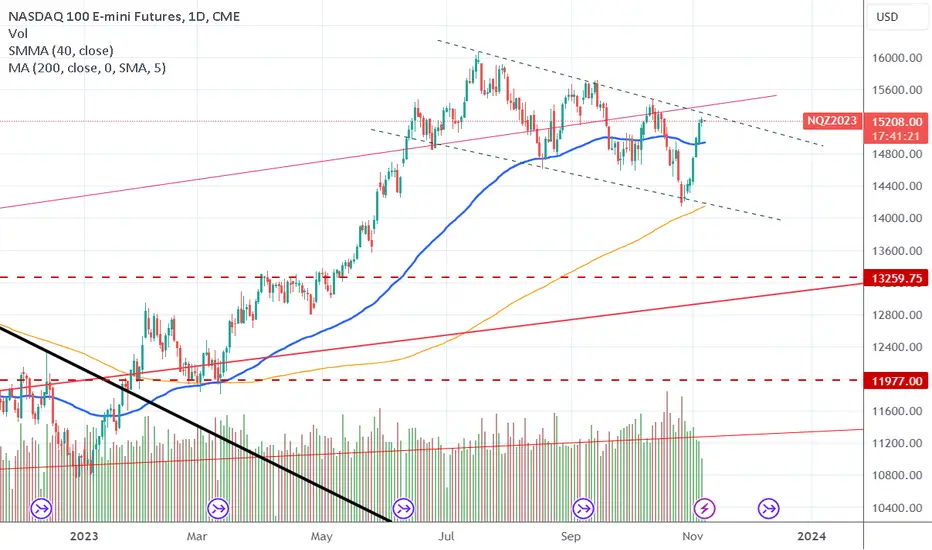
$NQ1! Resistance coming up.Very little room for upside before resistance is met. Neutral until resistance or an upside break is confirmed. Nasdaq had a terrific ,but hard run last week. Time for a breather.
NASDAQ Elliott Wave Analysis for Tuesday 07/11/2023 (+ Higher TFWe are still working on the wave (4) as a WXY structure. The wave Y is unfolding as an ABC pattern and it looks like we are finishing wave ((b)). Based on a major resistance level and the S&P 500, the alternative scenario calls for the end of wave (4) as a WXYXZ structure. Price action in the lower time frame will help us to choose between the two scenarios.

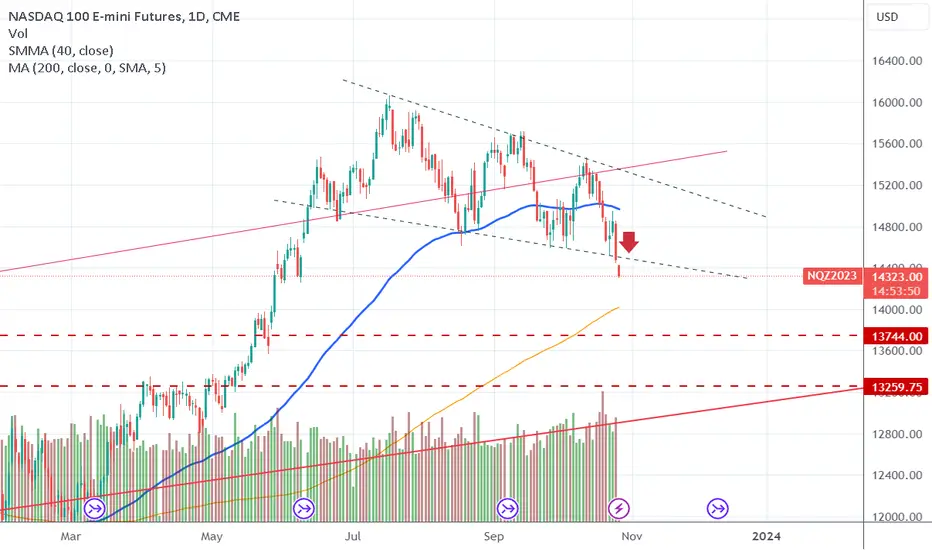
NASDAQ 100 INDEX (NDX)Target makes an impulse wave to wave 5 downtrend
- Stop Loss (15134.6)
- Target 1 (14304.0)
- Target 2 (14096.4)
- Target 3 (13888.7)

US100 BEAUTIFUL SHORT SETUP i believe we might see a bearish move soon on us100 , we have a falling trendline + key level most likely a sell from there.
what do you think

NASDAQ Elliott Wave Analysis for Friday 03/11/2023We are still working on the wave (4) as a WXY structure. The wave Y is unfolding as an ABC pattern and it looks like we are finishing wave ((b)). Based on a major resistance level and the S&P 500, the alternative scenario calls for the end of wave (4) as a WXYXZ structure.

GOOGLE - The warning signs were thereWe did not trade this directly because:
- We were short on both the Nasdaq and the SPX500.
- Both the assets above had a better RR.
- Both have made us higher percentages than Google would've so far.
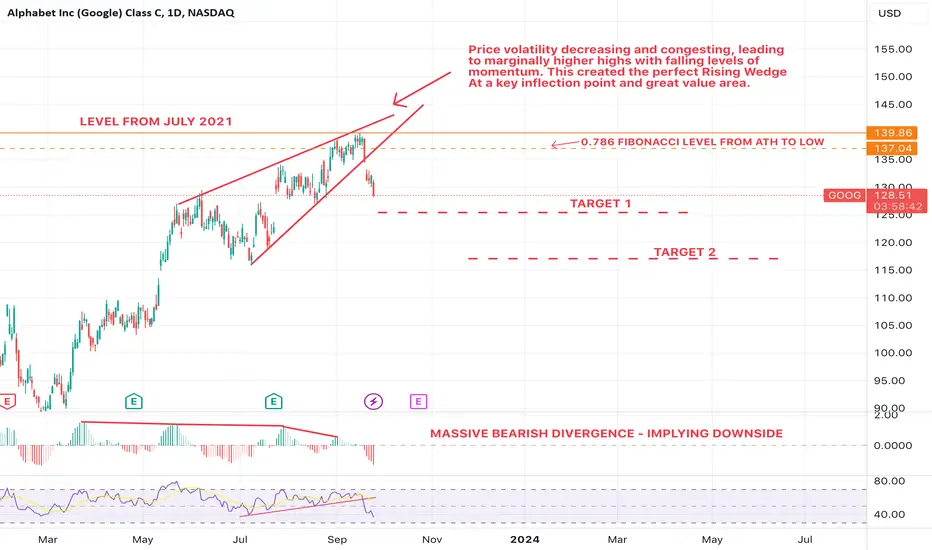
However, we deem it important to post google as it is exactly the type of trade set up that we preach about and showcases traditional Technical Analysis in its best light. It also drives the Index funds and so reflects how we've position ourselves lately.
Google broke down of its falling wedge and confirmed the breakdown. Before this it held a key level as resistance and was also showing extensive bearish divergence. Lastly, it was at a great value area for a short reaching just over the 0.786% retracement from the Low to ATH.
Please ask any questions you may have!
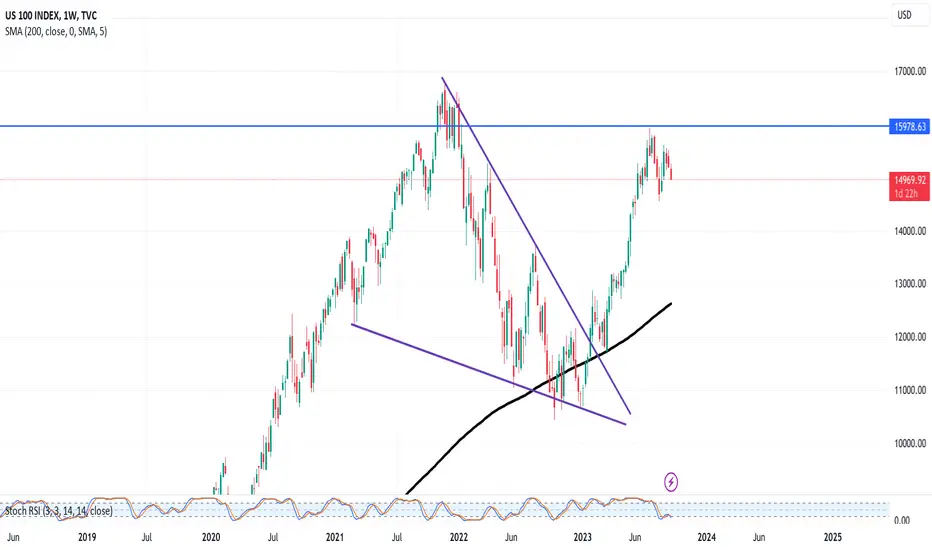
US100 Technical Analysis And Trade Idea NAS100In this video, we conduct an extensive analysis of the US100 NASDAQ, with a primary emphasis on the prevailing bullish price swing observed in the 1-day (1D) and 1-week (1W) timeframes. Notably, the currency pair is approaching a pivotal resistance level, indicating the potential for another leg down. Throughout our discourse, we delve deeply into the intricate facets of technical analysis, encompassing the current market trend, price dynamics, market structure, and other pivotal elements of TA. As we progress through the video, we take a look at an potential trade opportunity.
It is of utmost importance to underscore that the information provided in this presentation is intended solely for educational purposes and should not be construed as financial advice. It is imperative to recognize that engagement in foreign exchange trading carries a substantial degree of risk. Consequently, it is vital to judiciously integrate robust risk management strategies into your trading plan.

NASDAQ Elliott Wave Analysis for Thursday 02/11/2023We are still working on the wave (4) as a WXY structure. The wave Y is unfolding as an ABC pattern and it looks like we are finishing wave ((b)). Based on a major resistance level and the S&P 500, the alternative scenario calls for the end of wave (4) as a WXYXZ structure.

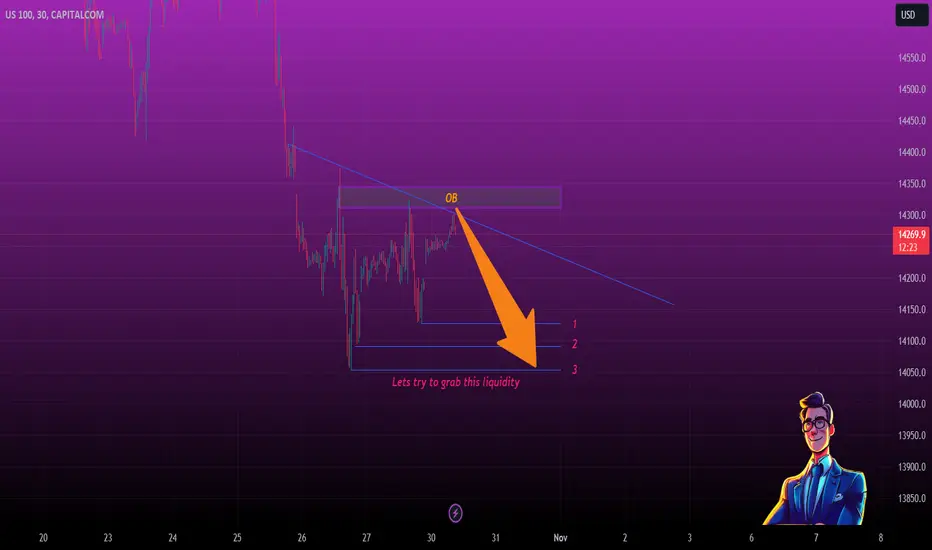
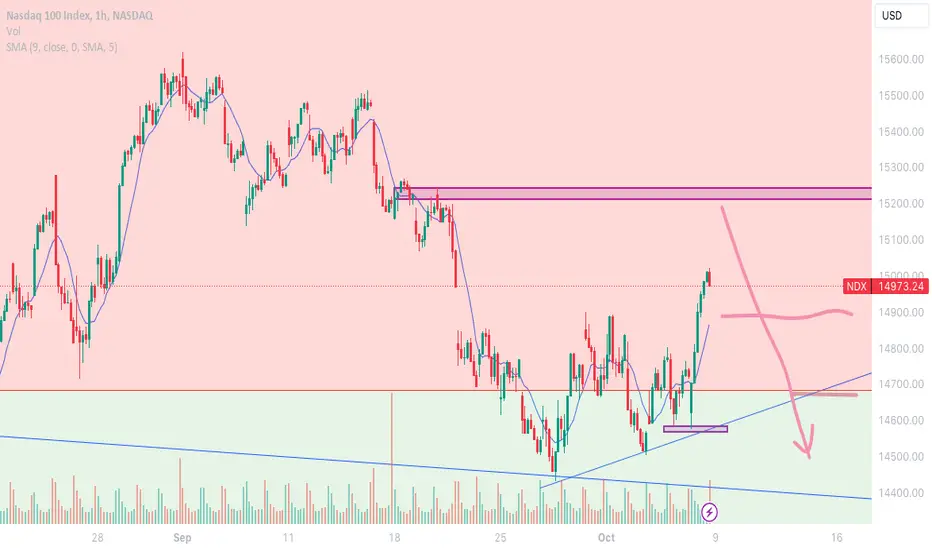
NASDAQ working with liquidityHello trader! Today, let's trade the good old US100. A nice setup has formed for entry and taking out the lower liquidity. There are possibilities that the price may go and take out the liquidity from above, but the chances of a move downwards are much higher.
🚀Please support my efforts with the "Boost" button.
❤️And a comment is the best thing you can do for me now!
NASDAQ Elliott Wave Analysis for Wednesday 01/11/2023We are still working on the wave (4) as a WXY structure. The wave Y is unfolding as an ABC pattern and it looks like we are finishing wave ((a)). Based on a major resistance level and the S&P 500, the alternative scenario calls for the end of wave (4) as a WXYXZ structure.

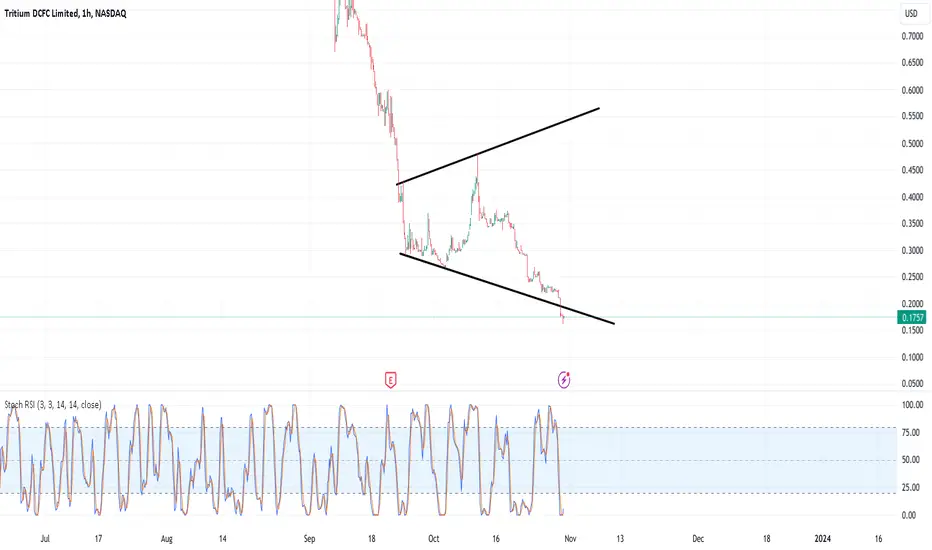
DCFC f-ing meWelp my average buy in is $0.43, CEO hugged biden or something thought it was a safe punt at $0.70 after 99% draw down lol. Down more then I would like to admit on this one, but still only 5% of trading account....not ideal of course. Lets see what happens. Will sell before year for tax loss. Not Advise, good luck.
NASDAQ Elliott Wave Analysis for Tuesday 31/10/2023We are still working on the wave (4) as a WXY structure. The wave Y is unfolding as an ABC pattern and it looks like we are finishing wave ((a)). Based on a major resistance level and the S&P 500, the alternative scenario calls for the end of wave (4) as a WXYXZ structure.

sells zone in nasdaq -us100 we have the nasdaq with a sell signal after eating all the liquidity from the previous sessions of last week now we can go down to other points of interest

$NQ1! Looking bearish, but...I'll be looking for a retest of the support line break we saw yesterday
If we're lucky we can see that this week still
If the support like is retested but fails to break, it will indicate a good short position
Target for a short position will be 13750.
Lots of open air below.
Waiting for a retest/break
usa nasdaq UT 100 sellsell from that position we are on our way to sell but take care of the stop shown in the graph
NASDAQ Elliott Wave Analysis for Monday 30/10/2023 (+ Higher TF)We are still working on the wave (4) as a WXY structure. The wave Y is unfolding as an ABC pattern and it looks like we are finishing wave ((a)). Based on a major resistance level and the S&P 500, the alternative scenario calls for the end of wave (4) as a WXYXZ structure.

Nasdaq Index: Tech Stocks Enter Correction ZoneNasdaq slides into correction territory as tech giants grapple with challenges, while investors await Amazon’s earnings report.
The U.S. stock market opened with mixed sentiment, as the Nasdaq Composite extended its slide into correction territory due to underwhelming earnings reports. Nasdaq-100 futures dipped by 0.5%, while S&P 500 futures saw a 0.2% decline, following its lowest close since May. Meanwhile, Dow Jones Industrial Average futures inched up by 0.05%.
Earnings Disappointments and Market Reactions
Meta Platforms, the parent company of Facebook, reported third-quarter results that surpassed expectations but hinted at advertising softness in the current quarter, leading to a nearly 3% drop in Meta shares. Google-parent Alphabet’s disappointing performance, especially in its Google cloud unit, resulted in a 9.5% decline in its stock. These factors contributed to the Nasdaq Composite’s 2.4% fall, officially placing it in correction territory.
Bond Yields and Market Resilience
The ongoing correction is partly attributed to surging bond yields, with the 10-year Treasury yield nearing 5%. However, optimism emerged as third-quarter gross domestic product (GDP) figures exceeded expectations, showing a 4.9% annualized growth. If the feared recession fails to materialize and current economic trends persist, the market may rebound as it did in the past.
Market Levels and Earnings Ahead
The S&P 500 slipped below the crucial 4,200 level on Wednesday, marking its first close beneath this threshold since May. Investors are eagerly awaiting major earnings reports, including Amazon’s, which is expected to post earnings of 55 cents per share on revenue of $134.2 billion.
Technical Analysis
The current daily price of the Nasdaq 100 Index stands at 14252.40, while the 200-day moving average is at 13913.67, and the 50-day moving average is at 14986.96. This places the current price below the 50-day moving average, indicating a potential short-term bearish sentiment. However, it remains above the 200-day moving average, suggesting a more neutral stance in the longer term.
The current market sentiment for the Nasdaq 100 Index appears cautious, with short-term indicators leaning slightly bearish. The current downside momentum suggests the market is headed into the 200-day moving average line at 13913.67.
NASDAQ Elliott Wave Analysis for Friday 26/10/2023We got our confirmation that wave (4) in the higher time frame is not finished yet. We are probably working on the wave Y of a WXY correction. The wave Y is unfolding as an ABC pattern and it looks like we are finishing wave ((a)).

Lazyluchi Trades Nasdaq And Gold EP1It's been quite an eventful journey these past couple of weeks. On October 2nd, I shared my trading setups for Gold and Nasdaq100, and it's been an interesting ride ever since. Gold, although a relatively fast-moving pair, and Nasdaq100, which has its fair share of consolidations, have given me plenty to talk about. In this video, I want to share why I took these trades and why I believe they've been successful, both for Nasdaq100 and Gold.
Let's start with Gold. This precious metal has been nothing short of amazing for me, especially due to its swift price movements. Over the past seven days, I've had the opportunity to enter both buy and sell positions, and I'm thrilled to say that all of them have hit their target profits. Gold's ability to deliver these results in such a short span is a testament to its dynamic nature and the excitement it brings to the trading table.
As for Nasdaq100, it's been a bit of a slower ride. I've been holding onto this trade for a full 12 days, taking partial profits along the way. Nasdaq100 is notorious for its consolidations, which can make traders impatient, but I can't deny that it has followed through with my initial plan. While the journey has been less thrilling than Gold, it's essential to appreciate that, in trading, not every trade will be a rollercoaster ride.
But if I had to choose between the two, I'd say I've developed a soft spot for trading Gold. This week, I've marked my resistance levels at 1948 and 1987 – areas where I'd look to initiate sell positions if there's a rejection. Gold has been locked in a trading range, never quite surpassing the 2047 mark for a considerable period. This consistent back-and-forth pattern provides a captivating trading experience, and one thing I've come to admire about Gold is its swiftness in alerting you to any potential wrong moves. It's as if it has a way of saying, "Hey, you might want to reconsider."
Now, shifting our focus back to Nasdaq100, I'm still holding onto the trade. The market's indecisiveness has led me to take partial profits, as it hovers within its consolidations. My eyes are fixed on two critical levels: 15547 and 15688, where I'd consider initiating sell positions in the event of rejections. However, if these levels are breached, it might open the door for more buy opportunities, with a potential target at 16524. It's a carefully thought-out plan, and the market's response will determine the next course of action.
It's been an exciting and challenging journey over the past 12 days, juggling between Gold's dynamic moves and Nasdaq100's slower but steady path. Wishing you all an enjoyable weekend
(nasdaq wekly)
(gold weekly)

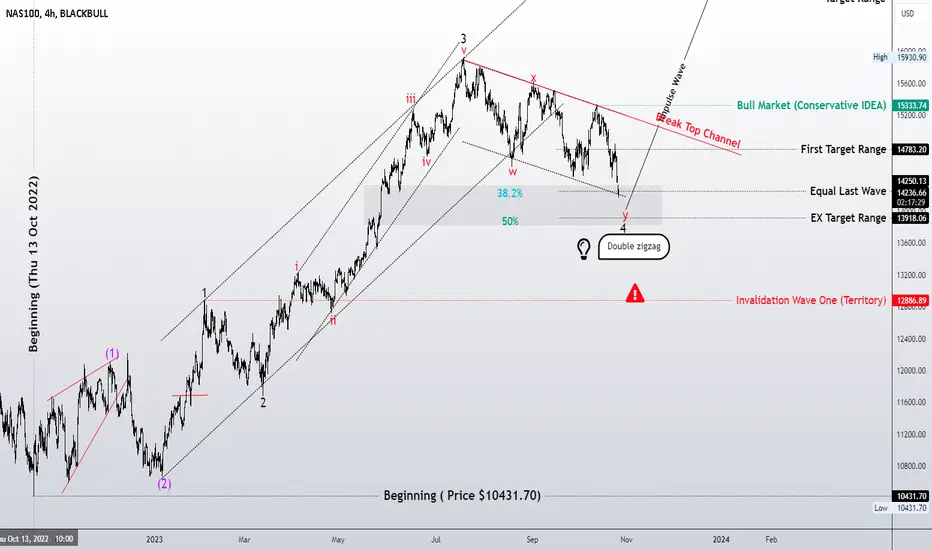
Double Zigzag ? Wave 4!!!!!Greetings, dear friends. I hope you are having a productive week.
I am happy to assist you in ensuring that all previous analyses are attached to each corresponding analysis. This will provide a comprehensive overview and help you make well-informed decisions. Please do not hesitate to let me know if there is anything else I can do to assist you further.
I want to share my market analysis ideas based on the Elliott Wave Principle with you.
I am a fan of this principle and follow all the rules and guidelines for analyzing the market.
However, please note that my ideas are based on my personal experience and may change over time.
If there is an error in my analysis, I am open to re-analyzing it from the beginning and learning from my mistakes.
It's important to understand that making an error in analysis is not a fault, but evading responsibility is.
No one can analyze financial markets with 100% accuracy, but it's remarkable how close we can get.
We analyze from multiple perspectives to consider all possibilities.
Let's mention a few opinions and ideas!
Based on mathematics.
I am still practicing to understand the Elliott Wave Principle better and hope to provide an even better analysis in the future.
Thank you for your continued support, and I look forward to our mutual success.
Best regards,
Mr. Nobody
Keep trying and never give up.
Good luck!