NASDAQ Price Trends Analysis: Identifying Overvaluation Periods The NASDAQ, one of the most closely watched stock indices globally, is often characterized by its volatility and tendency to be influenced by tech and growth stocks. In this analysis, we will examine three key elements: periods of overvaluation represented by "circles," the potential presence of hidden bullish RSI divergence in green, and bearish RSI divergence in red.
2. Overvaluation Periods:
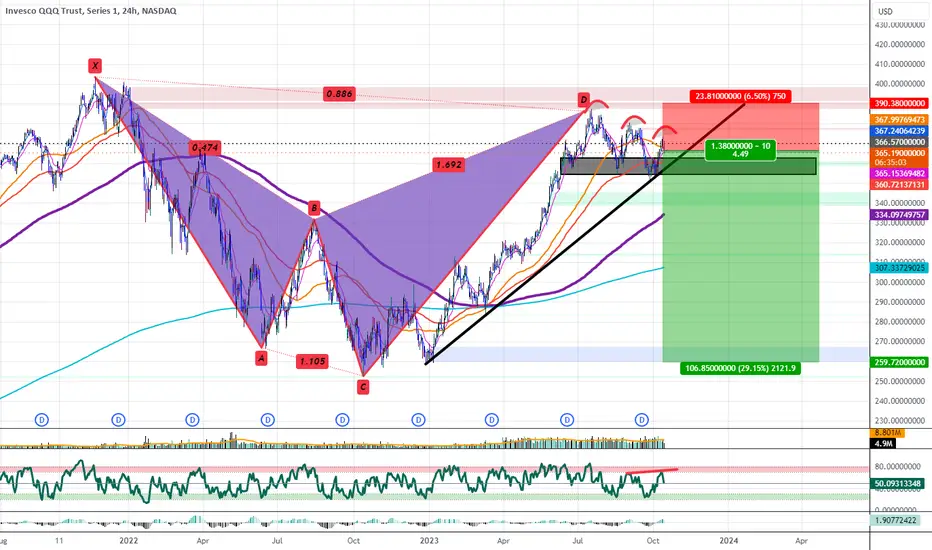
The "circles" in the NASDAQ context may be interpreted as periods when stock valuations are likely to be overextended. Investors, driven by excessive optimism, may push stock prices to unsustainable levels relative to underlying company fundamentals. These overvaluation periods can be attributed to various factors, including irrational market enthusiasm, speculative bubbles, or favorable macroeconomic conditions.
To identify these periods, a graphical analysis of NASDAQ price movements, highlighting significant price spikes or speculative bubbles, can be valuable. The goal is to identify moments when price trends significantly deviate from the overall trajectory.
3. Hidden Bullish RSI Divergence in Green:
Hidden bullish RSI divergence in green on the chart can suggest potential improvement in the underlying market strength, even when prices continue to decline or remain stagnant. This situation could imply a possible trend reversal to the upside.
4. Bearish RSI Divergence in Red:
Bearish RSI divergence in red on the chart may indicate potential weakness in the upward trend, even if prices continue to rise. This can signal a potential trend reversal to the downside.
5. Conclusion:
In summary, the NASDAQ, as a major stock index, experiences significant fluctuations. "Circles" may indicate overvaluation periods, while hidden bullish RSI divergence in green and bearish RSI divergence in red can signal potential opportunities for trend reversal. It is essential for investors to closely monitor these indicators and incorporate them into their decision-making processes.
However, it is important to note that stock market investments come with inherent risks, and no technical analysis can guarantee success. It is highly recommended that investors consult with qualified financial advisors before making investment decisions.
This analysis is provided for informational purposes only and does not constitute financial advice. Past performance is not indicative of future results, and stock market investments carry risks.
Nasdaq100

NASDAQ NEXT PLANTaking a quick look at the IG Client Sentiment, Retail Traders have shifted to a more bullish stance with 51% of retail traders now holding long positions. Given the Contrarian View to Crowd Sentiment Adopted Here at DailyFX, is this a sign that the SPX may continue to fall?
Zigzag For Wave Four!!! Or Turning MarketGreetings, dear friends. I hope you are having a productive week.
I am happy to assist you in ensuring that all previous analyses are attached to each corresponding analysis. This will provide a comprehensive overview and help you make well-informed decisions. Please do not hesitate to let me know if there is anything else I can do to assist you further.
I want to share my market analysis ideas based on the Elliott Wave Principle with you.
I am a fan of this principle and follow all the rules and guidelines for analyzing the market.
However, please note that my ideas are based on my personal experience and may change over time.
If there is an error in my analysis, I am open to re-analyzing it from the beginning and learning from my mistakes.
It's important to understand that making an error in analysis is not a fault, but evading responsibility is.
No one can analyze financial markets with 100% accuracy, but it's remarkable how close we can get.
We analyze from multiple perspectives to consider all possibilities.
Let's mention a few opinions and ideas!
Based on mathematics.
I am still practicing to understand the Elliott Wave Principle better and hope to provide an even better analysis in the future.
Thank you for your continued support, and I look forward to our mutual success.
Best regards,
Mr. Nobody
Keep trying and never give up.
Good luck!

NASDAQ Elliott Wave Analysis for Thursday 25/10/2023We got our confirmation that wave (4) in the higher time frame is not finished yet. Now we are looking at three bearish scenarios in the higher time frame.

US 100 INDEX. THREE WORDS THAT YOU SHOULD KNOW - LET'S GO DIVINGThere are looming risks that could "break" the US economy and end its current growth cycle.
Third-quarter GDP estimates are tracking above 5% and the US economy has added more than 2 million jobs year-to-date.
But there are three looming risks that could "break" the stock market and economy and end its current growth cycle, according to a Tuesday note from Ned Davis Research. These are the three risks to consider.
1. A resurgence in inflation
Inflation has made progress in trending towards the Federal Reserve's long-term 2% target after CPI peaked at about 9% last June, but any resurgence in rising prices would threaten the trajectory of the Fed's current tightening cycle.
2. The 10-year Treasury yield is around 5.00%
The 10-year US Treasury yield has surged so far this year, hitting a 16-year high of 5.02% on Monday. A further increase in this key benchmark rate would spell trouble for the broader economy, specifically if the yield breaks above the 5.25% level.
The 5.00 - 5.50% yield range TVC:TNX was an important double-top in 2006/2007, and also represented the peak policy rate of that tightening cycle.
So perhaps we wouldn't take a break of that level lightly.
Higher interest rates increase borrowing rates for consumers and businesses and often curtail demand, leading to slower economic growth, if not a contraction in growth. The 10-year US Treasury yield was at 4.86% on Tuesday.
3. Credit conditions deteriorating
So far this year, the bond market has been more concerned about interest rate risks than credit risks.
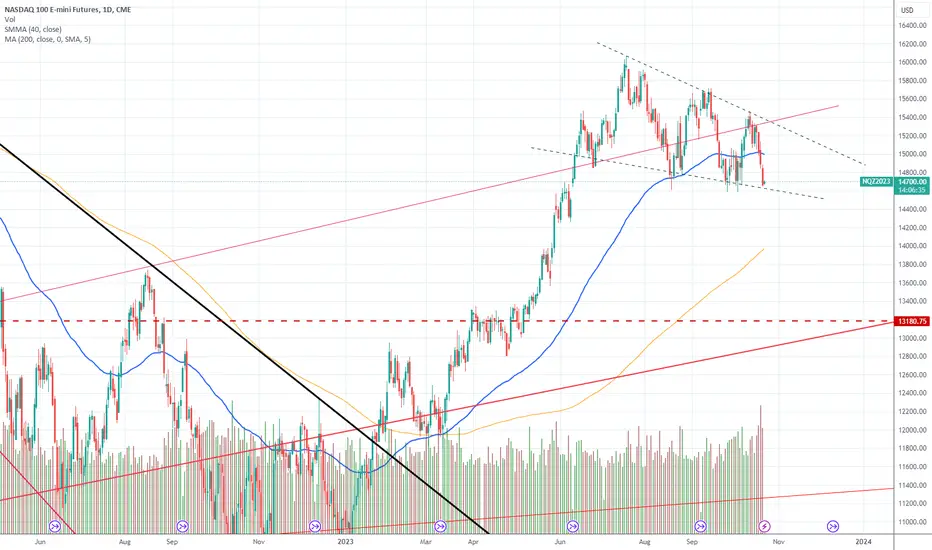
Technical graph below for US 100 Index NASDAQ:NDX says that main 125-Day SMA support has been broken as well as major upside trend, and technical figure known as "Head and Shoulders" is in progress right now.

NASDAQ Elliott Wave Analysis for Wednesday 24/10/2023We got our confirmation that wave (4) in the higher time frame is not finished yet. Now we are looking at three bearish scenarios in the higher time frame. In the lower time frame, we might first see some more upside before turning down.

NASDAQ Elliott Wave Analysis for Tuesday 23/10/2023We got our confirmation that wave (4) in the higher time frame is not finished yet. Now we are looking at three bearish scenarios.

$NQ! Close to support. Now what ?I closed my short position on Friday.
There is a little more room for downside, but we are basically on support.
I will follow a wait and see apporach today and tomorrow.
Top of the wedge will be the target if some market strength returns.
If we break support to the downside, a failed retest of the breakout line will be a good place to short. I am cautious in the medium term and will remain nimble.
Geo political instability and rising US treasury yields not doing markets any favours.
We also need to keep an eye on oil prices.
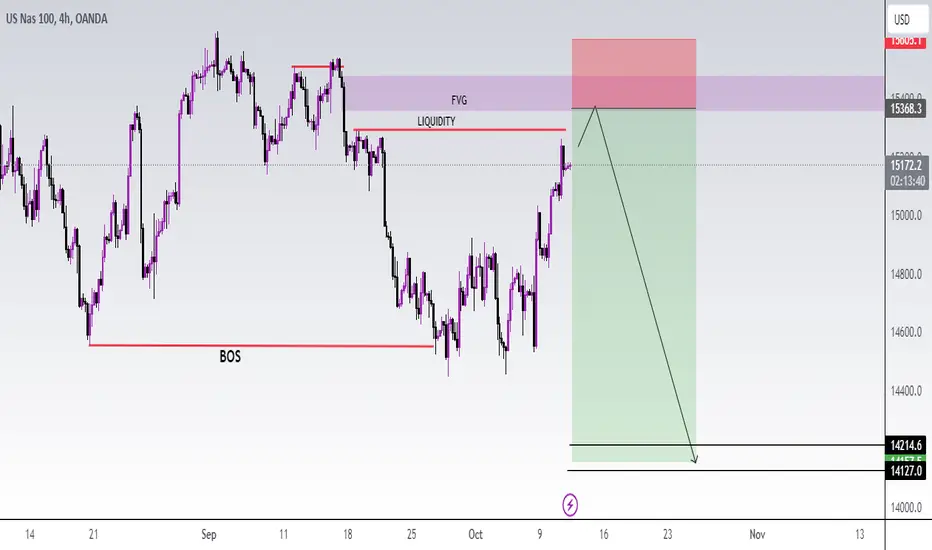
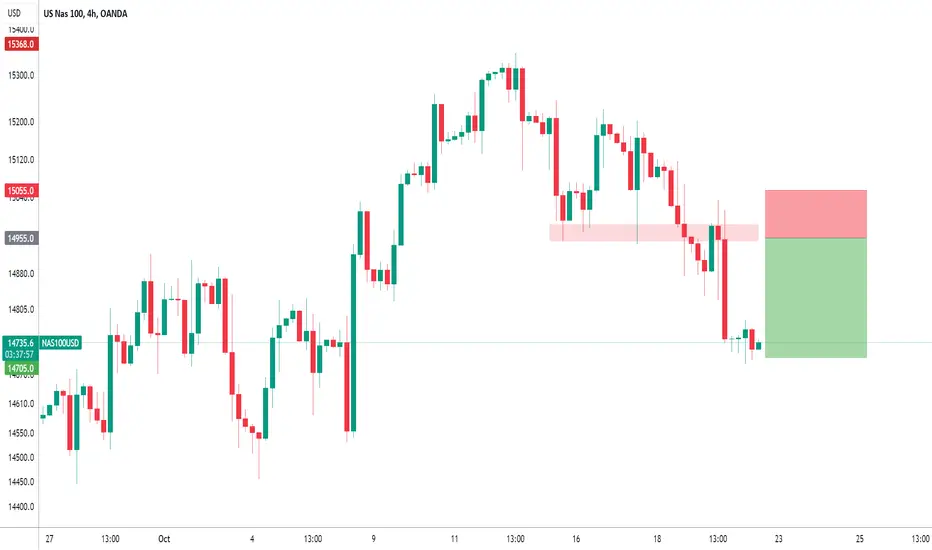
NASDAQ to see a temporary move higher?US100 - Intraday
Levels close to the 61.8% pullback level of 15365 found sellers.
There is no clear indication that the downward move is coming to an end.
A Fibonacci confluence area is located at 14546.
Further downside is expected although we prefer to set shorts at our bespoke resistance levels at 14955, resulting in improved risk/reward.
The medium-term bias is neutral.
We look to Sell at 14955 (stop at 15055)
Our profit targets will be 14705 and 14655
Resistance: 14955 / 14995 / 15348
Support: 14636 / 14546 / 14445
Risk Disclaimer
The trade ideas beyond this page are for informational purposes only and do not constitute investment advice or a solicitation to trade. This information is provided by Signal Centre, a third-party unaffiliated with OANDA, and is intended for general circulation only. OANDA does not guarantee the accuracy of this information and assumes no responsibilities for the information provided by the third party. The information does not take into account the specific investment objectives, financial situation, or particular needs of any particular person. You should take into account your specific investment objectives, financial situation, and particular needs before making a commitment to trade, including seeking advice from an independent financial adviser regarding the suitability of the investment, under a separate engagement, as you deem fit.
You accept that you assume all risks in independently viewing the contents and selecting a chosen strategy.
Where the research is distributed in Singapore to a person who is not an Accredited Investor, Expert Investor or an Institutional Investor, Oanda Asia Pacific Pte Ltd (“OAP“) accepts legal responsibility for the contents of the report to such persons only to the extent required by law. Singapore customers should contact OAP at 6579 8289 for matters arising from, or in connection with, the information/research distributed.
NASDAQ Elliott Wave Analysis for Friday 20/10/2023 (+ Higher TF)We believe that wave (4) in the higher time frame is not finished yet. There might be more upside but in a corrective way to finish wave X. Once wave X is finished, downside will follow as a wave Y.

#NASDAQ last chance --------------NASDAQ/NDX/USTECH100-------------
Amidst tensions there is one final hope indexes can turn around and continue their route to the upside instead of biting the dust. Now or never I would say. If current support levels don't hold price, nothing will and we will see more downside movement. Based on that I closed my hedge position and if it proves to be true that price cannot fall beyond these levels I would consider to add to long position.
This is not a financial advice, do your own research and analysis.
NASDAQ UPDATES
Done cooking the lows, perfectly align trend.
Now im expecting higher moves only if price reach that zone/line.
Higher expectation trades is not my goal but my idea is.
Trade at your own risk
This is not a financial advice

NASDAQ Elliott Wave Analysis for Thursday 19/10/2023We believe that wave (4) in the higher time frame is not finished yet. There might be more upside but in a corrective way to finish wave X. Once wave X is finished, downside will follow as a wave Y.

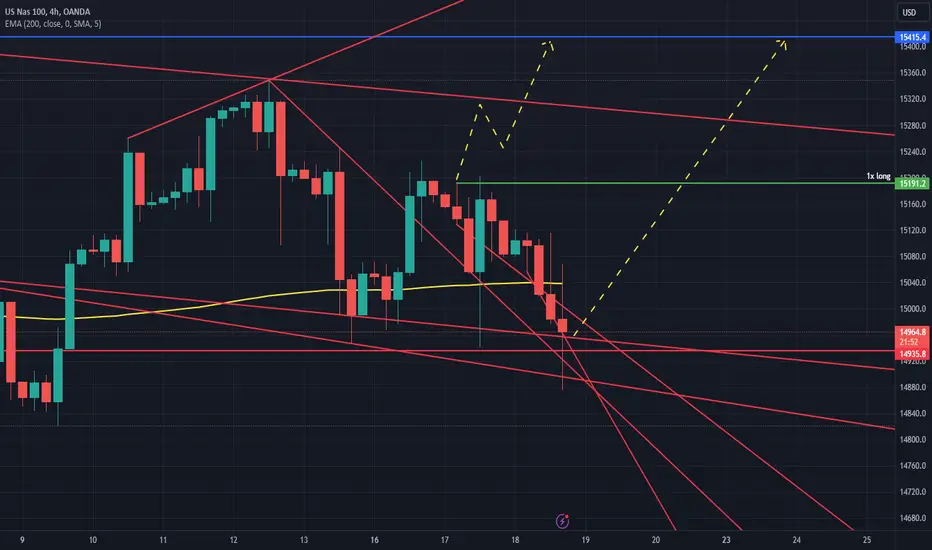
#NASDAQ to the upside------------NASDAQ/NQ/USTECH100-----------
I just went long on Nasdaq index and looking for further upside movement. From fundamental point of view I can say investors expect no more rate hike this year or in the near future. War news outside the US does not really affects this market. From technicals I can see a higher chance to go upside rather than downside at the moment. Weekly level can be the first target here (blue line).
This is not a financial advice, do your own research and analysis!

sp 500 my entry pointsmy entry points in sp 500 waiting for confirmations just trade with low risk beacuse this entre with high risk

NAS100 Technical analysis and Trade Idea US100In this video, we conduct an in-depth analysis of the NAS100. Taking a close look at both the weekly and daily timeframes, we can see the emergence of a prominent topping chart pattern characterized by a sequence of lower highs and lower lows, prominently visible on the US100 daily chart. In this video, we delve into various facets of technical analysis, including the prevailing trend, price action, and market structure. We also explore a potential trading opportunity. As always, it's crucial to emphasize that the content presented is solely for educational purposes, and it should not be construed as financial advice.

NASDAQ Elliott Wave Analysis for Wednesday 18/10/2023The impulsive structure up starts to seem unlikely. Overall, we believe there will be more upside but in a corrective way. This suggests that wave (4) in the higher time frame is not finished yet.

#NASDAQ uncertainty-----------NASDAQ/NQ HEDGE-----------
I had to hedge my previous position as chart bacame a bit nasty. It needs to settle down.
We will see.
This is not a financial advice, do your own research and analysis.

NASDAQ Elliott Wave Analysis for Tuesday 17/10/2023The impulsive structure up starts to seem unlikely. Overall, we believe there will be more upside but in a corrective way. This suggests that wave (4) in the higher time frame is not finished yet.

NVDA Can Fall NVDA Can Fall:
NVIDIA hit the 161.8 Fibonacci extension and took a little correction. It has been consolidating for some time but also forming a diamond pattern. Although this pattern is not one of the strongest, if it plays out, the market can fall below the FCP zone. Or even the previous high level with a 200sma (daily time frame) confluence and trend line.
This can have a knock-on effect on NASDAQ 100 (US100).
Something to watch out for.
If you found this post useful or information please support this analysis by liking and sharing. 👍✔ Also us for more.

NASDAQ Elliott Wave Analysis for Monday 16/10/2023 (+ Higher TF)In the higher timeframe, we have completed a WXY correction and this can be the end of wave (4). However, in the lower time frame, we are missing one more swing up to identify an impulse. If we do not get the additional swing up, we will probably see more corrective price action as a wave (4) and take out the low.

QQQ: 3 Falling Peaks at Bearish Shark PCZThe QQQ has been trading at the PCZ of this Bearish Shark for quite a while now and it has recently come back to make a 3rd Consecutive Lower High with Hidden Bearish Divergence on the RSI and looks to be ready to confirm it as a 3 Falling Peaks Pattern that I think would result in a major move down towards the 800 EMA or even lower down to the pre-2022 levels.
Why it might make sense to craft a tail hedge now! Say you’re bearish but find yourself confused by the market. You want to partake in the action if things go south, but not 100% certain, what could you do?
First, you could build some conviction by identifying potential reasons why you think the market could dip lower… Then, devise a ‘tail hedge’ to profit if things indeed go south.
Let’s break down these two steps this week.
In our past two articles, we've highlighted a couple of reasons why we lean bearish. You can find them here: S&P500 Vulnerabilities: from Money Supply to Sectoral Imbalanc & Why we’re watching the Bond/Equity Volatility . But as each week unfolds with more drama, let's revisit the market.
The first idea we want to bring up is the rates-equity dislocation.
On the equities front, we observe the following:
The conventional wisdom has long held that low rates are good for stocks. However, with stocks rising while the Fed hikes rates, has this relationship been disrupted? From 2020 to the end of 2021, we clearly observed this classic dynamic. However, from September 2022 onwards, as stocks continued their ascent despite the Fed's rate hikes, a distinct shift became evident. Could this Equity-Rate dislocation be a by-product of the AI hype? Consider Nvidia’s stock price, which seemingly pinpointed the Nasdaq's low point.
Question is… Is the AI hype a strong enough factor to permanently alter this relationship?
In terms of overarching themes, there are generally defined up and down trends. AI ETFs seem to provide a rough gauge of the sector's peaks and troughs. With the previous peak in 2021 happening in the ETFs right before Nvdia peaks, again now we see a similar trend with the ETFs seemingly having peaked while Nvida trades slightly higher still, and we wonder for how long more?
If this signals a pivot for Nvidia, then the Nasdaq, currently buoyed by AI hype, could falter.
Now, turning to rates: What could drive rates higher? A string of robust US economic data regarding jobs and inflation has emerged. Recent figures for CPI, PPI, and NFP all exceeded consensus estimates, suggesting a robust US economy. Such data might embolden the Federal Reserve to maintain its tightening cycle.
One way to interpret robust economic figures is through an economic surprise index, such as the Citi Economic Surprise Index. This metric quantifies the differences between actual economic outcomes and projections. A positive number indicates that the economy is outperforming expectations.
When you overlay the Citi economic surprise index against the 13-week change in 10-year yields, a clear correlation emerges. When the economy outperforms predictions, yields tend to move in tandem.
This increase in yield represents a significant deviation from its nearly 3-decade trend. Broadly speaking, the Nasdaq 100 Index hasn't experienced such a pronounced change in yield trends since its inception.
On Volatility, Erik Norland from CME highlights an intriguing observation: the relationship between the yield curve slope and VIX when viewed from a 2-year average perspective. He suggests that equity volatility and the yield curve follow cyclical patterns, typified by specific periods:
1) Pre-Recession & Recession -Flat yield curve and high volatility
2) Early Recovery – Steep Yield Curve & High Volatility
3) Mid Expansion – Steep Yield Curve and Low Volatility
4) Late Expansion – Flat Yield Curve and Low Volatility
Plotted, the cycle looks like this for the 1990s period;
As well as the 2000s;
Given our current position in the Equity Volatility-Yield Curve cycle, we might be bracing for higher volatility ahead as we're likely situated near the cycle's bottom left quadrant.
If the trifecta of rising yields, waning AI hype, and a nascent high-volatility regime comes to fruition, then investing in tail hedges might be a savvy move.
One potential structure for a tail hedge could be the 1X2 ratio put spread. This strategy could offer protection against adverse market movements, with the flexibility to structure it so that initial costs could be negligible or even result in a net credit. Additionally, the put ratio is typically a long vega strategy, which could be beneficial in a high-volatility environment.
The 1X2 ratio put spread can be set up by taking 2 positions,
1) A short position on the Nasdaq 100 Index Futures with a strike price below the current level
2) A long position on 2 Nasdaq 100 Index Futures with a strike price further below the short option strike
At the current index level for the Nasdaq 100 Futures March 2024 contract of 15,520, we could take a short position on the March 2024 put option with a strike price of 14,800 at 304.25 points credit and 2 long positions on the March 2024 put option with a strike price of 13,800 at 122.5 points debit. The setup cost of the put ratio is 304.25 – (2 * 122.5) = 59.25 points, resulting in a net credit. The maximum loss occurs when the underlying asset settles at 13,800 by option expiry, leading to a potential maximum loss calculated as follows:
Long put options both expire worthless: -122.5 * 2 = -245 points
Short put option: 13,800 – 14,800 = -1000 + 304.25 = -695.75 points
Maximum loss = 940.75 points
Considering the potential for loss and the associated risks, several profit scenarios emerge. If, as we discussed, the yield trend shifts and the AI hype subsides, the Nasdaq could potentially plummet. If the Nasdaq falls beyond the 13,104 level by option expiry, the strategy could be profitable. Conversely, if the Nasdaq remains range-bound at its current level or rises by expiry, we could also benefit from the initial credit received. Each 0.25 index point is equivalent to $5.
The charts above were generated using CME’s Real-Time data available on TradingView. Inspirante Trading Solutions is subscribed to both TradingView Premium and CME Real-time Market Data which allows us to identify trading set-ups in real-time and express our market opinions. If you have futures in your trading portfolio, you can check out on CME Group data plans available that suit your trading needs tradingview.sweetlogin.com
Disclaimer:
The contents in this Idea are intended for information purpose only and do not constitute investment recommendation or advice. Nor are they used to promote any specific products or services. They serve as an integral part of a case study to demonstrate fundamental concepts in risk management under given market scenarios. A full version of the disclaimer is available in our profile description.
Reference:
www.yardeni.com
www.cmegroup.com
www.cmegroup.com
