NASDAQ Approaches Key Support: Bullish Momentum Likely to PersisThe NASDAQ is approaching its ascending trendline support, which could serve as a potential bounce point to sustain the bullish momentum and drive new highs. There are no significant bearish signals, suggesting that buying on dips remains a viable strategy for targeting further upside.
Nasdaqanalysis

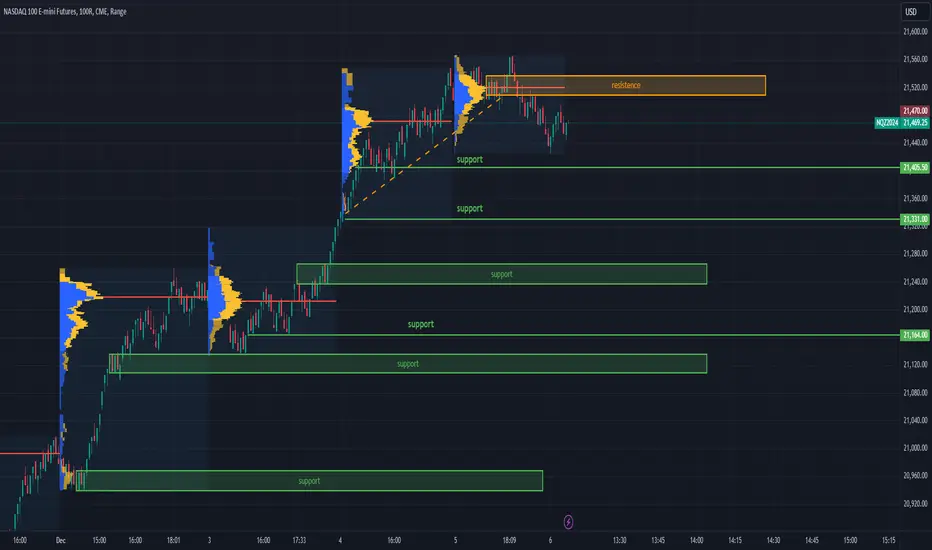
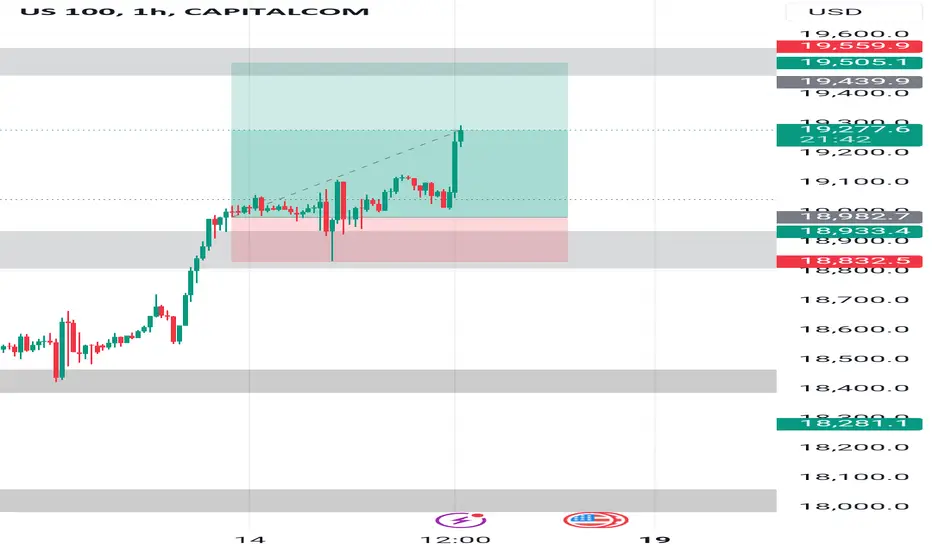
Intraday Levels for Nasdaq 100 Futures - 12/06/2024This analysis focuses on the Nasdaq 100 Futures, aiming to identify potential support and resistance levels where the price could experience intraday bounces or trend reversals, as well as zones where the price might potentially break higher or move lower.
Considerations
The range used in this analysis serves only as a reference for broader-level insights.
For intraday operations, it is advisable to utilize a lower timeframe to refine entry and exit points more accurately.
To confirm the validity of these levels, it is essential to evaluate real-time conditions as the price approaches these zones. Factors such as pressure, trading volume, and Order Flow will play a critical role in determining whether these supports hold or are likely to be broken.
Nasdaq analysis: 05-DEC-2024Good morning, everyone! Today's Nasdaq analysis is designed to educate and empower. Use these insights to refine your price action trading strategy.

Nasdaq Breakdown: 12-NOV-2024Good morning, trading community! Today's Nasdaq analysis is for you. Share your thoughts, ask questions, and let's grow.

Nasdaq Outlook: 07-NOV-2024Good morning, traders! Welcome to today's Nasdaq market analysis. Compare my price action insights with your own charts and enhance your trading skills.
#Nasdaq
#StockMarket
#Trading
#Investing
#DayTrading
#SwingTrading
#TechnicalAnalysis
#MarketAnalysis
#FinancialNews
#WallStreet
#NasdaqToday
#NasdaqAnalysis
#NasdaqTrading
#StockMarketNews
#MarketTrends
#InvestmentStrategies
#FinancialMarkets
#TradingTips
#NasdaqForecast
#MarketInsights
#Nasdaq100
#TechStocks
#GrowthStocks
#IndexFunds
#ETFs
#StockMarketAnalysis
#TradingStrategies
#RiskManagement
#InvestorEducation
#FinancialLiteracy
#EarningsSeason
#FederalReserve
#EconomicIndicators
#MarketVolatility
#GlobalMarkets


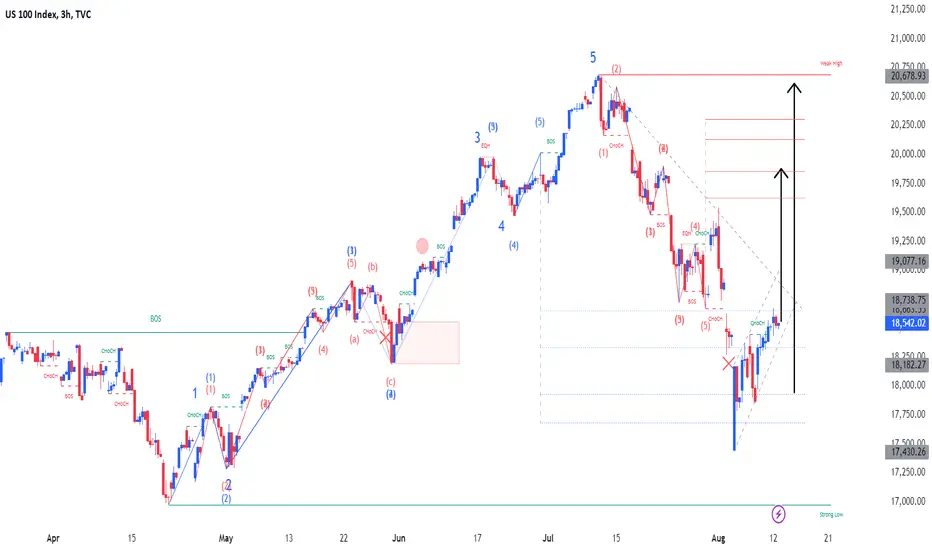
US100 Elliott Wave Forecast: Understanding the NASDAQ's Next MovUS100 analysis using Elliott Wave theory. This chart highlights the key trends and potential future movements in the NASDAQ index. Follow the wave patterns to gain insights into upcoming shifts in market momentum.

"Nasdaq could experience a significant drop in the coming days.""Dear everyone, NASDAQ may decline in the next few days. I'm currently in two trades."So let's see how things unfold."
As always, it's essential to apply proper money management and never trade without placing an appropriate stop-loss. Remember, trading is a game of probabilities, so your success should be measured over a series of trades, not just one.
Guys always read this quote.It will help you mentally."I just wait until there is money lying in the corner, and all I have to do is go over there and pick it up. I do nothing in the meantime. Even people who lose money in the market say, 'I just lost my money, now I have to do something to make it back.' No, you don't. You should sit there until you find something.” “Jim Rogers:
Thanks!

NASDAQ: Push to 22K or Drop to 19K? Key Levels and Profit Zones Evening Traders
NASDAQ is hanging on to the 20,256 level, but if we break lower, we could be looking at a slide down to the 20,000-19,200 range. On the bright side, there’s a ton of support that could push us up to 21-22K. If that happens, it’s a great spot to take some profit before we hit major resistance—or worse, a deep correction.
Let’s dive into the key levels to watch and where to take action before things get bumpy. Will NASDAQ keep climbing, or are we in for a pullback?
If this gave you some insights (or at least made you think twice about your next move), give it a like, drop your thoughts in the comments, and hit follow for more updates. Your support keeps me going
Happy trading
Mindbloome Trader

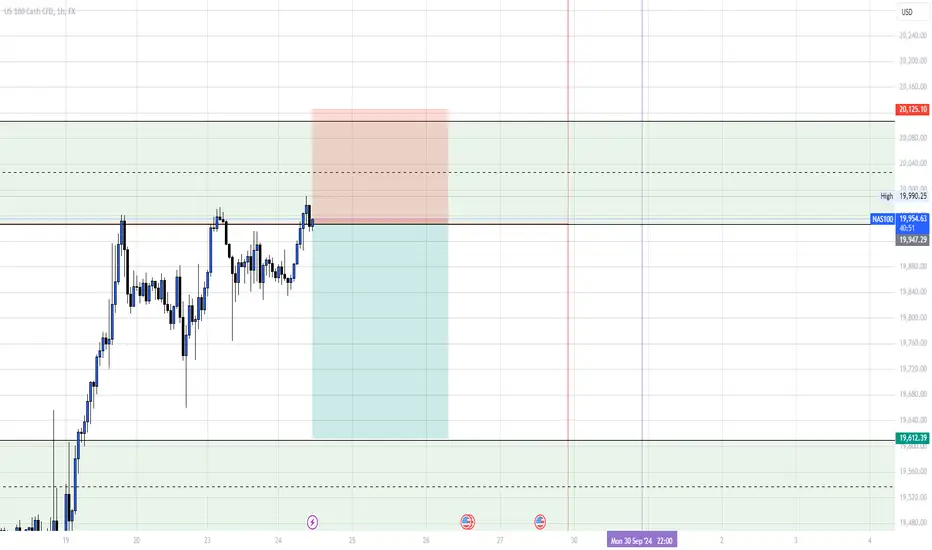
NASDAQ 100 Drops! Short Trade Confirmed, Eyeing First TargetThe NASDAQ 100 has confirmed a short trade with a strong bearish move below the entry at 20263.46. The price is progressing towards the first profit target (TP1), though it has not yet been reached.
Key Levels
Entry: 20263.46 – The short position was confirmed as the price broke below this level, signaling bearish momentum.
Stop-Loss (SL): 20378.68 – Placed above the recent resistance to protect against potential upside reversals.
Take Profit 1 (TP1): 20121.04 – The first target, not yet reached, but in close proximity as the downward trend continues.
Take Profit 2 (TP2): 19890.59 – The next target in case of continued bearish pressure.
Take Profit 3 (TP3): 19660.15 – A further downside target, aligning with the next support zone.
Take Profit 4 (TP4): 19517.73 – The ultimate profit target, marking a significant decline.
Trend Analysis
The price has broken below the Risological Dotted trendline, confirming strong bearish sentiment. The market is likely to move toward TP1 if the selling pressure continues. The downward momentum suggests further potential to reach deeper profit targets.
The NASDAQ 100 short trade is progressing well after confirmation, with TP1 at 20121.04 in sight. If the bearish trend holds, further downside targets are expected to be reached.
Nasdaq Update: Today’sInsights 15-OCT-2024Hey traders! Ready to dive into today's Nasdaq market analysis? Let's compare notes, share insights, and become better traders together.

US100 after CPIAfter 2:30 PM news, and a little fake descent, US100 is back on track for its uptrend.
Supposed to hit a higher high before friday night.

Nasdaq Ready to Fall==>-5%_-10%The Nasdaq Index started to rise with the help of the " Long Island " upward continuation pattern and made the New All-Time High(ATH) .
The Nasdaq Index is currently near the upper line of the Ascending Channel and has succeeded in breaking the Uptrend line .
Also, Regular Divergence (RD-) between Consecutive Peaks .
I expect the Nasdaq index to fall at least to the Support zone($71.41-$69.18) =🚨 -5% 🚨, and if the support area breaks, we should wait for this index to fall to the Lower line of the ascending channel = 🚨 -10% 🚨 .
Nasdaq Index Analyze (NDAQUSD), Daily frame⏰.
Do not forget to put Stop loss for your positions (For every position you want to open).
Please follow your strategy and updates; this is just my Idea, and I will gladly see your ideas in this post.
Please do not forget the ✅' like '✅ button 🙏😊 & Share it with your friends; thanks, and Trade safe.

SELL ON NASDAQAs you can notice on the chart, the price has reached a high LQ level in which you can sell in a safe position.
Set you EN, TP and SL ans on the chart!
Follow for more.
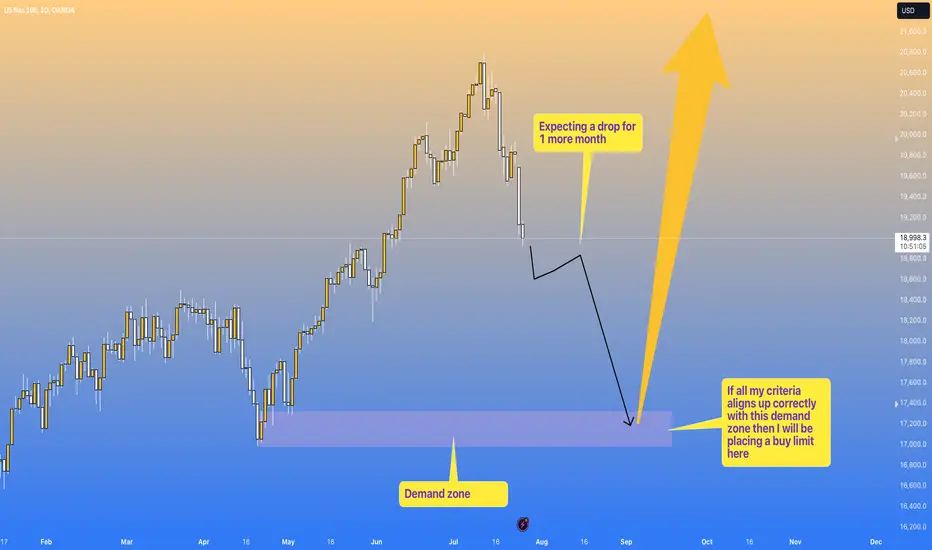
US Nas 100 another month drop?Hey traders
We have US Nas 100 here, nas is looking to sell down still for another month id say, so I will be looking to take a sell position on nas to take to the demand zone I have marked off on chart, I will update accordingly and will only be placing a buy limit if my trading criteria is met.
Would be great if you could leave a comment or liked and followed cheers.
This chart material is for educational purposes only / Demo account should be traded only.
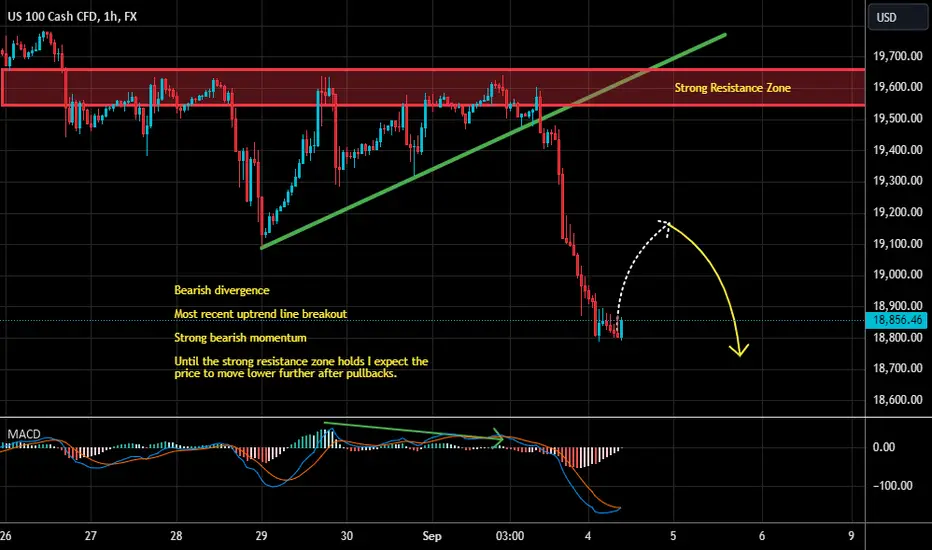
NASDAQ - Looking To Sell Pullbacks In The Short TermH1 - Bearish divergence
Most recent uptrend line breakout
Strong bearish momentum
Until the strong resistance zone holds I expect the price to move lower further after pullbacks.
Nasdaq - Here we finally go!TVC:NDQ is finally rejecting the resistance and creating the anticipated bearish correction.
Let me just put it that way: The correction was 100% anticipated and you can definitely then trade accordingly. Just a couple of weeks ago the Nasdaq retested a resistance which has been pushing price lower for 14 years - a correction was very likely. So far the Nasdaq is dropping significantly but I don't think that the current correction will actually be over soon...
Levels to watch: $16.000
Keep your long term vision,
Philip - BasicTrading

NASDAQ thoughts 28-Aug-2024Hello all, Kindly see my NASDAQ thoughts for today. These videos are aimed at making you compare charts with mine if you are a price action trader and use my thoughts to improve your skill. They are not meant as signals even if they seem like they are. I want you to learn and be great

Nasdaq thoughts 27-AUG-2024Hello all, Kindly see my NASDAQ thoughts for today. These videos are aimed at making you compare charts with mine if you are a price action trader and use my thoughts to improve your skill. They are not meant as signals even if they seem like they are. I want you to learn and be great

Nasdaq bullish run Nas continues the bullish run as per the previous idea I posted .
Reach out if you need nasdaq signals/ 1on 1 classes
NASDAQPair : NDQ Nasdaq
Description :
Completed " 12345 " Impulsive Waves and " ABC " Corrective Waves
Break of Structure
RSI - Divergence
Fibonacci Level - 78.60%
Demand Zone
NASDAQPair : NDQ Nasdaq
Description :
Completed " 12345 " Impulsive Waves and " ABC " Corrective Waves
Break of Structure
RSI - Divergence
Fibonacci Level - 78.60%
Demand Zone

NVAX listed on Nasdaq. I bought these shares at the very bottomNVAX listed on Nasdaq. I bought these shares at the very bottom. I made a take profit at the price of 16. Now we have a correction and I expect a drop to the price of 5.05 and there I will buy shares of this company
