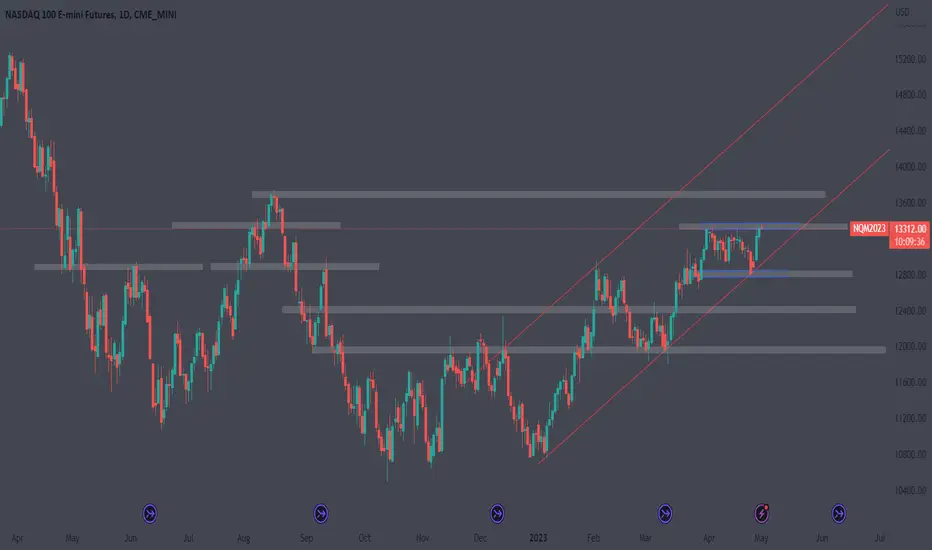
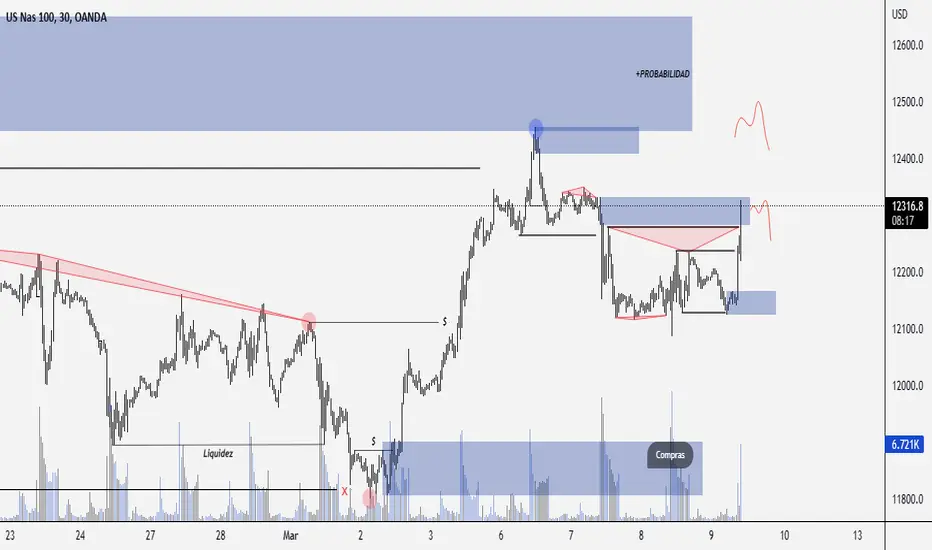
US100 Nasdaq Next Possible MovePair : US100 - Nasdaq
Description :
Bearish Channel in Long Time Frame as an Corrective Pattern with the Breakout of the Upper Trend Line
Divergence - RSI
Break of Structure
Completed " 12345 " Impulsive Wave
Fibonacci Level ( 50.00% / 61.80% )
Rising Wedge
Nasdaqidea

$NQ1! - Busy week ahead! CME_MINI:NQ1! - Busy week ahead!
We've got a busy calendar ahead of us and remember it's first day of the month - May a Lot of US Data!
1. ISM
2. JOLTS
3. ADP
4. FOMC
5. NFP
Now that's a busy week and I know for some, they will be stepping back and not trading during a hectic week ahead, but I do feel there will be plenty of opportunities. Now, banking sector is at the key spot light ahead of this week mentions of First Republic Bank will be acquired by JPMorgan after rescue efforts fail. It's not first time this year, we've heard a bank go under, and unfortunately that's part of the cycle as rates head higher, a lot of sectors get hurt, look at real estate and this is what I mentioned months prior - I well recommend researching more in depth. Keep in mind FED want a 2% target for inflation...Expectation is for the FOMC to lift rates by 25bps at its May meeting, now the real question is will they pause after this hike or carry on, whilst we got credit tightening...
Now technically looking at NQ
Highs: 13391
Lows: 12787
At the moment we've got Kangaroo action until a break to either side - If we are to break the highs, I expect next area of interest to be 13660 areas. However, we are to break the lows, I expect 12481 areas.
NQ has held relatively well within the conditions we are in, interesting times ahead.
Have a great week ahead,
Trade Journal
NQ1! NAS100 NASDAQ 2023 MAY 08NQ scenario 4, rotational trade yielded 470pts from 3 trades.
Test and Reject/Accept setups consistently offers low risk trades.
NQ was in rotation for a month now.
Friday saw a low volume mark up, and could be trapping longs.
Previous scenario planning remains.
Given the rotation has progressed thus far, inexperienced traders should just wait.
CAPS FOR EMPHASIS-MY TENDENCY TO TRADE SCENARIO4 WILL NOW BE DIMINISHED.
Possible scenarios:
1) Market stuck in a 250pt range, wait till supply/demand is resolved
Then:
2) Breakout of upper boundary to test 13740 = long at support of upper boundary of range
3) Breakdown of lower boundary of range = Short on rejection of 12950
4) The longer the rotation, the riskier will be rotational trade.
Long on support between 12950-13040 | Short on rejection between 13350-13212
Volume Analysis:
Friday's mark up on average volume, with close away from the high, is weakness on the bar.
Price reaction levels:
Short on Test and Reject | Long on Test and Accept
14361 13740 13350
13316 12950 10710 - 11068
Remember to Like and Follow if you find this useful.
Have a profitable trading week ahead.
*For educational purpose only.

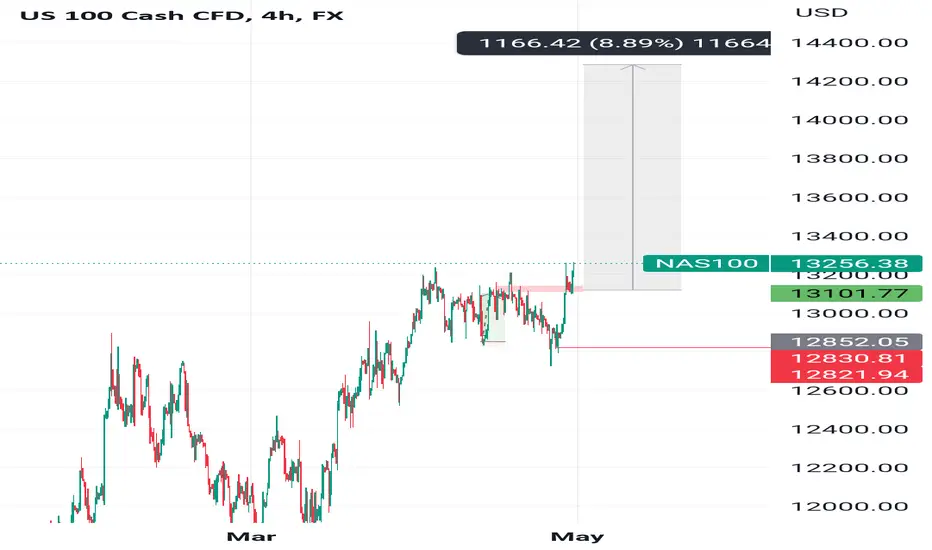
Price projection on Nasdaq 100 nas100 us100Nas prolly hitting the 14k levels sooner, similar price on top 500
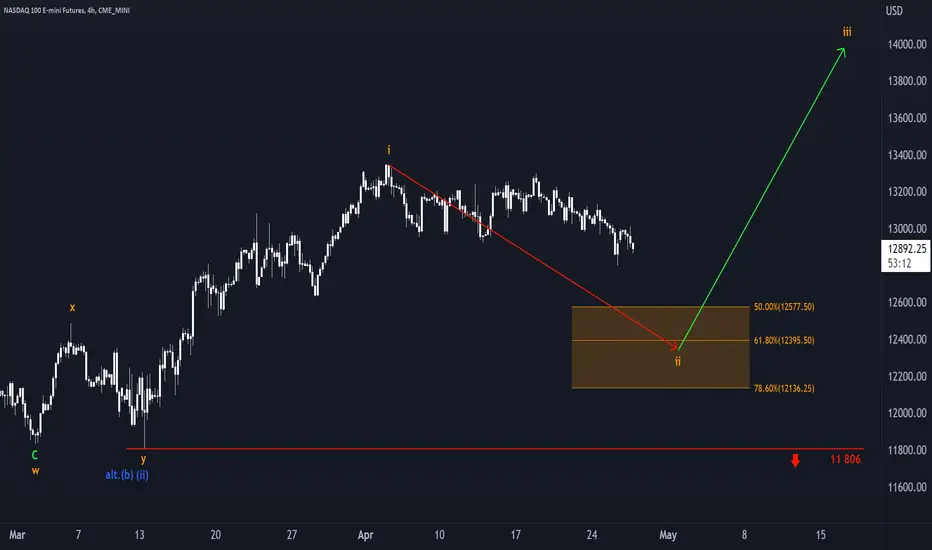
Nasdaq: Tough Sledding 🐌🛷Nasdaq is shuffling on, but the going is tough – to coin a phrase. However, we expect the bears to take more action soon! They should drag the index into the orange zone between 12 577 and 12 136 points, where wave ii in orange should end. Afterward, the bulls should take the helm again, inciting Nasdaq to develop wave iii in orange, which should reach about 14 000 points – providing that the support line at 11 806 points remains intact.
Nasdaq descending triangle setuphello traders Nasdaq is making a descending triangle we was in a diamond shape on a 4hr we have a break on it lets wait the break of our pattern you can wait a retest to even conform but sometimes no retest

Corbus Pharmaceuticals Holdings, Inc.Corbus Pharmaceuticals Holdings, Inc(#CRBP) in good demand area
Orange Zone is a place to enter but Considering SL:6.02
Long Term Target:71 means 800%
MidTerm Target:20 Measn 150%

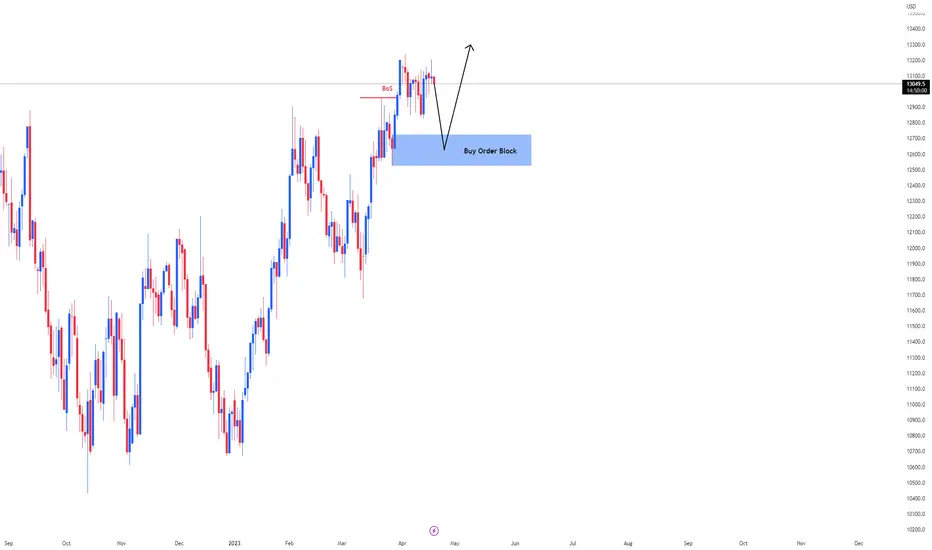
NASDAQ Today D1Here is my view for NASDAQ on D1. The price could go bullish, you can put a pending order on the Order block or find an entry on LTF within OB Zone. Trade Safe!
NAS100 top-down analysisHello traders, this is a complete multiple timeframe analysis of this pair. We see could find significant trading opportunities as per analysis upon price action confirmation we may take this trade. Smash the like button if you find value in this analysis and drop a comment if you have any questions or let me know which pair to cover in my next analysis.

nas100 nasdaq indices nasusd100hello traders nas is setting froming it self for a possible upside can we catch of course it is just being patient to get into our area as far as you know what to look for no fomo no stress wait for session as conflence an execute manage your risk it is a number game good luck with your trading

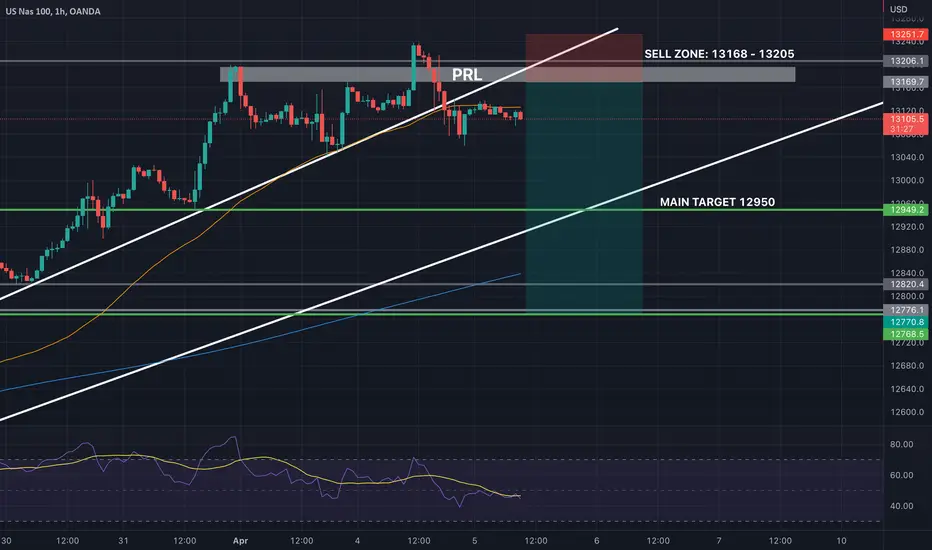
NICE AND SIMPLEComment below if you are seeing what I'm seeing.
We've been waiting for shorts for multiple reasons, finally we are getting some lovely rejection at resistance 13205 as well as a bearish pattern forming and a break in trend. I am expecting a sell off in our sell zone today to finally break this consolidation zone and take us to 12950.
LONG NASDAQ 100 | Bullish on 1H TFNASDAQ 100 Bullish Trend Continuation
with Bullish Flag on 1H TF
Long at Break of Last HH
Placing Buy Stop Order

nas100 ascending triangle breakout setuphello traders new week new opportunity nas 100 setup a nice ascending triangle dont miss out good setup just comment down below let me know what you think also follow for more

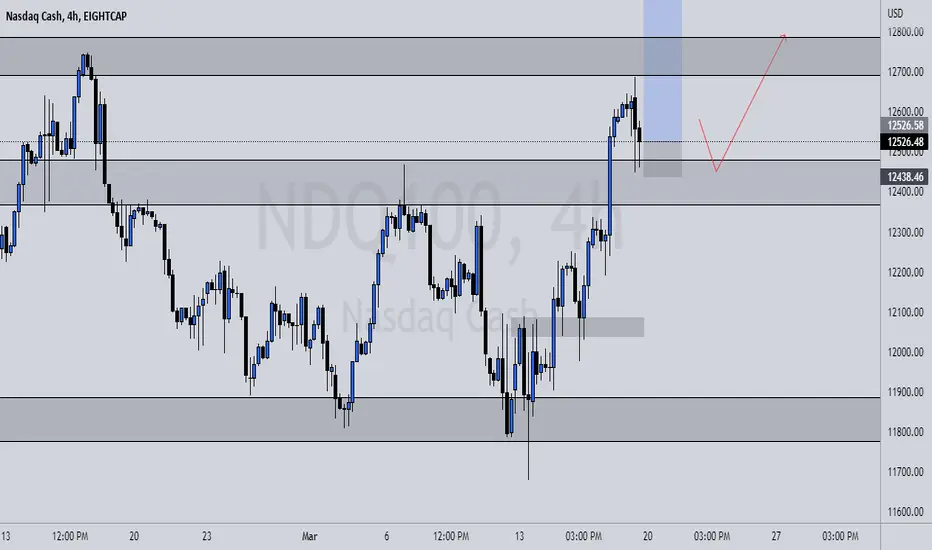
NASDAQ WEEKLY ANALYSISEIGHTCAP:NDQ100
we are seeing a BULLISH TREND forming on the EIGHTCAP:NDQ100
we can already see that price has already broken resistance and also retesting that area with signs of rejections on that area. So we can possibly anticipate that price could countinue bullish after this
NQ1! NAS100 NASDAQ 2023 Mar 20 WEEK
NQ1! NAS100 NASDAQ 2023 Mar 20 WEEK
The daily Ultra Lo Volume down bar and support at 11930
provided good meat for week of 13 March.
Market finally broke through 12418 and is near supply zone
12810-12950. Let's see how price reacts to this level.
Possible scenarios:
1) Possible formation of rotation 12950-11930 =
trade at boundary of zone
2) Long on retracement
3) False break of 12950 for short
Volume Analysis:
Weekly = High vol up bar close off high = minor weakness
Daily: Ave volume S>D bar into an area of previous resistance
Price reaction levels:
Short on Test and Reject | Long on Test and Accept
14361 13587 12950
12950 11930
Remember to Like and Follow if you find this useful.
Have a profitable trading week ahead.

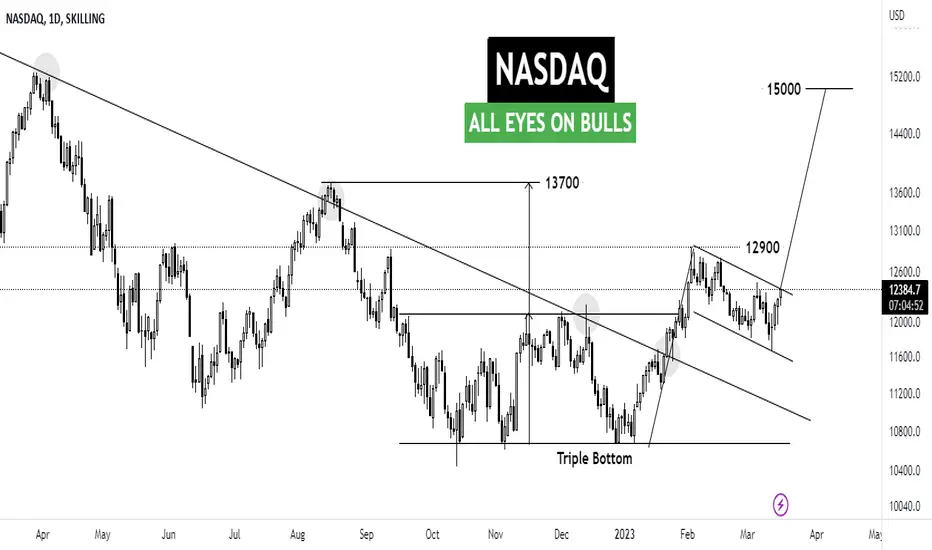
NASDAQ | ALL EYES ON BULLSDespite negativity on banking system default. NASDAQ is on the move with bulls printing new high everyday.
Technically speaking, US100 is trading in bullish flag with the breakout target comes at 15000. But we will move step by step. The upcoming resistance comes at 12900 which is horizontal level.
Previously, NASDAQ printed triple bottom around 10650 where the neckline comes at 12100. The target of triple bottom comes at 13700.
All signs shows strong bullish momentum. Any dip will be buying opportunity with appropiate stoploss.
Let us know what do you think of the idea?
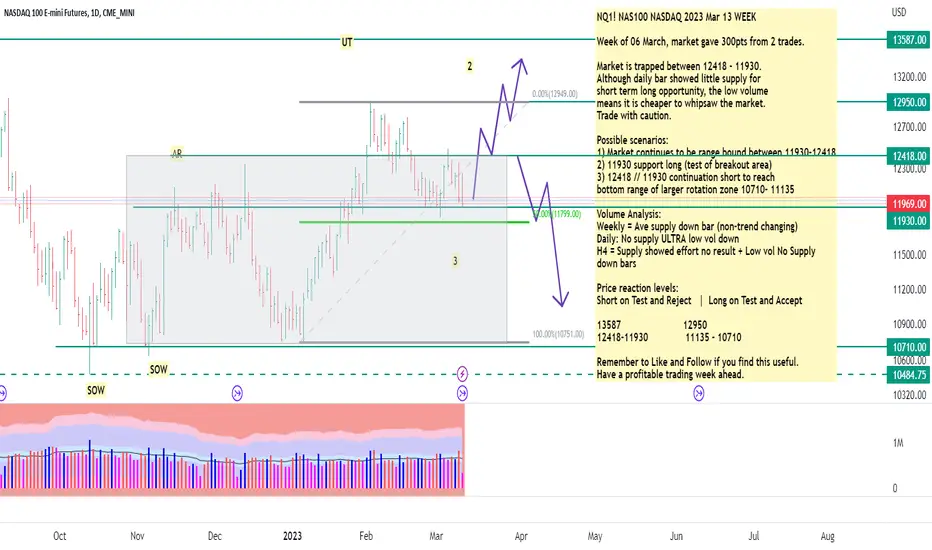
NQ1! NAS100 NASDAQ 2023 Mar 13 WEEK
NQ1! NAS100 NASDAQ 2023 Mar 13 WEEK
Week of 06 March, market gave 300pts from 2 trades.
Market is trapped between 12418 - 11930.
Although daily bar showed little supply for
short term long opportunity, the low volume
means it is cheaper to whipsaw the market.
Trade with caution.
Possible scenarios:
1) Market continues to be range bound between 11930-12418
2) 11930 support long (test of breakout area)
3) 12418 // 11930 continuation short to reach
bottom range of larger rotation zone 10710- 11135
Volume Analysis:
Weekly = Ave supply down bar (non-trend changing)
Daily: No supply ULTRA low vol down
H4 = Supply showed effort no result + Low vol No Supply
down bars
Price reaction levels:
Short on Test and Reject | Long on Test and Accept
13587 12950
12418-11930 11135 - 10710
Remember to Like and Follow if you find this useful.
Have a profitable trading week ahead.
What i see on NasdaqThe price after accumulating cleared supply zones. And he finds himself distributing to the highs again. Where the price confirm shorts we take them.
The price is in an expensive range.
NASDAQ Next Move Pair : US100 - NASDAQ
Description :
Bearish Channel as a Corrective Pattern in Long Time and A Breakout of the Upper Trend Line
Divergence
Break of Structure
Rejecting from the Demand Zone and Retracement Completed
Completed " 12345 " Impulsive Wave and Making its " A - wxyxz " Corrective Wave

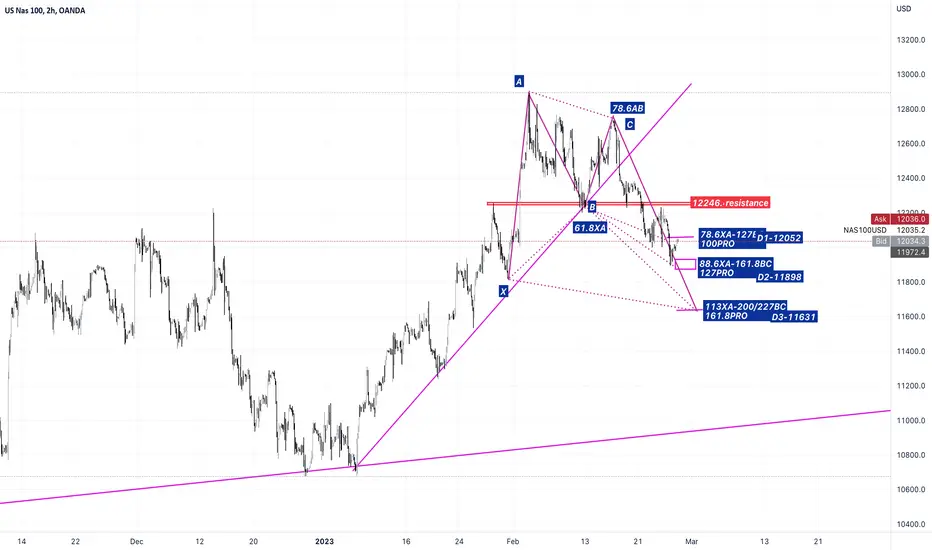
NAS 100After breaking the trend line with a higher slope and breaking the resistance of the B pattern in the range of 12246, it touched two targets in the range of 12052 and 11898. Currently, to reach the third target of D3-11631, the resistance of D2-11898 must be broken.
In general, the trend can decrease to the range of the trend line with a low slope. But the conclusion after the above 3 targets is the best option ahead.
NQ1! NAS100 NASDAQ 2023 FEB 27 WEEKNQ1! NAS100 NASDAQ 2023 FEB 27 WEEK
Did you take the Scenario2 short from 12271?
After the breakout, market is back to test previous rotation
zone. 11706 will be critical to sustain the breakout.
Possible scenarios:
1) 11706 support holds + higher lows = long
2) 11706 becomes rejection = short on test and reject
Volume Analysis:
Weekly = Lower vol down bar close off low - minor weakness
Daily: Ave vol down bar close off low = minor weakness
H4 = UHV narrow spread down bar + next bar higher
= demand coming in
Price reaction levels:
Short on Test and Reject | Long on Test and Accept
13587 12987 12137
11706 10710
Remember to Like and Follow if you find this useful.
Have a profitable trading week ahead.

Nasd analysis on short term we have a support on hour chart here .
so we can enter here and put our stop near as shown in graph .
NAS100 top-down analysisHello traders, this is a complete multiple timeframe analysis of this pair. We see could find significant trading opportunities as per analysis upon price action confirmation we may take this trade. Smash the like button if you find value in this analysis and drop a comment if you have any questions or let me know which pair to cover in my next analysis.
