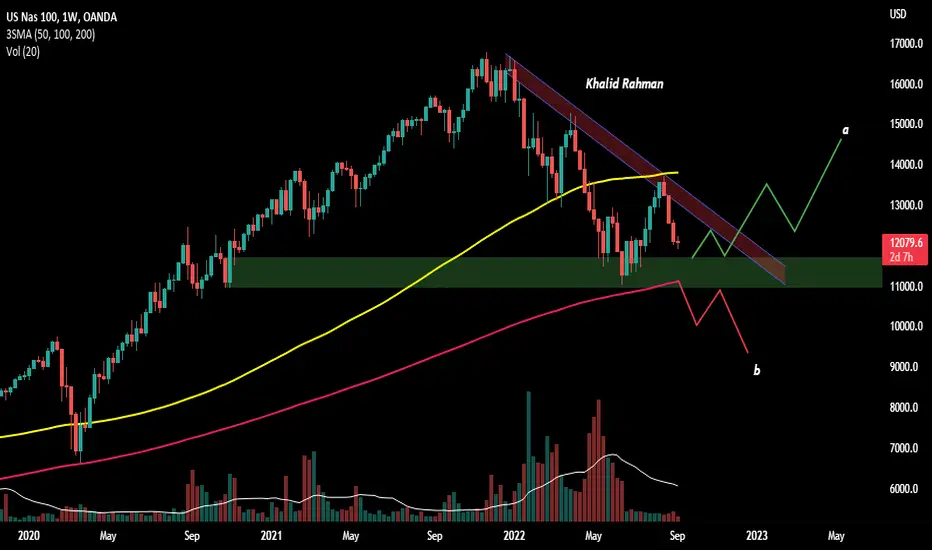
#NASDAQ- US100 Expecting This Massive Bearish Move!NASDAQ- We are yet to have another big bullish momentum, however, price needs to drop a bit in order for it to bounce for the last move. Longer term view is bearish as the fear of recession in US rising every day. Upcoming months will affect how Nas100 perform for current year.
Good luck and Stay Safe!!!
Nasdaqidea

NAS100 top-down analysisHello traders, this is a complete multiple timeframe analysis of this pair. We see could find significant trading opportunities as per analysis upon price action confirmation we may take this trade. Smash the like button if you find value in this analysis and drop a comment if you have any questions or let me know which pair to cover in my next analysis.

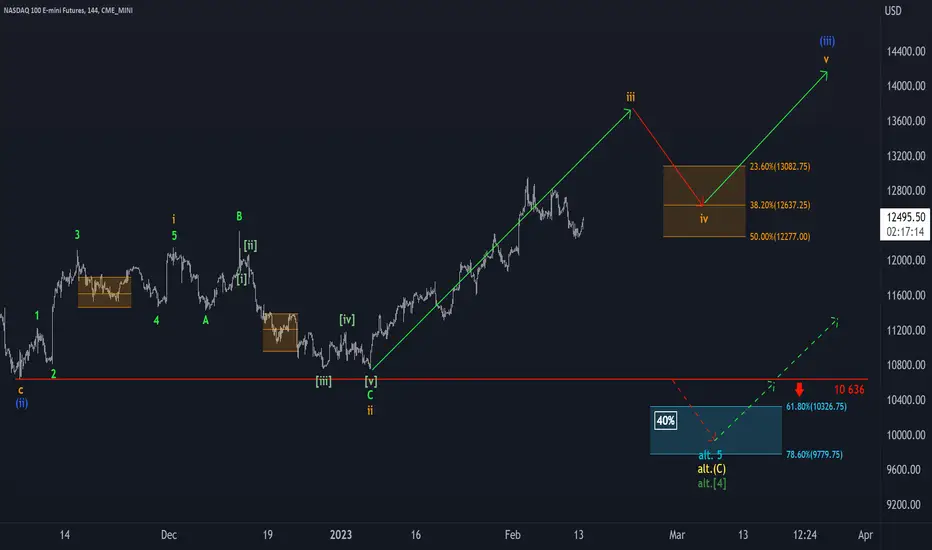
Nasdaq: Nas-duck? 🦆Like a (Nas-)duck before the thunderstorm, Nasdaq is facing the ascent we expect in the course of wave iii in orange. The index has been struggling to proceed with the upwards movement for some time – however, appropriate impulses are visible. Now, Nasdaq should climb further northwards to complete wave iii in orange before starting a countermovement into the orange zone between 13 082 and 12 277 points. There, the index should conclude wave iv in orange and subsequently veer upwards again. There is a 40% chance, though, for Nasdaq to drop below the support at 10 636 points. In that case, the index would first develop new lows in the turquoise zone between 10 326 and 9 779 points before rising again.
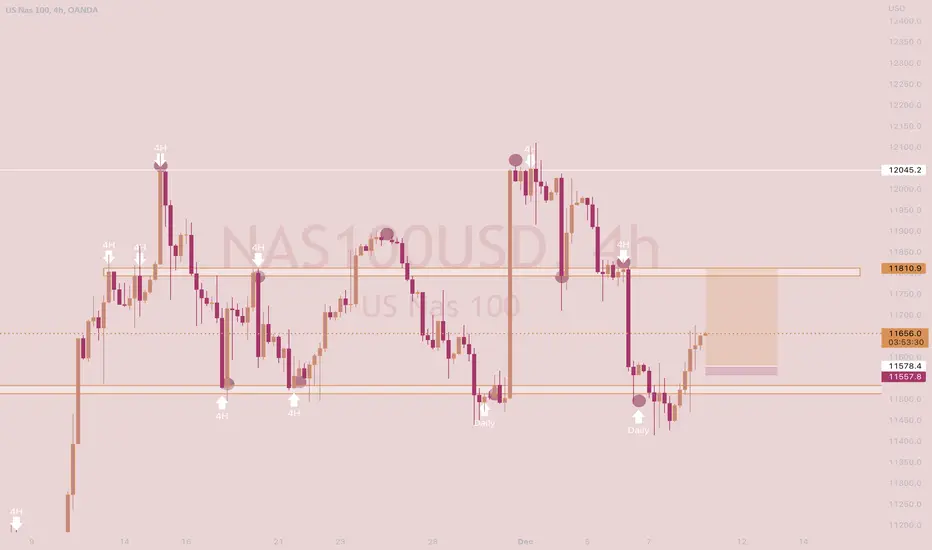
NAS100 OUTLOOK keeping a eye on nas at these levels after coming off a major pull back and making a lower high i want to see what price does around that 12500-12600 level if it holds we can start seeing another lower high which and another push down towards the 12100 level which is higher time frame orderblock area as well do keep in mind my biased is bearish at the moment due to the fact of lower highs and also a change of structure aka "choch" but doesnt mean we cant see a retrace up b4 coming down
now on the other hand if price breaks this 15 min orderblock we can see nas make a push towards 12600-12700 which is around the trend lines and also the pivot high for tomorrow so im watching as this develops just something to keep a eye on


Nasdaq -> The End Of The Bear MarketHello Traders,
welcome to this free and educational multi-timeframe technical analysis .
The Nasdaq is currently creating a massively bullish weekly double bottom and with this weeks rally already broke above the neckline of the double bottom.
From a weekly perspective I am not just waiting for a retest of the neckline, which is then turned support and then I am definitely looking for the longer term continuation to the upside.
On the daily timeframe, my prediction of the last video analysis played out perfectly and this was also a very juicy trade for me personally. Now we are testing daily resistance, so I am just waiting for an opportunity to get short, to then capitalize on the short term retracement towards the downside.
Thank you for watching and I will see you tomorrow!
You can also check out my previous analysis of this asset:

Nasdaq Analysis 12.01.2023Hello Traders,
welcome to this free and educational analysis.
I am going to explain where I think this asset is going to go over the next few days and weeks and where I would look for trading opportunities.
If you have any questions or suggestions which asset I should analyse tomorrow, please leave a comment below.
I will personally reply to every single comment!
If you enjoyed this analysis, I would definitely appreciate it, if you smash that like button and maybe consider following my channel.
Thank you for watching and I will see you tomorrow!
You can also check out my previous analysis of this asset:

Nasdaq Analysis 06.01.2023Hello Traders,
welcome to this free and educational analysis.
I am going to explain where I think this asset is going to go over the next few days and weeks and where I would look for trading opportunities.
If you have any questions or suggestions which asset I should analyse tomorrow, please leave a comment below.
I will personally reply to every single comment!
If you enjoyed this analysis, I would definitely appreciate it, if you smash that like button and maybe consider following my channel.
Thank you for watching and I will see you tomorrow!
You can also check out my previous analysis:

Nasdaq Analysis 26.12.2022Hello Traders,
welcome to this free and educational analysis.
I am going to explain where I think this asset is going to go over the next few days and weeks and where I would look for trading opportunities.
If you have any questions or suggestions which asset I should analyse tomorrow, please leave a comment below.
I will personally reply to every single comment!
If you enjoyed this analysis, I would definitely appreciate it, if you smash that like button and maybe consider following my channel.
Thank you for watching and I will see you tomorrow!
You can also check out my previous analysis of this asset:

Nasdaq Analysis 18.12.2022Hello Traders,
welcome to this free and educational analysis.
I am going to explain where I think this asset is going to go over the next few days and weeks and where I would look for trading opportunities.
If you have any questions or suggestions which asset I should analyse tomorrow, please leave a comment below.
I will personally reply to every single comment!
If you enjoyed this analysis, I would definitely appreciate it, if you smash that like button and maybe consider following my channel.
Thank you for watching and I will see you tomorrow!
You can also check out my previous analysis:

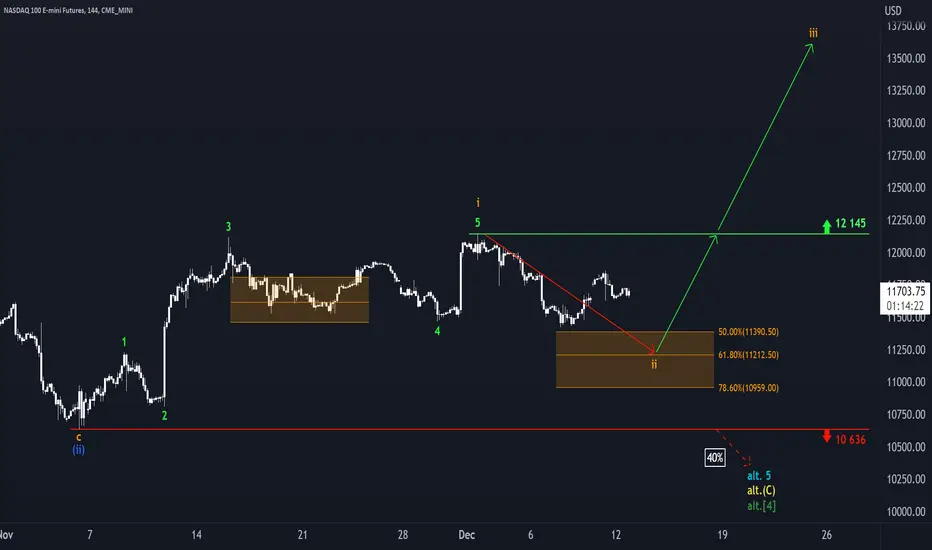
Nasdaq: Santa Baby 🎁If Santa fulfills our wishlist this year, Nasdaq should sink into the orange target zone to hit the bottom of the orange wave ii, before heading back North to surpass the resistance at 12 145 points and continue the upwards slope. Should Nasdaq carry on with the downward trend and cross the support line at 10 636 points, it would activate our alternative scenario, where the course should sink further to finish the green wave alt. .
NAS 100 BULLISH 12.09.22Expecting price to retest the 11576 area and continue bullish around the 11800 level.
Nasdaq Analysis 05.12.2022Hello Traders,
welcome to this free and educational analysis.
I am going to explain where I think this asset is going to go over the next few days and weeks and where I would look for trading opportunities.
If you have any questions or suggestions which asset I should analyse tomorrow, please leave a comment below.
I will personally reply to every single comment!
If you enjoyed this analysis, I would definitely appreciate it, if you smash that like button and maybe consider following my channel.
Thank you for watching and I will see you tomorrow!
You can also check out my previous analysis:

Nasdaq Running 200Pips ProfitNasdaq Running 200 Pips Profit
f you want to Hold must Half lot closed moce sl Entry level (GoodLuck)

Nasdaq Analysis 17.11.2022Welcome to the BasicTrading channel.
My name is Philip and in todays analysis I quickly go over the situation which we currently have on Nas100.
I will analyse the asset both from a weekly and daily timeframe to show you the best possible trading opportunities.
If you enjoyed this analysis, let me know in the comment section which asset I should analyse tomorrow.
I will personally reply to every single comment.
Dont forget to smash that rocket and I will see you tomorrow with a new analysis.

Nasdaq forming ABCD on Daily time frame . we are in berar trendNasdaq forming ABCD on Daily time frame . Nasdaq forming ABCD on Daily time frame . Not a financial advice we are in berar trend

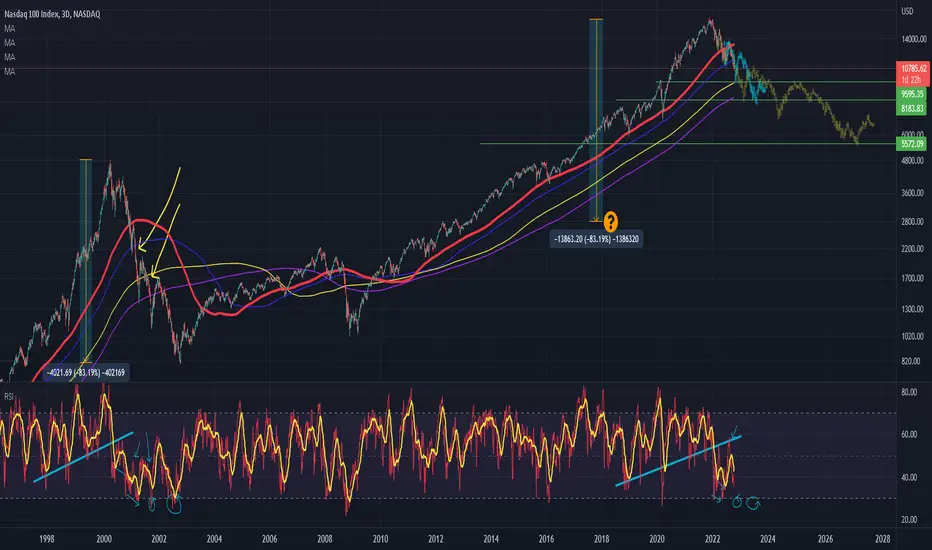
NASDAQ - Tech DEFLATION - dotcom crash repeat?NASDAQ - Tech DEFLATION - dotcom crash repeat?
Pretty self explanatory. Can we compare the two periods? Well so far we sure as shit can.
Note the touches below 30 on the RSI during that period. We have not had enough touches below 30 yet.
The fractal can be looked at in two ways as I see it. Both are on there. IMO blue is more likely as we have been going down for awhile and it would make a bit more sense time line wise. But who tf knows.
Its a good idea to have these maps imo to keep your senses about you. ie. to remind you how far this thing COULD drop. People around you will be calling bottoms all the way down, with each one falling like dominoes.
Remember the exuberance during the bull, how the top just keeps topping, well that's this, in reverse. Don't underestimate it either way, it always (almost always) goes harder (not bitcoin this last time) than you think.
Lets see how this shit show plays out.
gl
Nasdaq: Onion 🧅Like an onion, the Nasdaq-chart currently features multiple layers, and the index has processed them all. Hence, there is a 40% chance that it could directly continue the ascent it has already begun and climb above the resistance at 13740 points. However, we rather expect Nasdaq to drop below the support at 10890 points and thus to dive deeper into the blue zone between 11167 and 10043 points, where it should then finish wave (2) in yellow. Afterwards, the index should move upwards, crossing the resistance at 13740 points.

NASDAQ 100 INDEX TODAY There are a few ways you can trade the NASDAQ 100 with us. You can open a CFD trading account and trade on the NASDAQ 100 via our exclusive US Tech 100. Alternatively, you can use CFDs to trade on NASDAQ 100-listed stocks or a NASDAQ ETF. You can also trade the NASDAQ via options or futures.
Long NAS100There is a bullish divergence indication by Awesome oscillator and there are multiple rejection at a crucial support area from where the price has bounced before. So this clearly indicates end of the down trend. So you can go long on NAS100 and set target at the recent POI ( point of interest ).

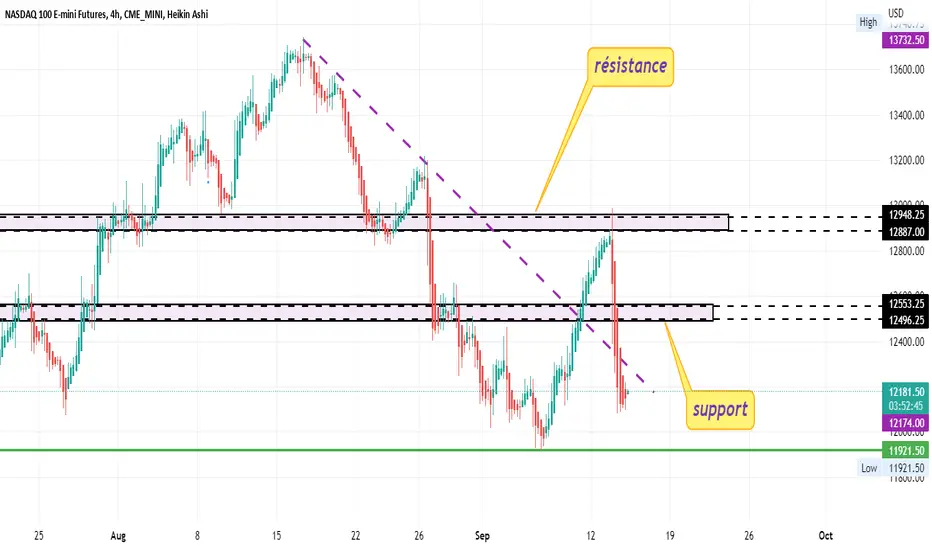
NASDAQ 100 E-MINI FUTURESA strong requirement has been achieved and a very strong support has been broken. Our goal will be pro support, which is considered strong.
Nasdaq: Banana LeafDid you know just how multifunctional banana leaves are? They can be used for cooking and packaging and to serve dishes, and can also be employed as roof or fence. Nasdaq is currently wrapped in a big green banana leaf between 11734 and 12343 points to finish wave 2 in green. Although this could have already been handled, we still give the index some time as long as it is making use of the green foliage. After wave 2 in green has finally been completed, though, Nasdaq should move upwards, climb above the resistance at 13740 points and head for the upper green zone between 15580 and 16444 points. However, a 45% chance remains that the index could drop below the support at 11479 points, thus triggering furthers downwards movement below the next mark at 11068 points.

US TECH 100Us nas 100 both upside and downside moves are mentioned on charts ,need good volumes to boos market upside direction otherwise dried volumes can drag market futher downside.