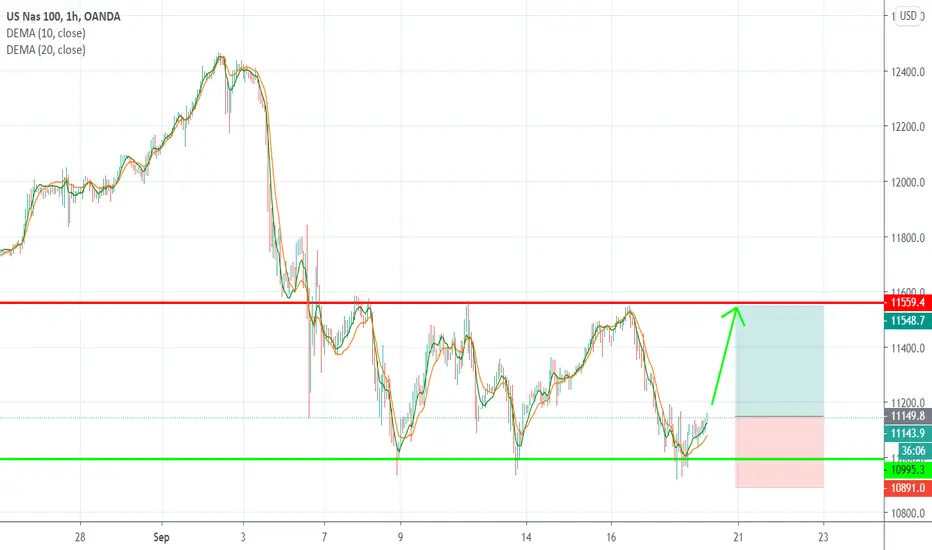
NAS100 - Trading planYesterday I said to buy at 12575, today there could be another entry between 12631 and 12575.
The highlighted green demand zone is just in case if the market suddenly crashed, there will be great opportunity to buy.
--
This idea is based on my technical analysis only.
Do your research and trade on your own risk!
Nasdaqidea

NASDAQ100: A 61-38% RETEST!So i made an analysis that went well which was a double with a bullish rise that lead to a breakout. a retest to 61% (12357) & 50% (12333) might just give us a 38% (12310) reach, a bounce of the 38% (12310) continues the bullish trend but if denied we might just be on our way down. but unfortunately the daily chart shows a bearish rejection so 🤞🏽on this week might just be bullish. if you loved my idea, leave a comment, like and be sure to follow for more 😗😙 cheers! ✌🏽🤑

Nasdaq100- Towards a new all time highSince 10.600 Low in September, Nas100 had a good run with a gain of almost 20%.
The rise is constructive and looks reliable and, with the price just under resistance, I expect a break and continuation.
12k is now support and dips towards this zone should be bought.
13k seems a logical target for the technology index

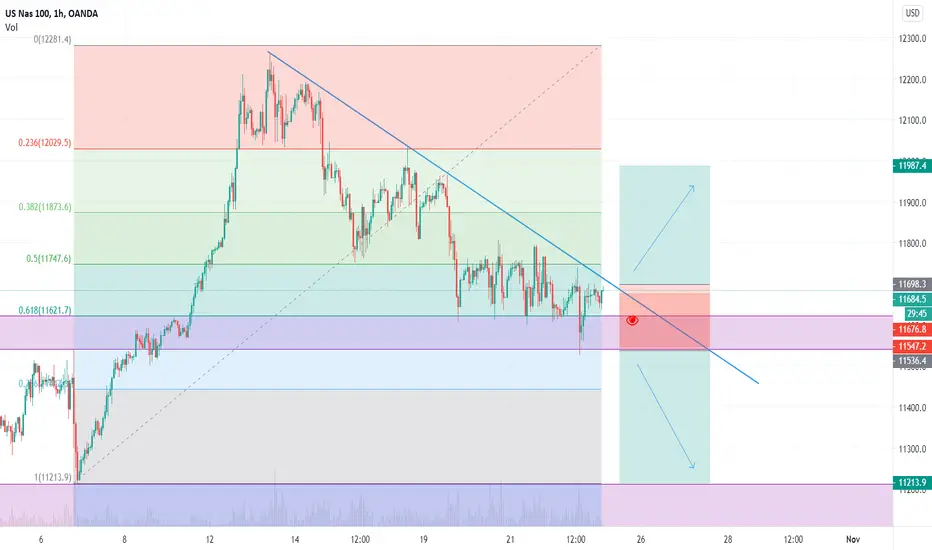
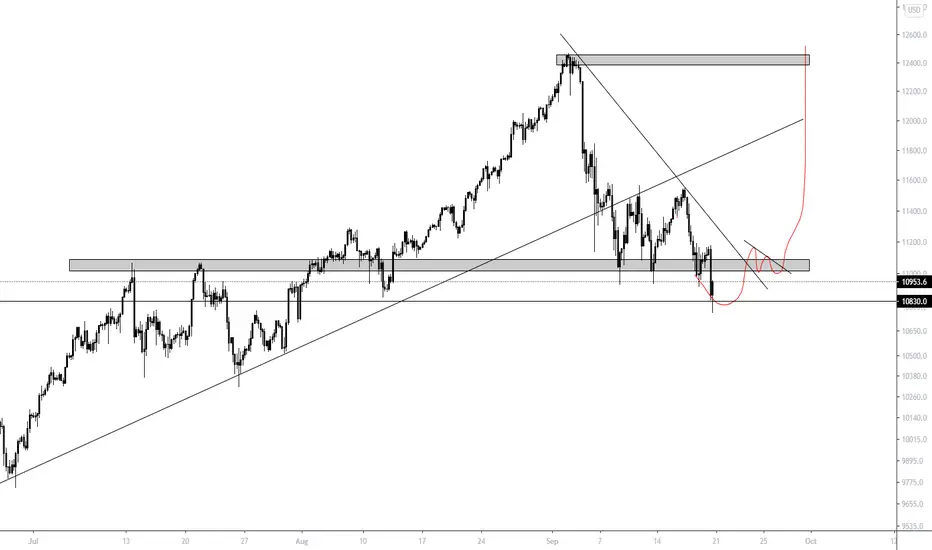
Nasdaq- Sell on confirmationAfter 1000 points drop from 12.500 top to 11.500, Nasdaq recovered some of the sosses and is trading at the time of writing above 12k figure (12040)
I expect a new leg down from the technology index and a new drop to at least 11500
A drop under 11900-12k zone would confirm this outlook and a rise above 12250 would negate it

NASDAQ - Possible correction inboundChart is self explanatory. also look at our previous ideas on Nasdaq here
NAS100 AnalysisNAS100 Analysis
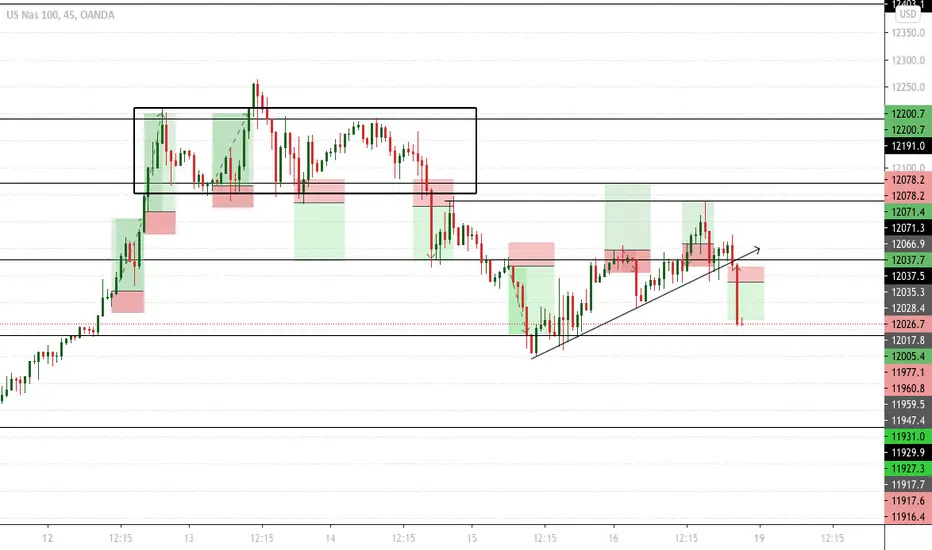
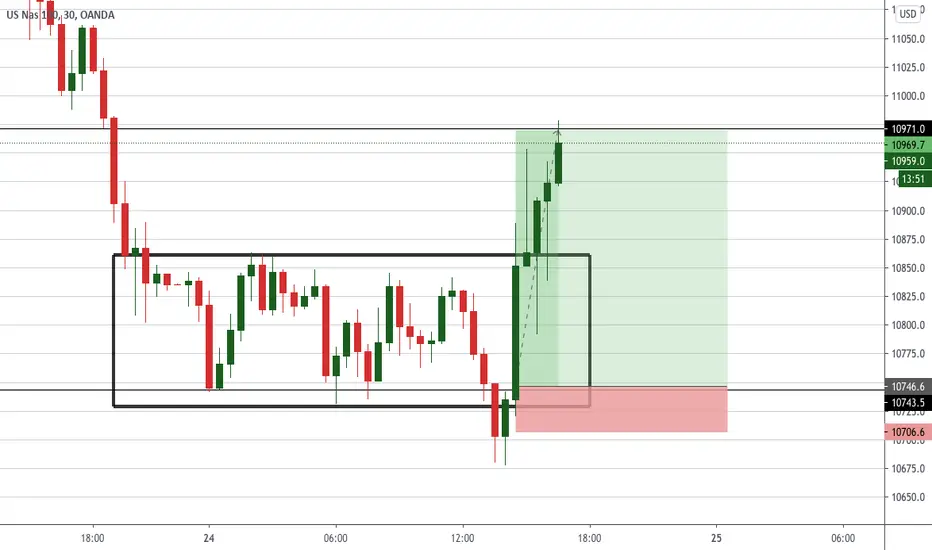
The market is still consolidating. We had some very strong moves this morning which is very strange for nas. We still haven't broke out the box so im just milking it inside the box😁. Those who know how to trade inside the box, will see there is many opportunities.
For Bulls target 11929 but need a break of the channel otherwise it can come back down
For Bears target 11467
NASDAQ 1D-TIMEFRAME ANALYSIS✨NASDAQ 1D-TIMEFRAME ANALYSIS✨
Hello ladies and gentlemen
This is my new idea for the NASDAQ
My idea is that the index will go higher
Target
13000
I hope my idea is clear
Support me by like and share
Good luck💰💯


NAS100- Weekly review Weekly Pip Review
Monday: +134, +182
Tuesday: +133, -42
Wednesday: +97
Thursday: +125
Friday: -41, +78, +70
Blues: +819........Reds: -83
Total: +736 Profit
Another Brilliant week. Every trade that was taken Analysis was given on this group. Only difference is, some have good entry/exit strategy and others just gamble. If you see the trades they weren't hard, every day 1 or 2 trades Max. Couple of losing trades because my stop loss is so small it makes no difference in comparison to my wins.
Even if you took 2 trades a week- if 1 was win of 150 pip and the other was loss of 40 pip, You total win is 110 pip. Thats how simple it should be.
Learn to trade and not gamble your money away. Your capital is your money so protect it with you life
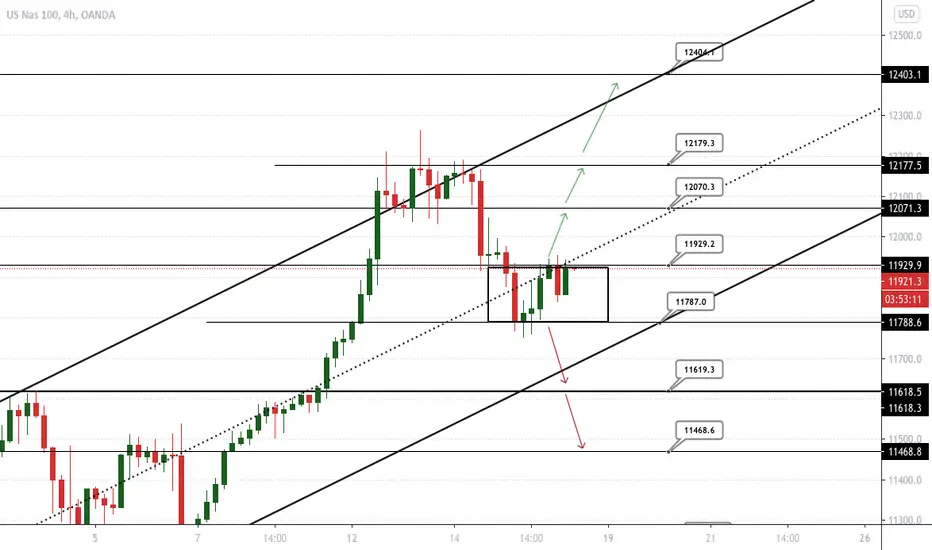
NAS100- Triangle formed- Ready to break out Lower TF Analysis
Triangle has been formed and it looks like it will shoot out very soon. Triangles are like spring, as they get narrower and narrower they will spring out.
Did you guys notice the triangle and do you know what type of triangle this is and which way it will go ???

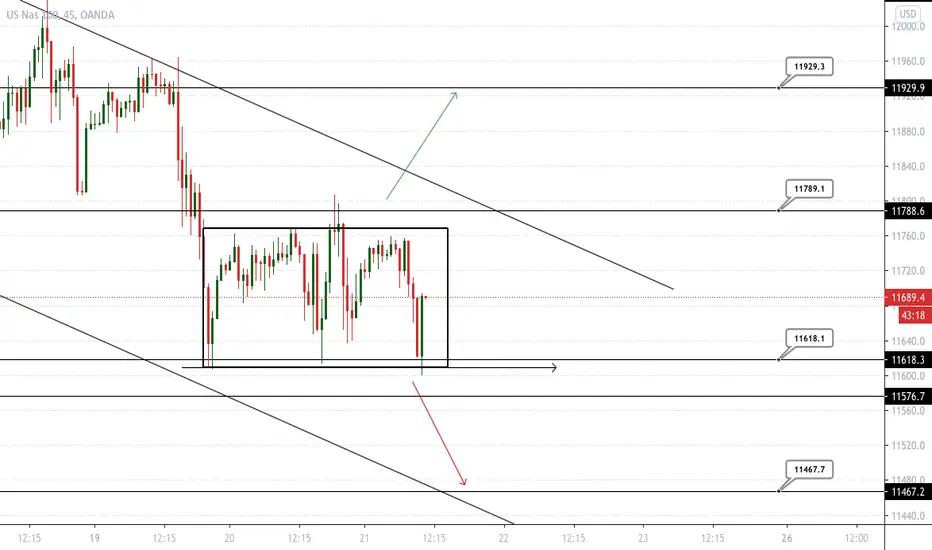
NAS100- Analysis NAS100 Analysis
I would say its still consolidating between 11787 -11929. We can also see it struggling to break our strong middle trend line. So to go further up we need a break of the middle trend line and 11929 resistance. As for the bears a break at 11787 would take us back down to 11619 hitting our lower channel trend line.
There is also something very interesting happening in the lower TF- See the next post
NAS100 Analysis NAS100 Analysis.
The market is still consolidating. When a market is consolidating you can still trade inside the box. There is still good pips to be made. This consolidation range is around 150 pips. However the best way to trade these are to wait for the break!! And it required patience.
So what can happen when it break. If it breaks down it can hit 12000 as a fake break out and go back up and break upwards. or it can carry on bearish by breaking 12000. As for the bulls break of 12260 to carry on.
Bulls Target: 12400- 12800
Bear Targets 11838- 11618

NDX - Downward channel setupHi guys, we've had a great run upwards since the double bottom at approximately ~10700 levels.
I've drawn some new lines that could show us the way forward. However, this idea is going downwards.
If the fiscal stimulus goes through congress and gets accepted, i believe this channel will be invalid.
However, if it fails the coming week, we will be ready for a new selloff.
Good luck with the trading the coming weeks!
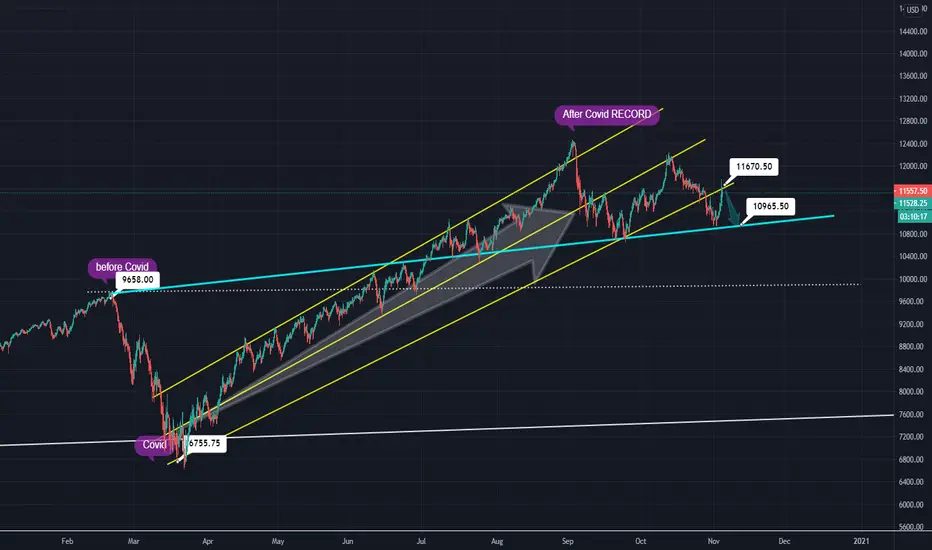
NASDAQ is expecting a bullish rally until Presidential pollNASDAQ
After the massive rally by the market hopes and optimism about the healthy markets.
During the starting of this month NASDAQ bleed massively as the sell of happens quickly.As its takes only 19 days to reach the current lower level which is 10660.00 But its take around two month to reach the points as felled in recent day
We can expect rebound from the 11035 support level. As President TRUMP is infected with COVID-19 minor lower correction are expected towards the 11035 level. If the health condition of the President improves the market will get boost from the positive news.The election developments may negatively impact the NASDAQ.
I am expecting NASDAQ will reach the 12600 at the end of next month.
Give a like if you found useful and share with your friends and trading community.And tell about your opinion in the comment section below

FAANG Nasdaq Nirvana; This is your personal ATM!... or could be!
There is more money to be made here than in a "crash" ... so do it! Scalp it like a there was no tomorrow - as there may not be one :-)
(Both, outright Longs & Shorts are suckers here!)

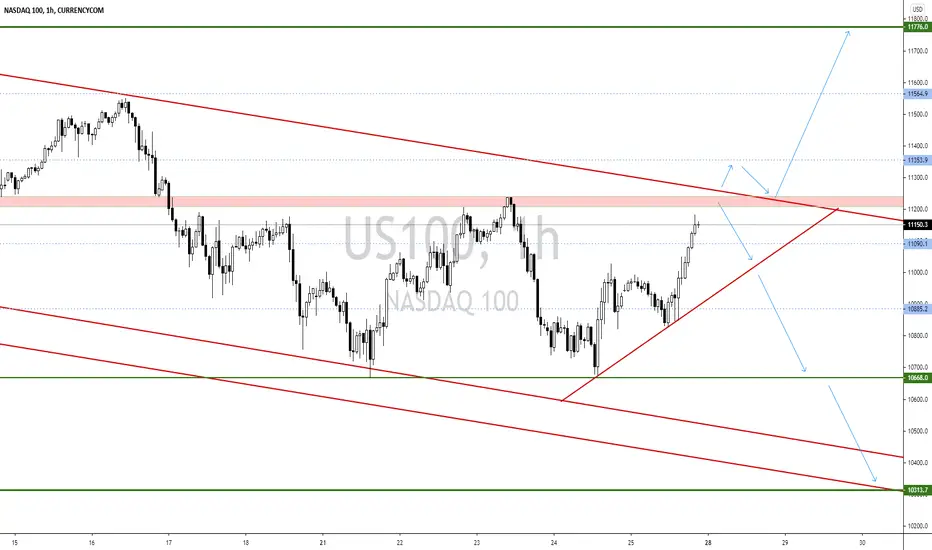
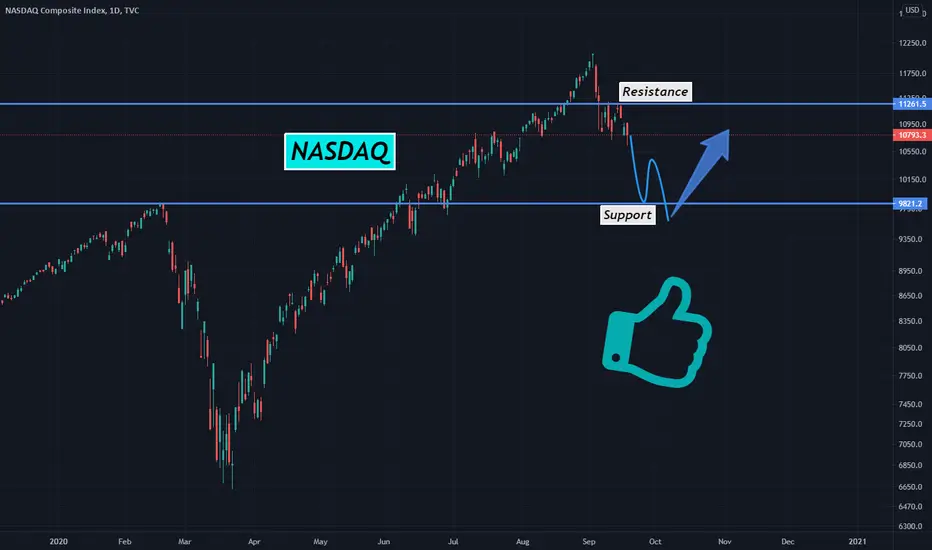
NASDAQ 100 | downward trend or upside breakout ?NASDAQ 100 is in a downtrend we may see rejection for short at 11200
Possible next move is to 10668 to 10313
Breakout at level 11300 may take it to 11776
Resistance Levels: 11200, 11354, 11564, 11776
Support Levels: 11090, 10885, 10668, 10313
Let's watch...
#JustTradeFxOnline
Thanks for your love and support.
Don’t forget to like and comment for more.
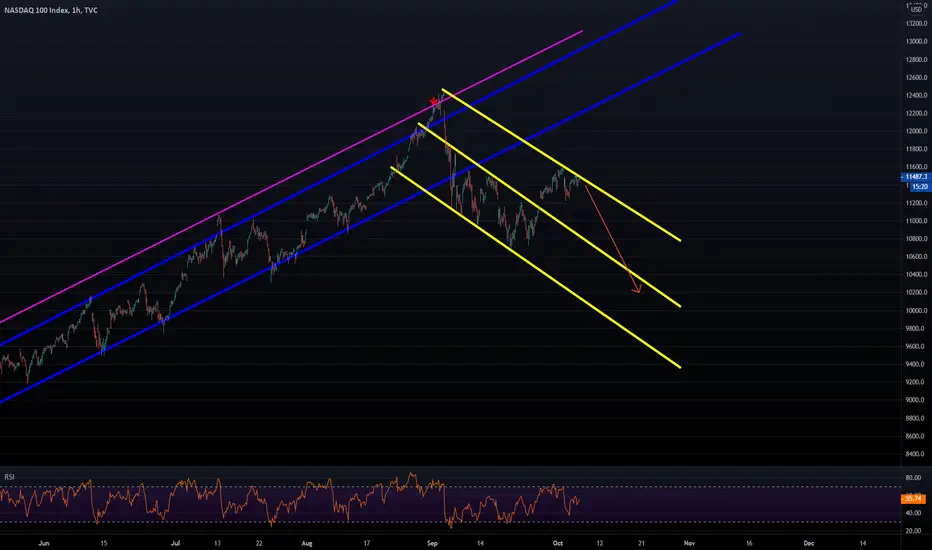
Will Nasdaq exceed highs again?Nasdaq 100 Index // Ticker: NDX // Logarithmic scale // 4 Hours time frame.
Since the nasdaq peaked in early September, it has not been as strong as before.
In the previous analysis we recommend not taking long positions because it was in a phase of euphoria and at any time it could correct as it has happened.
At this moment the scenario for the 4-hour temporality is lateral. Bearing in mind that the index is trading below the SMA30, be careful if the bears decide to push the index lower. Let's not forget that the long-term trend is still quite bullish but that in lower time frames we can have downward or range trends.
Our recommendation: The elections to elect the president in the United States are very close and volatility is going to increase, therefore the operator must take this relevant fact into account. For the moment we will continue to open long positions operating in day trading since we do not feel comfortable with long positions in the medium or long term with the astual technical scenario.

NAS100- TP HIT Everyone that saw my previous post regarding false breakout must have witnessed it today live at New York market time how it broke out and then closed back in. Entry just after the false breakout- Easy over 200 pips there. Thats all you need. one good trade and you are sorted for the day
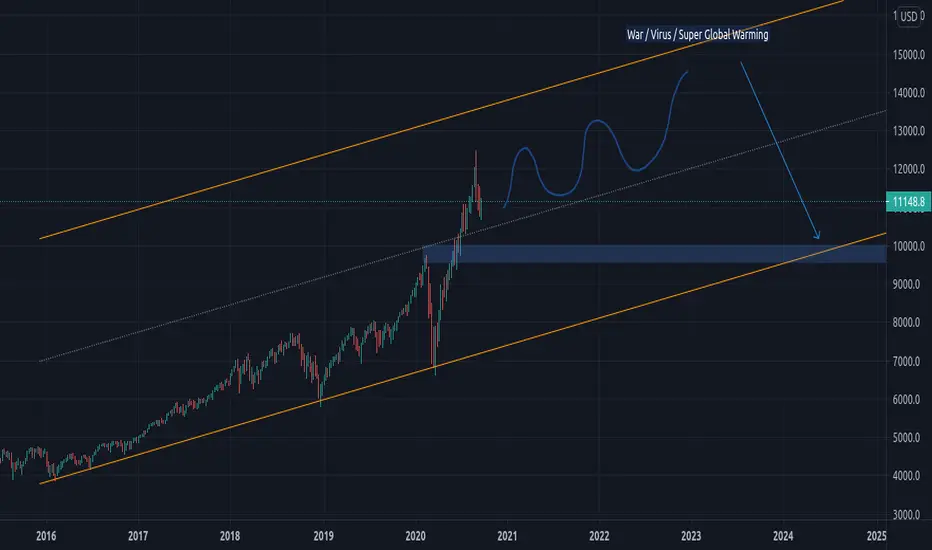
NASDAQ to fall more or recover now?Nasdaq broke previous support and made new lows. Will it recover from here? Will it make new lows? Will it completely crash out?
Well in any case, we would be looking to buy it all the way back to the ATH. Why? Because NASDAQ is in an Uptrend on the monthly and Stonks only goes up.
Personally, I'm waiting for a sellers trao to form, who will sell either at the retest of the trendline or the retest of the broken support. My entry will be after the corrective pattern is broken out as well. This will be a low risk high reward trade I'm not looking at missing any time soon.
Nasdaq outlookAfter finding a top in 12400 all-time high, Nas100 had a normal correction and dropped 11k zone.
This 10% correction doesn't change anything and both long-term and medium-term trends are bullish.
11k zone is well defended by buyers and I expect at least a retest of the new range's resistance soon.
I will look for buying opportunities