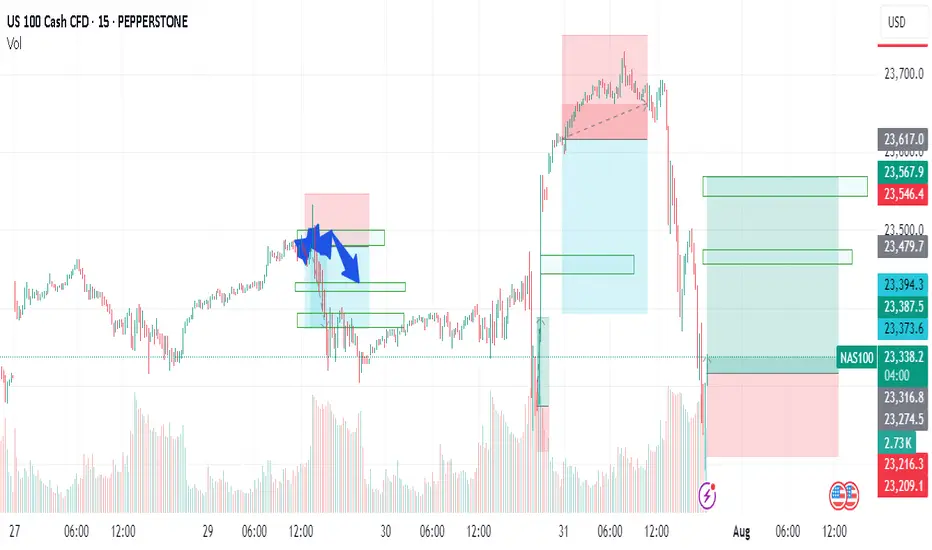
NAS - TIME FOR JUICYTeam, hope you all making a killing on SHORT tonight.
as we expected. Thank you for asking and be patience
TIME TO MAKE NAS100 GREAT AGAIN.
Sorry my entry was 23240, but now the market is 23332
you should entry small volume at the current price 23332 - if a little pull back below 23300 add more
STOP LOSS at 23230-50
TARGET 1 at 23385-23400
TARGET 2 at 23475-23515
LETS go - time to make ACTIVE TRADER ROOM GREAT AGAIN.!
Nasdaqlong
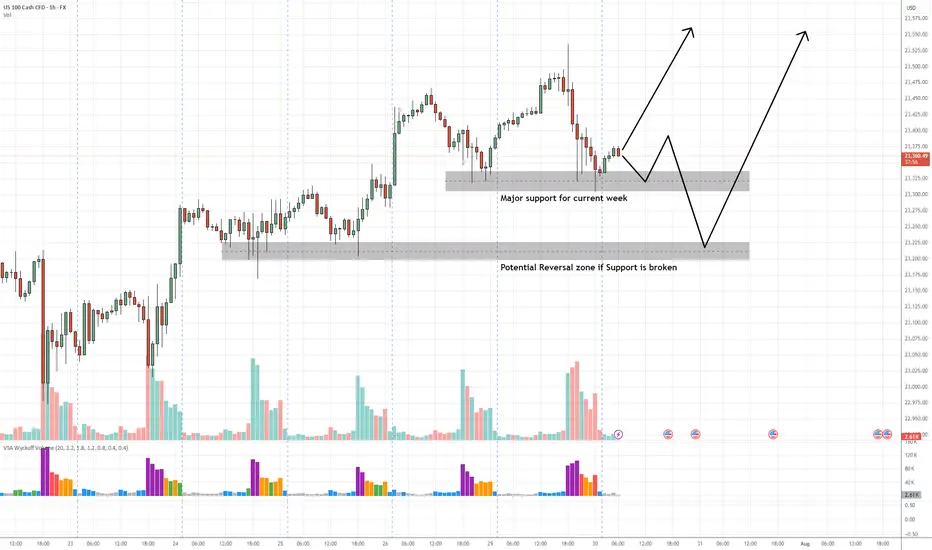
NAS100 Buy Setup – VSA & Multi-Zone Demand Analysis✅ Primary Entry Zone: Major support for current week (around 23,325–23,350)
✅ Secondary Entry Zone: Potential reversal zone if primary support is broken (around 23,200–23,230)
🎯 Target 1 (TP1): Previous swing high near 23,500
🎯 Target 2 (TP2): Extension above 23,550
🛑 Stop Loss (SL): Below 23,170 (beyond secondary reversal zone to avoid false breaks)
📊 Technical Insight (VSA & Price Action Structure)
Support Structure:
The current major support zone has been tested multiple times with no follow-through selling, indicating strong buying interest from larger players.
Volume Spread Analysis Observations:
On the recent decline into the major support zone, we see wider spreads on high volume followed by narrow range candles on lower volume, a classic sign of stopping volume and supply exhaustion.
Within the secondary reversal zone, historical reactions show climactic volume spikes leading to sharp reversals, suggesting this level is watched closely by smart money.
Any test back into the zone on low volume would confirm the No Supply (NS) condition.
Trade Pathways:
Scenario 1: Price respects the major support and begins to climb, confirming demand dominance → target TP1 then TP2.
Scenario 2: Support is temporarily breached, triggering a liquidity grab into the secondary reversal zone, followed by a bullish reversal bar on high volume → strong buy signal with potentially faster move toward TP levels.
📍 Bias: Bullish as long as price holds above the secondary reversal zone.
📌 Execution Tip: Wait for a wide spread up-bar on increased volume from either zone to confirm the start of the markup phase.
CASH100 (NASDAQ) CRASH - Head and shoulders Risk/reward = 3.7
Entry price = 23 430
Stop loss price = 23 503.2
Take profit level 1 (50%) = 23 202
Take profit level 2 (50%) = 23 099
Still waiting for some variables to confirm before entering the trade
NAS100 - EXPECTING THE DUMPTeam, we got short well today with AUS200 - both target hit
we have set up the NAS entry , this is the entry price 23268 - 23200
STOP LOSS at 23100
Once it break above 23320 - bring stop loss to BE
Target 1 at 23320-60 - take 50%-70& partial
Target 2 at 23380-23400
LETS GO

NASDAQ (CASH100) SHORT - Double top H6Risk/reward = 4
Entry price = 23 463.1
Stop loss price = 23 534.2
Take profit level 1 (50%) = 23 169
Take profit level 2 (50%) = 23 169
All variables met. Now just need price to reach entry level and close back within range.
QQQ : Stay Heavy on Positions QQQ, QLD, TQQQ : Stay Heavy on Positions
Amid record-high markets, fear-hedging sentiment is slowly transitioning into renewed risk-taking.
When entering an underweight zone, I rotate out of QLD or TQQQ into QQQ and reduce overall exposure.
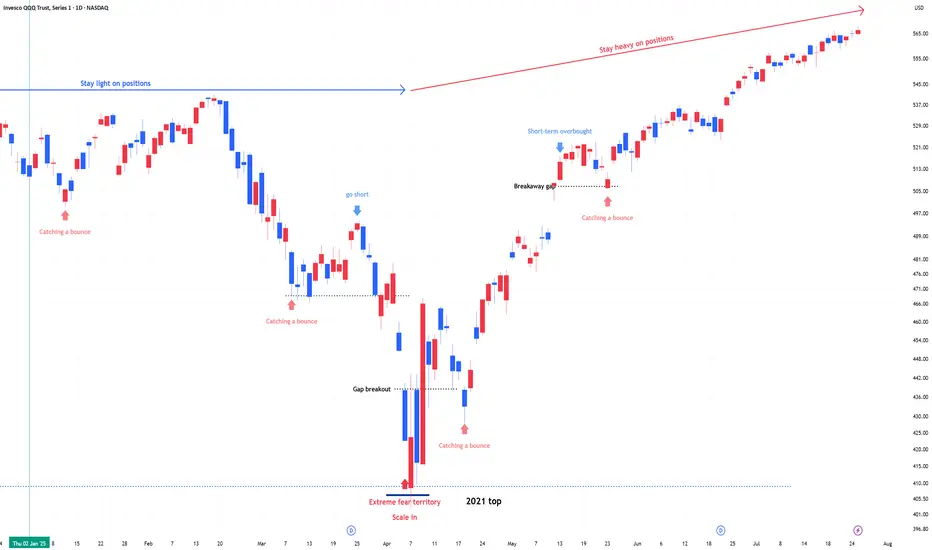
US 100 (NDQ) : Stay Heavy on PositionsApril Fear & Buy Signals
In early April, the Nasdaq 100 experienced a sharp sell-off, triggering extreme fear sentiment across the market.
At that point, scale-in buy signals appeared—classic "buy the fear" conditions.
Markets swing between greed and fear—unless the whole country collapses. Right now, greed is taking the lead, but the real blow-off top volatility hasn’t even started yet.
Stay Heavy on Positions
Despite short-term uncertainty, I’m maintaining an overweight position on the Nasdaq 100.
As long as we don’t see a major breakdown, the bias remains bullish.

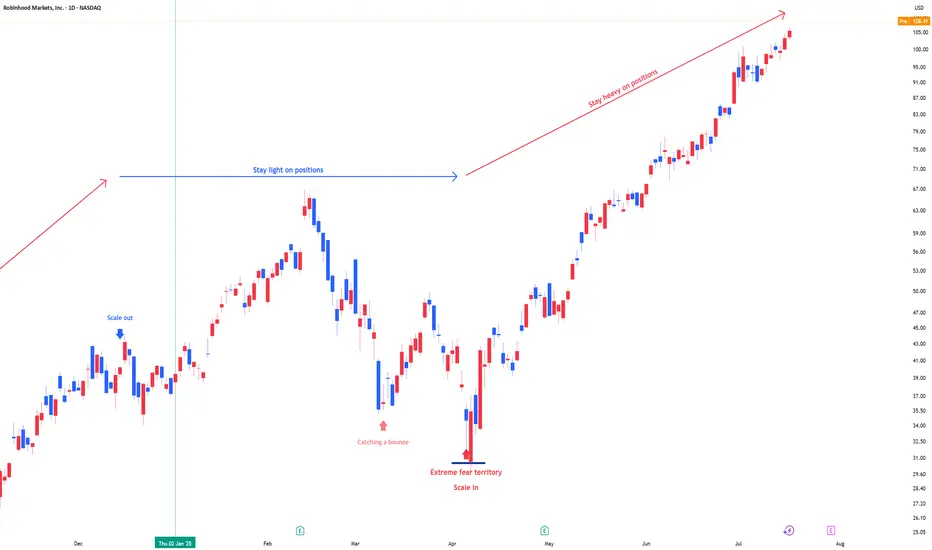
RobinHood Markets: Stay heavy on positionsHOOD position size is adjusted in line with US market signals for underweight or overweight allocations. During panic phases, 2x leverage ETFs are on the table
Stay heavy on positions.
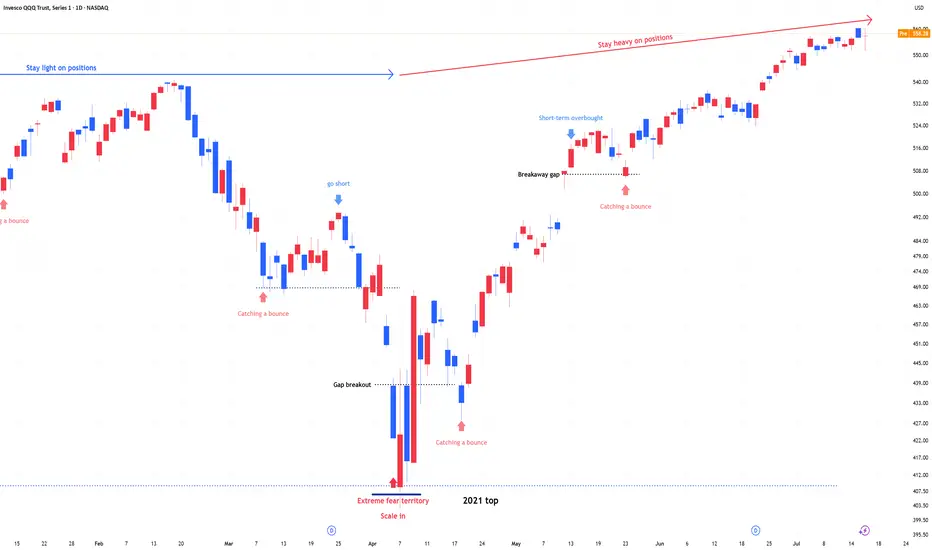
QQQ : Stay Heavy on Positions1) April Fear & Buy Signals
In early April, the Nasdaq 100 experienced a sharp sell-off, triggering extreme fear sentiment across the market.
At that point, scale-in buy signals appeared—classic "buy the fear" conditions.
2) Current Market State: No More Fear, but Watching
Since then, the market has stabilized.
The fear has disappeared, but we are still in a wait-and-see mode as traders assess the next move.
Momentum is holding, but participation remains cautious.
3) Stay Heavy on Positions
Despite short-term uncertainty, I’m maintaining an overweight position on the Nasdaq 100.
As long as we don’t see a major breakdown, the bias remains bullish.
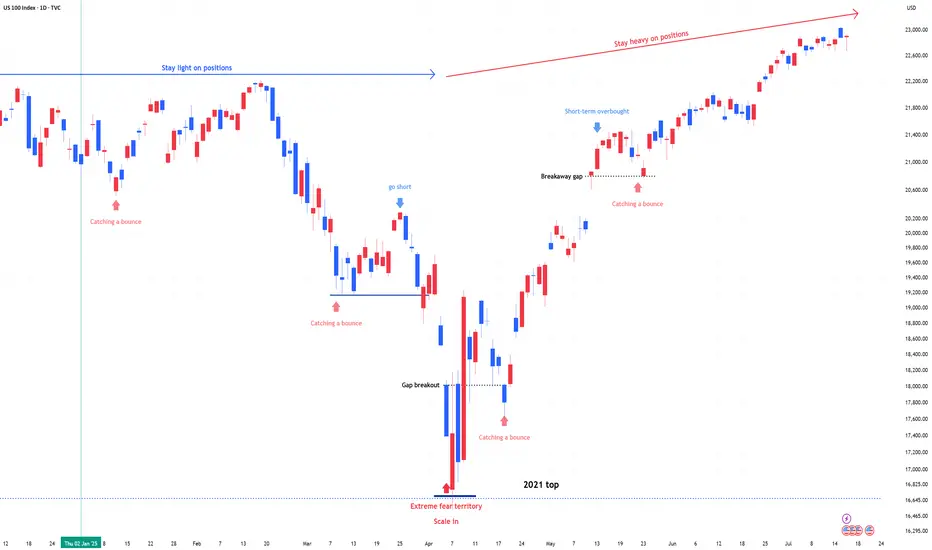
US 100 (NDQ) : Stay Heavy on Positions1) April Fear & Buy Signals
In early April, the Nasdaq 100 experienced a sharp sell-off, triggering extreme fear sentiment across the market.
At that point, scale-in buy signals appeared—classic "buy the fear" conditions.
2) Current Market State: No More Fear, but Watching
Since then, the market has stabilized.
The fear has disappeared, but we are still in a wait-and-see mode as traders assess the next move.
Momentum is holding, but participation remains cautious.
3) Stay Heavy on Positions
Despite short-term uncertainty, I’m maintaining an overweight position on the Nasdaq 100.
As long as we don’t see a major breakdown, the bias remains bullish.
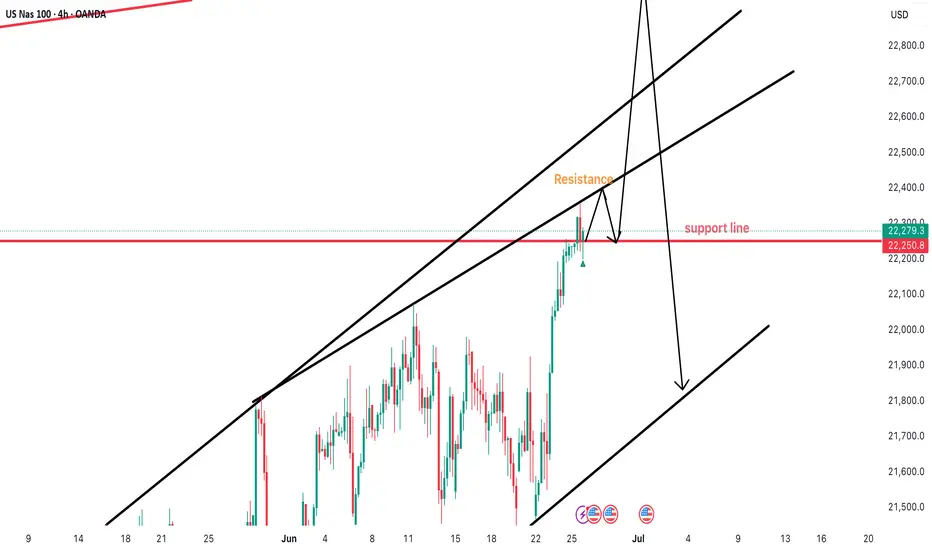
nasdaq100OANDA:NAS100USD
has reached the previous highest level.
We see that the trendline has made a high possibility of the nasdaq 100 to reach a new high level because the price has gone above the previous high level, and came back to test it.
Now the price is going back up. It is fascinating as to what nasdaq100 will do next and how
other indices will be affected, including Gold and forex...
My opinion on nasdaq100:
1. It has made a different move compared to the previous high levels when they reached this level. Previously when the price reached the horizontal line (the resistance level) price began to push down and create very long spikes.
2. Nasdaq100 will go way too high and spike on that highest trendline. Spike from that level thereby create a new resistance level.
3. And then price will begin to push down strong. This will happen only if there will be a very strong spike meaning an incredible amount of sells pushing the price down.
NASDAQ 2 Expected Scenarios Very Clear , Which One You Prefer ?Here is my opinion on Nasdaq on 4H T.F , The price still below my res so we can sell it if the price touch the res level again , and if we have a daily closure above my res then we can buy it with retest for the broken res , so it`s very easy if we still below the res we can sell and if we going up it we can buy it . but we need a daily closure above first .

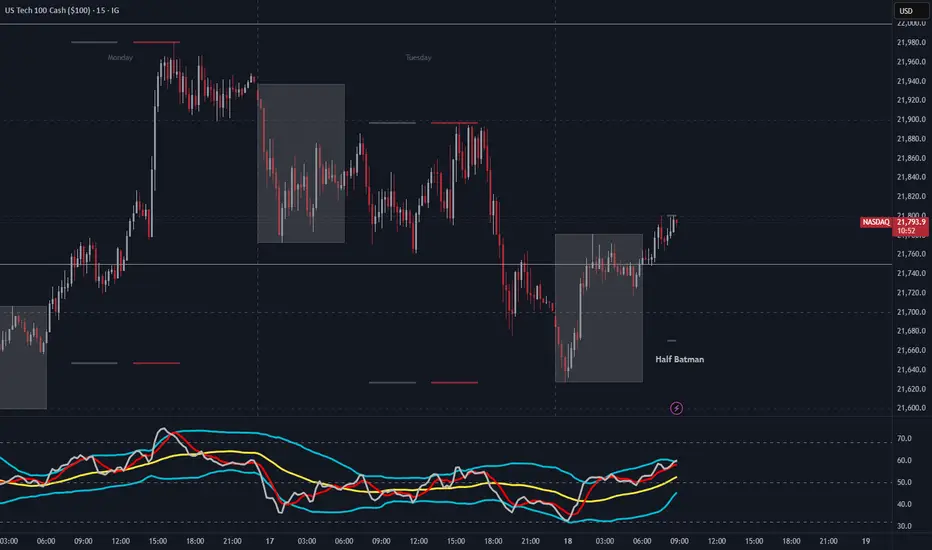
NAS100 (US100) Mid Week Reversal - Bullish Order FlowA Half Batman presents itself during the Asian session and seems to be ready for LDN opening. This Peak Formation could be seen as the reset, to turn NAS100 bullish and ready to break the structure high.
NAS - ACTIVE TRADE COMMUNITY - PLEASE BRING TO THE MOONTeam, we have successfully trade both LIVE trading on UK100 short yesterday and LONG both NAS AND DOWN yesterday.
Today we are entry small portion LONG for NAS.
WILL DOUBLE LONG if market drop low at 21650-21600
Target 1 - at 21850-21875
TAKE 50-70% volume on profit and bring stop loss to BE once target 1 hit
Target 2 remaining at 21900-21950
GOOD LUCK AND LET KILL THE BEAST TOGETHER
NAS - TIME TO MAKE ACTIVE TRADER ROOM GREATER AGAIN!Team, last week we got a good entry on both DOW/US30 AND NAS100/TEC100
Yes, i do know about the situation with ISRAEL AND IRAN.
This will drag on for at least 3-6 months for the solutions
however, I expect the cease fire should be stop within next week as President Trump's is negotiation with Iran
There are two strategy to trade for the NAS- NASTY market
Rule: make sure you calculate how much position and volume you are taking risk on the trade. Every time you enter, ensure you are understood each trade risk.
As I always do.
The last 90 days we have not losing a single trade - check my new video release soon.
OK, lets get back to the trade set up again
entry small volume at market now.
If market falling down during US session, buy more at the second setting
However, I expect the 1st setting likely to recover soon.
Jump on board now.
See you to the moon

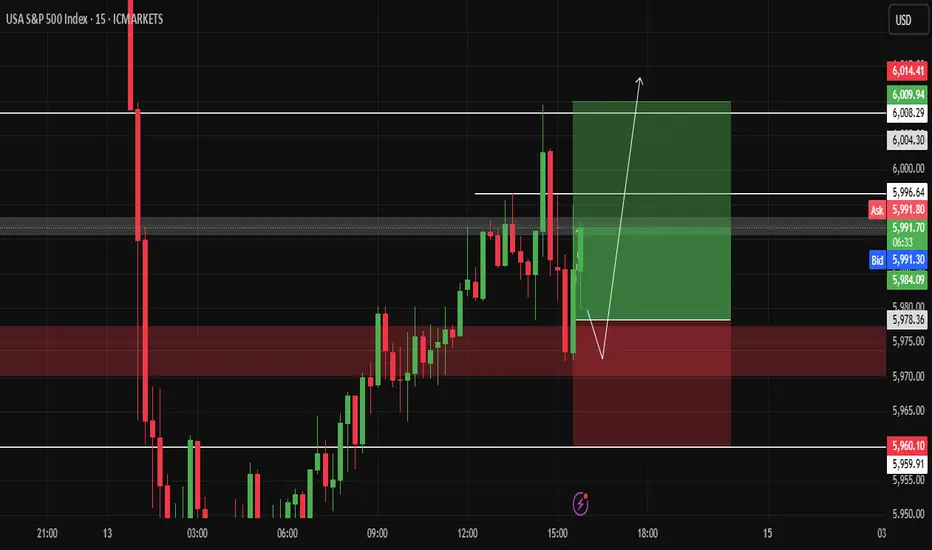
-(update)- Opportunity for buying NASDAQ After careful observation and relying on support and resistance, I see an upward movement from the support represented in front of you.
NAS - LOOKING FOR RECOVERTeam This morning we got out of beautiful SHORT on UK100
Market dumping hard due to ISRAEL'S and Iran
However we expect market to be recover during UK market opening
Please follow the price accordingly to the chart
Once it reach 1st target, take 50-70% profit reduce the volume and bring stop loss to BE
LET'S GO.
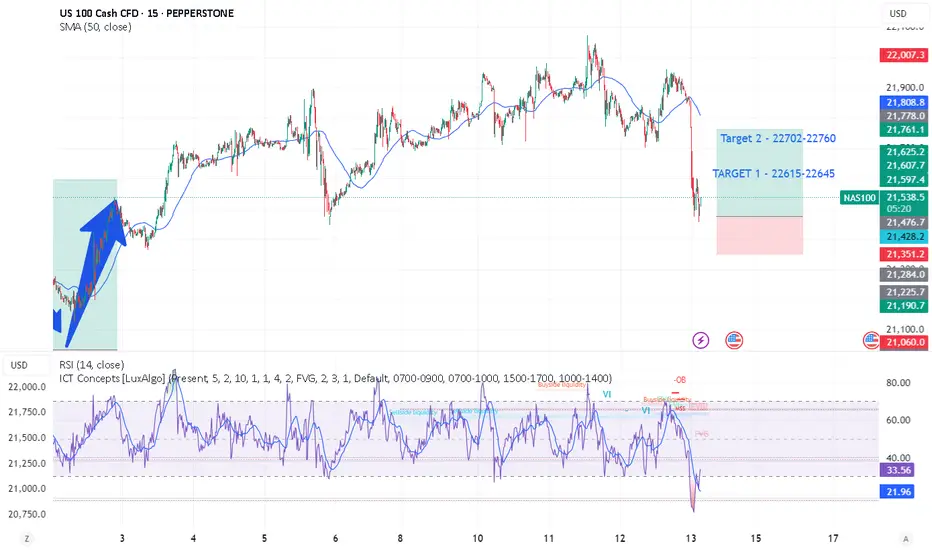
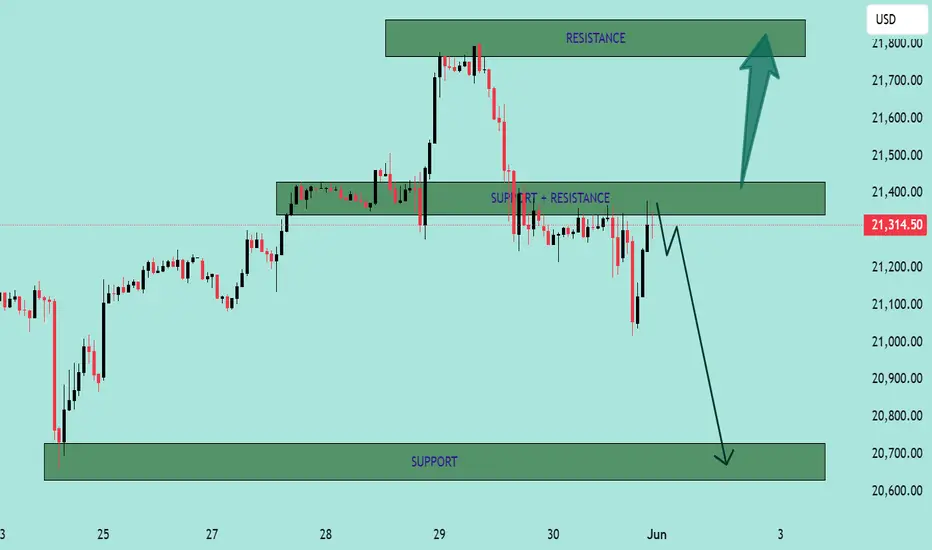
NASDAQ100 Analysis – Key S/R Zones & Price Reaction Incoming! NASDAQ100 Analysis – Key S/R Zones & Price Reaction Incoming! 🚨
🔍 Chart Breakdown:
This is a technical chart analysis of NASDAQ100 (NAS100) with defined Support and Resistance zones. The price is currently at 21,314.50, sitting below a critical decision area.
🧱 Key Zones:
🔵 Resistance Zone:
‣ 21,640 – 21,800
‣ Strong supply area where price sharply reversed previously.
‣ If price breaks above the mid resistance zone, a bullish move towards this level is likely.
🟩 Support + Resistance Flip Zone:
‣ 21,280 – 21,420
‣ Former support, now acting as resistance.
‣ Price is struggling to reclaim this zone.
‣ Acts as a key decision level.
🟢 Support Zone:
‣ 20,630 – 20,750
‣ Strong demand zone from which previous rallies initiated.
‣ Target if bearish rejection continues.
🔄 Price Action Insight:
Price is currently rejecting the Support-turned-Resistance zone.
There’s a clear bearish rejection at the mid-zone (S/R flip), forming a lower high structure.
📉 A breakdown from current levels could lead to a retest of the support zone at 20,700 area.
🟢 However, a successful reclaim and bullish confirmation above 21,420 could see price target the upper resistance at 21,800.
📌 Outlook:
🔽 Bearish Bias if price fails to break above 21,420 – possible drop to 20,700.
🔼 Bullish Reversal above 21,420 could drive price to 21,800.
📅 Date: June 1, 2025
🕒 Timeframe: Likely 1H or 4H chart
💬 “Respect the levels, not the noise.”
Trade safe! ✅
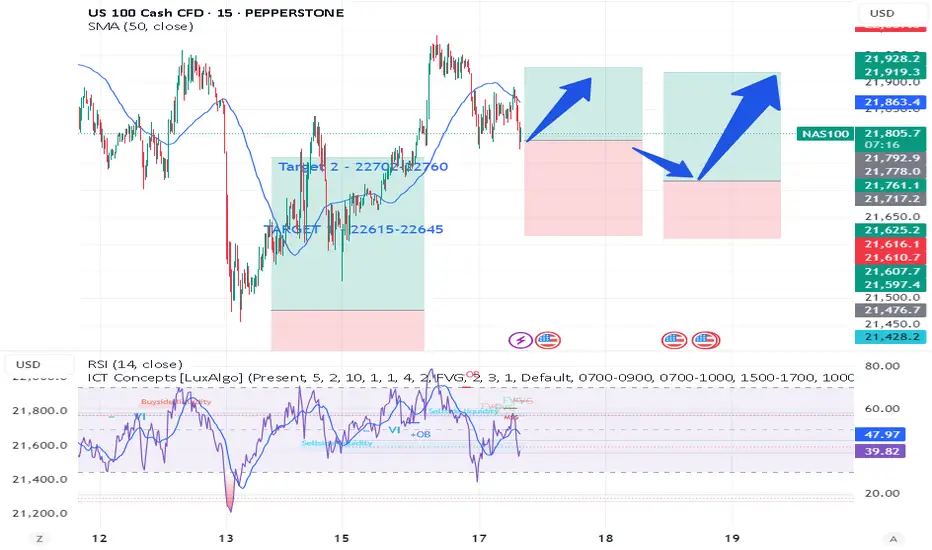
NAS100-TEC100 - THE SECRETE OF TRADING INDICES STRATEGYTeam,
yesterday we short the NAS, DOW, DAX and long the GOLD - 4 out of 4 perfectly target hit
Now, we are going long, i want you to carefully look at the picture and understand the concept of how I structure the trade. This has been calculate using my statistic and probability to ensure our entry is safe.
First picture, is buying small volume, if market volatile and push further down, i need you to double up your trade, this allow us to win better.
That's the reason why you saw my videos that everyday i show LIVE trading and profitable every trade. However, always carefully look at your capital and know exactly how much risk are you going to take.
Remember, you can win straight 3-6 months and if you failed risk management and overleverage yourself, the account can easily be kill within 1 day.
Hope you all have a great day.!

Nasdaq analysis: 29-May-2025Good morning, everyone! Today's Nasdaq analysis is designed to educate and empower. Use these insights to refine your price action trading strategy.

NASDAQ: More Bullish MovementsHuge drop on the left side which happens to reset the trend. Maybe NAS could continue to rally from this point forward
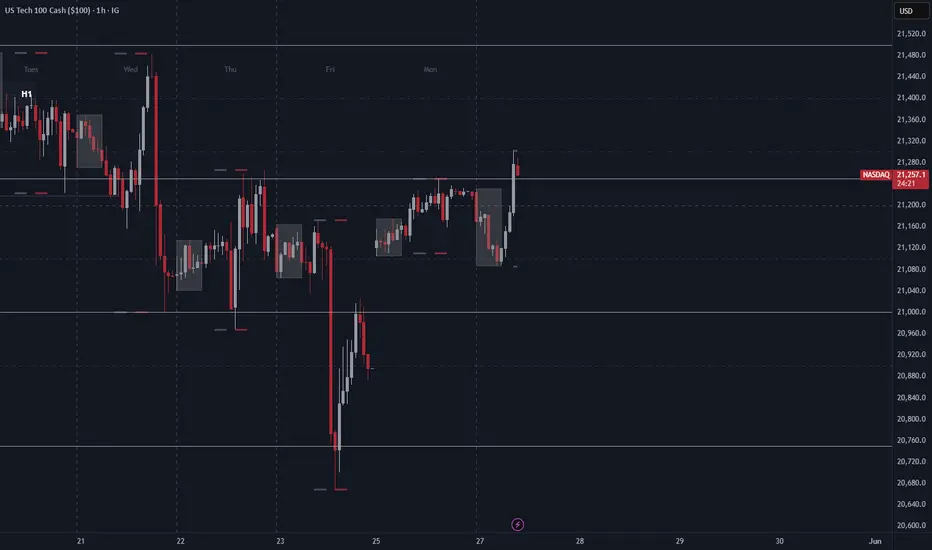

(NQ) | Strong Buyers and Blue‑Box Entry Zones(NQ) | Strong Buyers and Blue‑Box Entry Zones
NQ shows powerful buying pressure, and the marked blue boxes highlight areas where demand has reliably appeared. For those seeking long exposure, two approaches stand out:
Low‑Time‑Frame Breakouts from the Blue Box
Wait for price to dip into a blue‑boxed support zone and then break higher on shorter time frames. A decisive move with rising footprint volume confirms genuine buyer commitment.
Direct Low‑Time‑Frame Breakouts
If price skips a pullback and powers upward on low‑time‑frame charts, that momentum surge—backed by substantial volume—also provides a valid long entry.
Key Considerations
Ensure any breakout is backed by real volume footprint signals, not just price movement.
If these zones fail to hold or volume dries up, stand aside and await the next confirmed setup.
By focusing on these blue‑boxed areas and insisting on volume‑confirmed breakouts, you align your entries with where buyers truly dominate.
📌I keep my charts clean and simple because I believe clarity leads to better decisions.
📌My approach is built on years of experience and a solid track record. I don’t claim to know it all but I’m confident in my ability to spot high-probability setups.
📌If you would like to learn how to use the heatmap, cumulative volume delta and volume footprint techniques that I use below to determine very accurate demand regions, you can send me a private message. I help anyone who wants it completely free of charge.
🔑I have a long list of my proven technique below:
🎯 ZENUSDT.P: Patience & Profitability | %230 Reaction from the Sniper Entry
🐶 DOGEUSDT.P: Next Move
🎨 RENDERUSDT.P: Opportunity of the Month
💎 ETHUSDT.P: Where to Retrace
🟢 BNBUSDT.P: Potential Surge
📊 BTC Dominance: Reaction Zone
🌊 WAVESUSDT.P: Demand Zone Potential
🟣 UNIUSDT.P: Long-Term Trade
🔵 XRPUSDT.P: Entry Zones
🔗 LINKUSDT.P: Follow The River
📈 BTCUSDT.P: Two Key Demand Zones
🟩 POLUSDT: Bullish Momentum
🌟 PENDLEUSDT.P: Where Opportunity Meets Precision
🔥 BTCUSDT.P: Liquidation of Highly Leveraged Longs
🌊 SOLUSDT.P: SOL's Dip - Your Opportunity
🐸 1000PEPEUSDT.P: Prime Bounce Zone Unlocked
🚀 ETHUSDT.P: Set to Explode - Don't Miss This Game Changer
🤖 IQUSDT: Smart Plan
⚡️ PONDUSDT: A Trade Not Taken Is Better Than a Losing One
💼 STMXUSDT: 2 Buying Areas
🐢 TURBOUSDT: Buy Zones and Buyer Presence
🌍 ICPUSDT.P: Massive Upside Potential | Check the Trade Update For Seeing Results
🟠 IDEXUSDT: Spot Buy Area | %26 Profit if You Trade with MSB
📌 USUALUSDT: Buyers Are Active + %70 Profit in Total
🌟 FORTHUSDT: Sniper Entry +%26 Reaction
🐳 QKCUSDT: Sniper Entry +%57 Reaction
📊 BTC.D: Retest of Key Area Highly Likely
📊 XNOUSDT %80 Reaction with a Simple Blue Box!
📊 BELUSDT Amazing %120 Reaction!
📊 Simple Red Box, Extraordinary Results
I stopped adding to the list because it's kinda tiring to add 5-10 charts in every move but you can check my profile and see that it goes on..
