NASDAQ PLAN FOR TODAYThis is what I am looking at today, if it doesn't play out, I will look for another entry point.
Nasdaqlong

NASDAQ- LONGHere is my plan for the day, it's actually a redo because trading view didn't post my video earlier in the day.

NASDAQ 1D-TIMEFRAME ANALYSIS✨NASDAQ 1D-TIMEFRAME ANALYSIS✨
Hello ladies and gentlemen
This is my new idea for the NASDAQ
My idea is that the index will go higher
Target
13000
I hope my idea is clear
Support me by like and share
Good luck💰💯

Nasdaq LONG off supply zone, TECH DOWNGRADE BY GS?We saw that the tech market as a whole was downgraded by GS this morning. The big bank and financial institution recalled the over valuation of the tech sector as a whole, being the Nasdaq 100 essentially. Due to the massive TECH weighing on the index. Goldman Sachs downgraded the forecast and instead said money should been seen a return to value soon. Which by their standards is banking stocks (financials) and the automotive sector.
Nasdaq demand zone was at 11,750-11,800 where the 50-day EMA was holding out. We saw a fight at that area and finally the bulls took over. It seems that tech wants one last push to the upside before giving up its gains. Big tech is now up 37% year to date while S&P 500 banking sector is down 35% YTD.
It seems that as long as buying is happening money will flow into big Tech for the gains, even though there are downgrades on a lot of big tech. We are in for at least an attempt back to 12,130 before making any rash decisions, should we break that top then we're going to see a lot of buying come in and through the tops we go.
We are so close to an ATH it seems almost certain we'll see it before the election. Keeping in mind this market is extremely sensitive the smallest amount of bad news could send us rocketing lower. Tech downgrades have also been small, AMZN downgraded from $3,750 to $3,740.
There are bulls in this market, but 1 shot to an ATH seems a little harsh without a pullback in this economy.

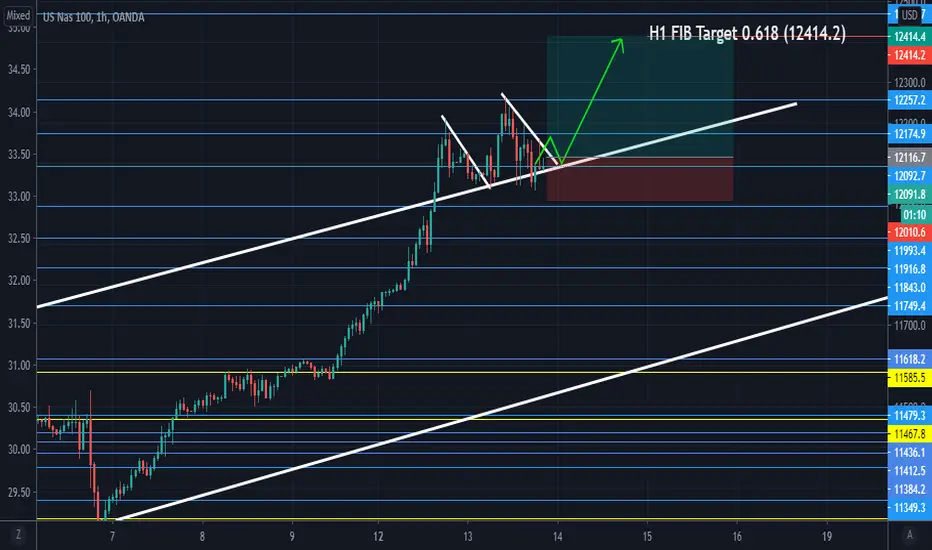
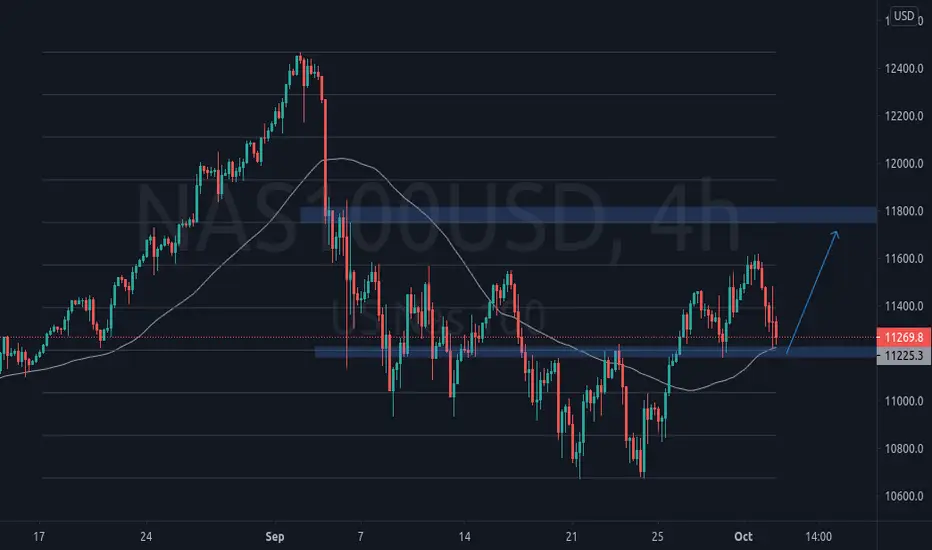
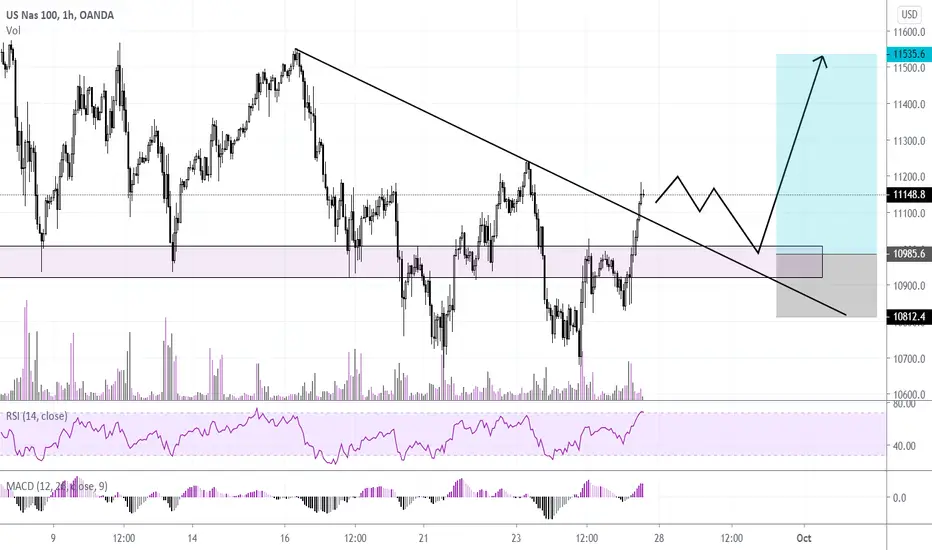
NASDAQ'S CHANNEL HELD STRUCTURE FOR LAST BULLISH PUSHThe recent bullish structure has held firm for the last bullish push before the potential sell off at Septembers highest high.
Market sentiments remain unsure on how to react towards the Apple IPhone 12 news amid the upcoming elections, recent talks around the stimulus package, and President Trumps conditions.
The market has seen a rapid climb since the opening this week, so todays uncertain direction was much needed to allow a stronger support for the final push towards NASDAQ's highest price ever recorded.
The Nasdaq Volatility Index VOLQ has moved in conjunction with the NASDAQ for the past 24 hours, which signals a potential drop in price, based on the findings of the relation between volatility indexes and the respective index. The VOLQ has a negative correlation of roughly 80% with the NASDAQ, so the exercised positive correlation of 20% causes this view, in addition to the findings.
Either way, I foresee a break and retest of the counter trendline and the final move to the H1 FIB target of 12414.2.
NASDAQ100 LONG SETUP (NASDAQ1OO BUY SIGNAL)VIDEO COMING TODAY!
NASDAQ is in my opinion, BACK ON AN UPTREND!
WWW.MILLENNIALTRADES.CO.ZA

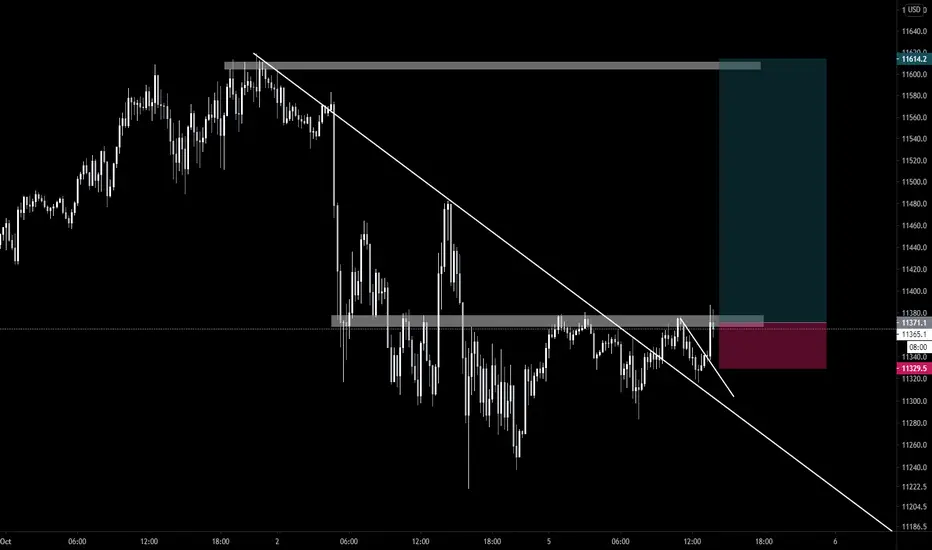
Nasda back to 11615I will be looking to Buy the Nasda as soon as M15 closes above resistance. Quite a quick setup but worth the risk.
NQ (NASDAQ) Expected Price ActonThis is my expected price action for NQ
Disclaimer: This is not financial or investment advice
Stay healthy, trade safe.
Atilla Yurtseven
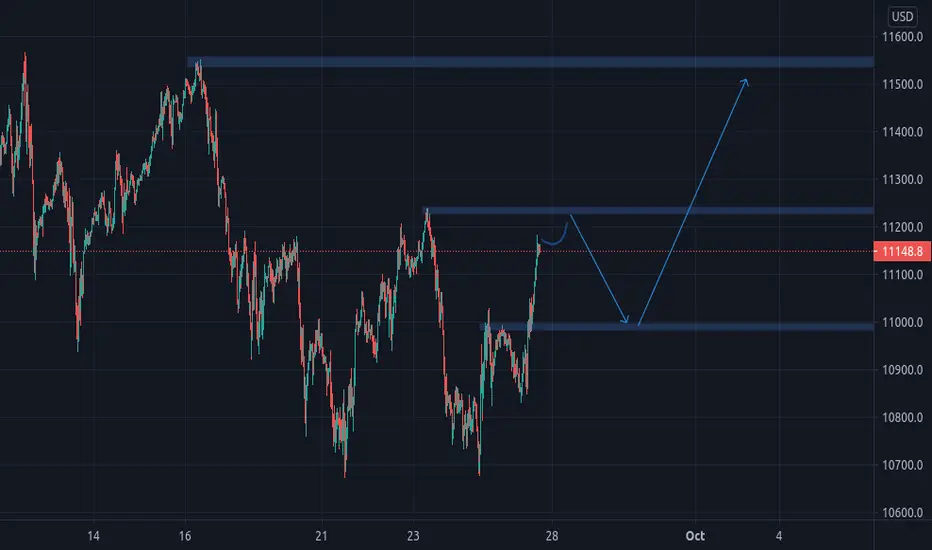
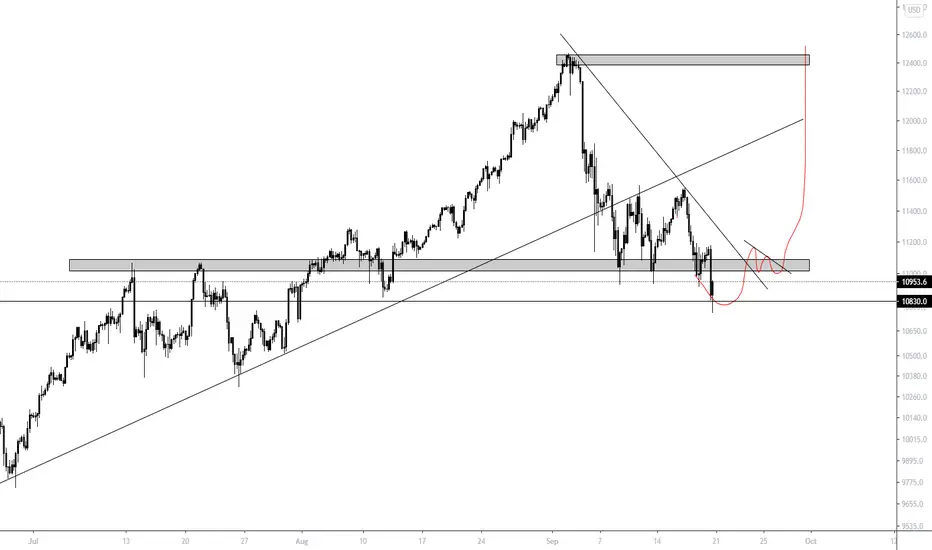
NASDAQ to fall more or recover now?Nasdaq broke previous support and made new lows. Will it recover from here? Will it make new lows? Will it completely crash out?
Well in any case, we would be looking to buy it all the way back to the ATH. Why? Because NASDAQ is in an Uptrend on the monthly and Stonks only goes up.
Personally, I'm waiting for a sellers trao to form, who will sell either at the retest of the trendline or the retest of the broken support. My entry will be after the corrective pattern is broken out as well. This will be a low risk high reward trade I'm not looking at missing any time soon.
NASDAQ- Plan for Monday 24th Aug 2020I am looking out for a breakout and a retest on different zones to either go long or short. Quite a long video in comparison to others, but I trust it's worth it. Remember if you follow my advice to enter a trade, you are on your own. God bless

NASDAQ100/US100 LONG daily daily breakdown for the overall bull we've been on. finding stable demand and long. don't get caught up in the daily' temporal reversal mania and shorting into demand. Shorting is advisable on a short term if price closes significantly lower than today' open.

NASDAQ- Made all time highs last week.I am expecting a retest to the highs of last week and a possible correction to 10300 and if that breaks, 10100. Nasdaq is still in an uptrend so be careful when going short during correction.

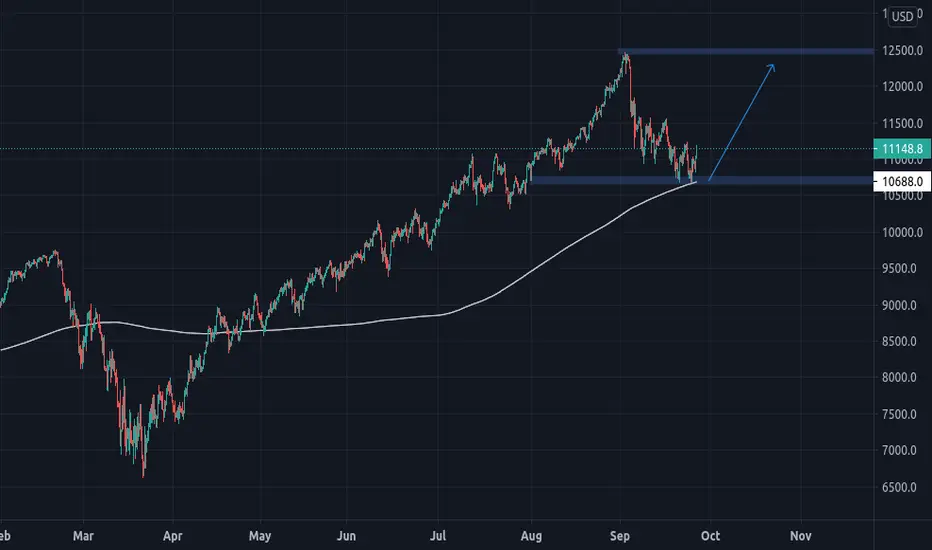
NASDAQ - Expecting 11,000 this week !Nasdaq is presently on all time highs and based on the charts, I see more gains for the bulls. Watch to see why !

Let's Chat About The NasdaqAre you wondering what is going on right now?
No problem we have you covered right here.
See my related NASDAQ ideas to see how we got here.
Please LIKE and FOLLOW to get notification of updates and future posts.

NASDAQ - Tracking Minor Waves - Long Trade UpdateTo be honest with you I have not looked at the trade until now when someone told me about a drop.
All this does is really make me think how far up this is going to go. I will update you shortly if the target has changed. This could be going a lot higher.
Looking at this now I just see a C Wave in an expanded Green Wave 2 correction. The trade remains in place.
Stop: 9508
Was this move designed to knock you out of the trade, probably.
Let's see what happens from here.
Please LIKE and FOLLOW to get notification of updates and future posts.

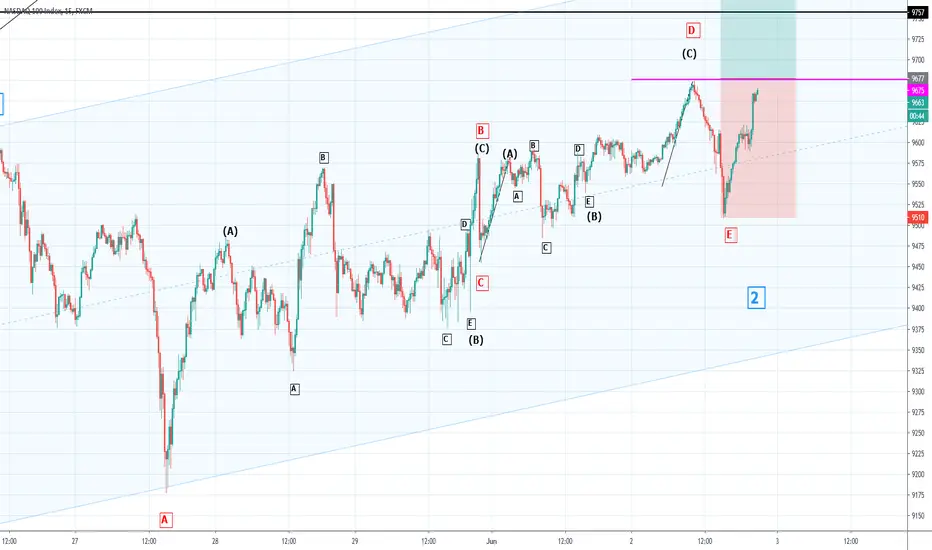
NASDAQ - Long Trade Setup - Wave E Looks About Done NowA break of the magenta line will confirm Red Wave E Done and Blue Wave 2 Done.
Entry: 9675
Stop: 9510
Target: 11146
Good Luck!
Please LIKE and FOLLOW to get notification of updates and future posts.
See related Ideas Below