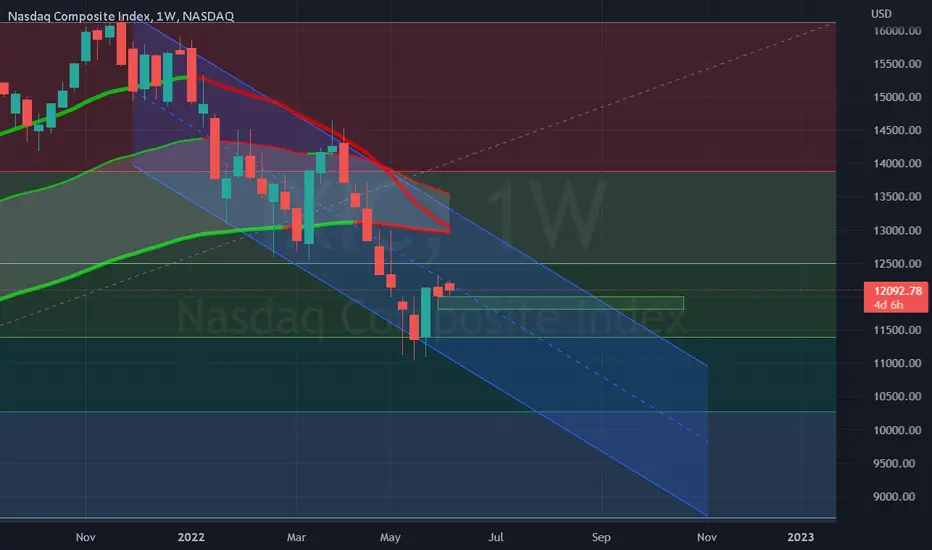
NASDAQ : IXIC is in Downward channel trying to break Middle LineNASDAQ previously took string support from 50% retracement level on Fibonacci channel.
Now, NASDAQ has been trading from last months in this Downward Parallel Channel and testing the Middle trendline of Channel.
If it manages to break this line with good volumes and a decent candle, then strong upside is expected to 12500 levels.
Strong Buy Zone is from 11800-12000 which doesn't seem to get broken in Near term.
Nasdaqlong
US100 - Long Ideahello again guys,
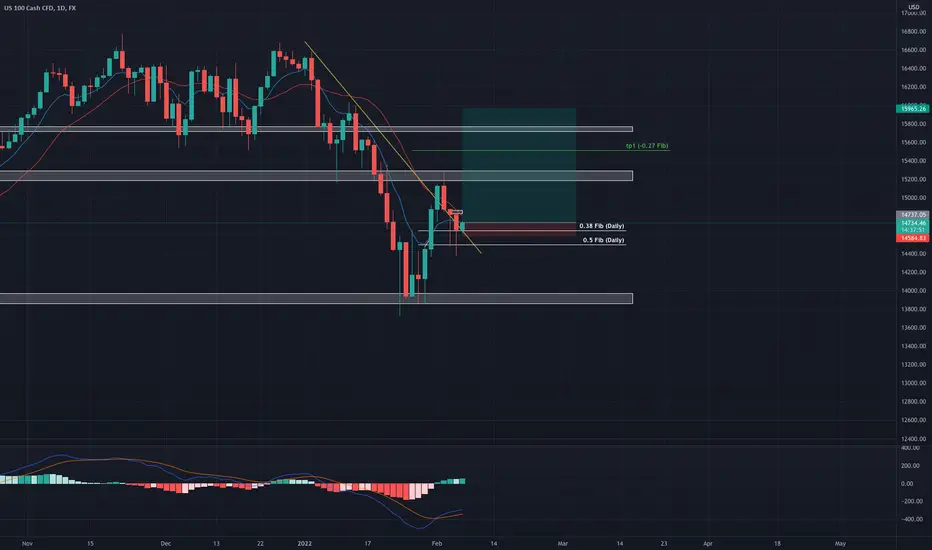
we were in a downtrend with US100 , but on Daily timeframe US100 break the counter trendline and on retest we can find a great buying opportunity as I marked in my analysis.
great Risk to Reward ratio I am waiting to dive in :) this is only for education purpose not any financial advice.

1 hour chart Nas 100 has breakout of the inner trendline. this may give opportunity for the bull to push up if bears are no-longer strong. we are yet to see because anything can happen in the market. This is my daily analysis.

Nasdaq Making Inverted Head&Shoulders , Long Setup With 500 PipsThis is an educational + analytic content that will teach why and how to enter a trade
Make sure you watch the price action closely in each analysis as this is a very important part of our method
Disclaimer : this analysis can change at anytime without notice and it is only for the purpose of assisting traders to make independent investments decisions

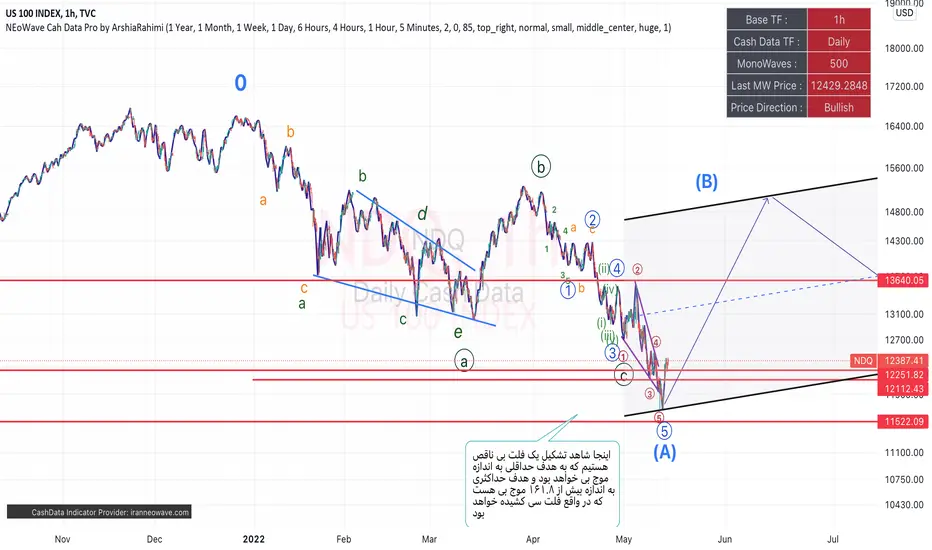
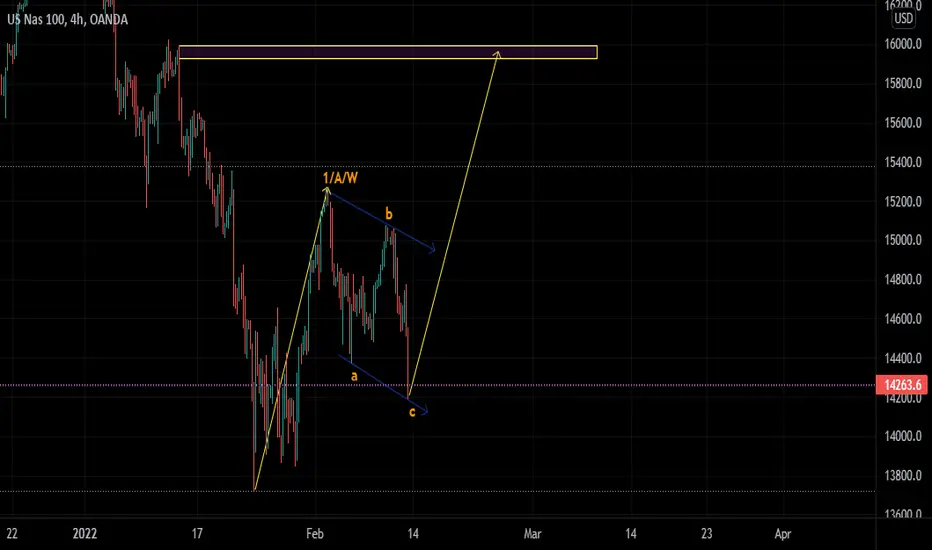
Crash is over !flat pattern is over on Friday and now it gonna make B branch triangle , After completing this branch, it will be clear exactly what kind of 18 types of triangles we are in and we can see where the exact target is.
But we can say that in the next 3 months we will be around the previous ceiling
NASDAQ - Possible Inverted Head and ShoulderWhat we are witnessing right now could be the possible start of second shoulder of the inverted head and shoulder pattern on NASDAQ. if the bounce is successful considering the Bullish engulfing on daily candle of the date 4-13-2022. We are possibly having a go ahead to start entering long on NASDAQ.
Targets in sight are:
15100 - Foundation resistance of the inverted head and shoulder
15900 - A possible minor support region
16500 - The last target as indicated by the base of the inverted head and shoulder pattern
You might wanna bail out below 13500
Best of luck, Happy Trading, Happier profits, Always ensure maximum risk management :)

Nasdaq: Recharging the Battery The massive increases in the past few weeks called for a short breather, and that’s why Nasdaq is taking a few days off to recharge its battery. For this purpose, it has been chilling in the green, which here is the green zone between 14579 and 14366 points. Currently, it seems like the Nasdaq is not quite sure about how long the short break should last but we are expecting that the index should complete its wave in turquoise and wave 4 in green in this area soon. Next, the Nasdaq should continue the overarching upward movement. The next step is to reach the resistance at 15269 points, which the index should pass by on its way to new all-time highs.

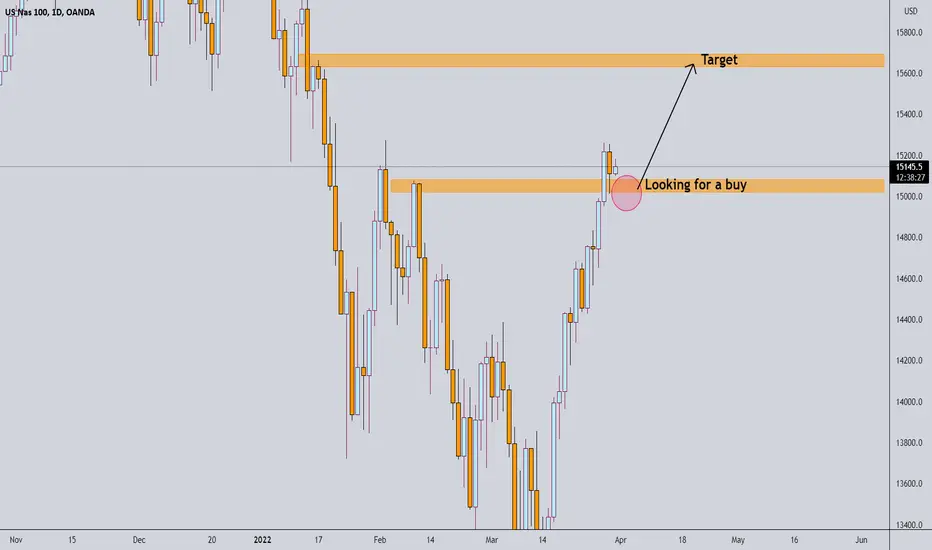
NASDAQ is looking for a buyNASDAQ break the structure and now looking for a buy to target 15600.
we have to manage risk, price can go into the opposite direction.
NAS100 30MIN Analysis - Continuation of long until $16000Hello Traders!
Nas100 Try Multi times to break resistance price at $14670, then going back to red zone support between $14400 - $14350
before that we have a strong support at $14450 - $14430 and that is the demand zone the price can't break it easily
I suppose for you to buying from this level and take profit at $15400 on the next days
do your research because The probability of what I analyzing, is to be true unless the opposite is proven, and the opposite here is to break $14400 - $14350 support level then SELL and take your profit at $13800 like you saw on the chart
Feel free dear trader to share with me your opinion, and also your analysis & Keep Watching
Have a nice trading

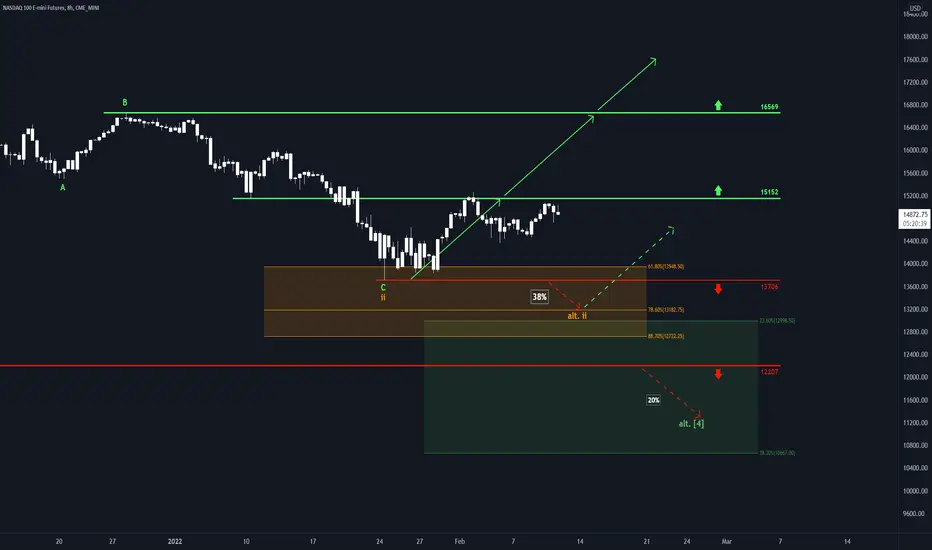
Nasdaq: Way to Go!Nasdaq seems to profit from spring fever if its upwards push is anything to go by. The tech index is putting its last low further and further behind, heading for the resistance at 15152 points. We expect it to cross this mark and to continue the ascent above the next resistance at 16569 points – if it can keep up the current momentum. However, if nasdaq can not sustain its motivation and drops below the support at 12942 points, our alternative scenario becomes more and more likely. There is even a 30% chance that the index could fall below 12722 points and deeper into the yellow zone between 12894 and 11698 points.

NASDAQ - US100 - LONG ideahello guys, in our last idea we have secured good profit, now I am posting this idea for your education purpose only targets are defined so we will look forward to it

NAS100USD LONG 03/09/2022NAS100USD has made a double bottom at the trendline support. I believe price will rally back up from here. This looks like a great buy to me!
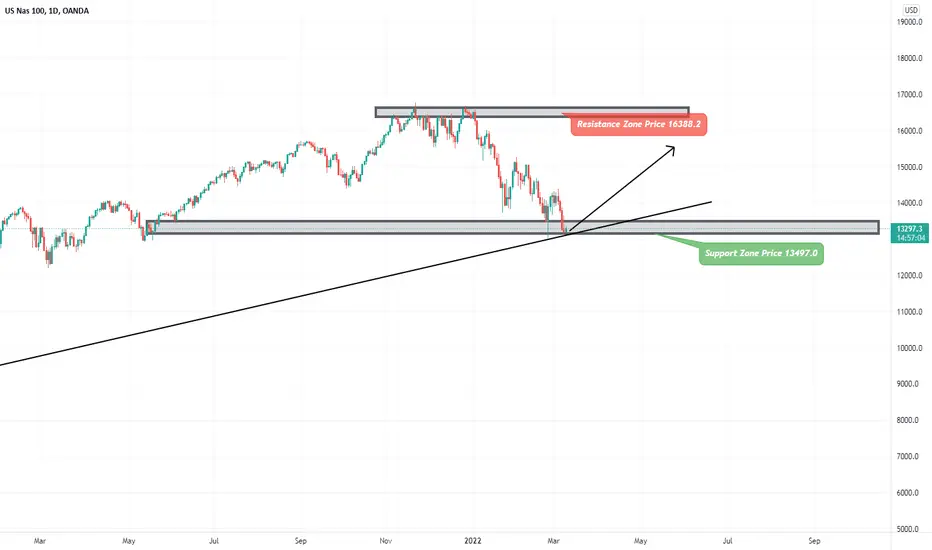
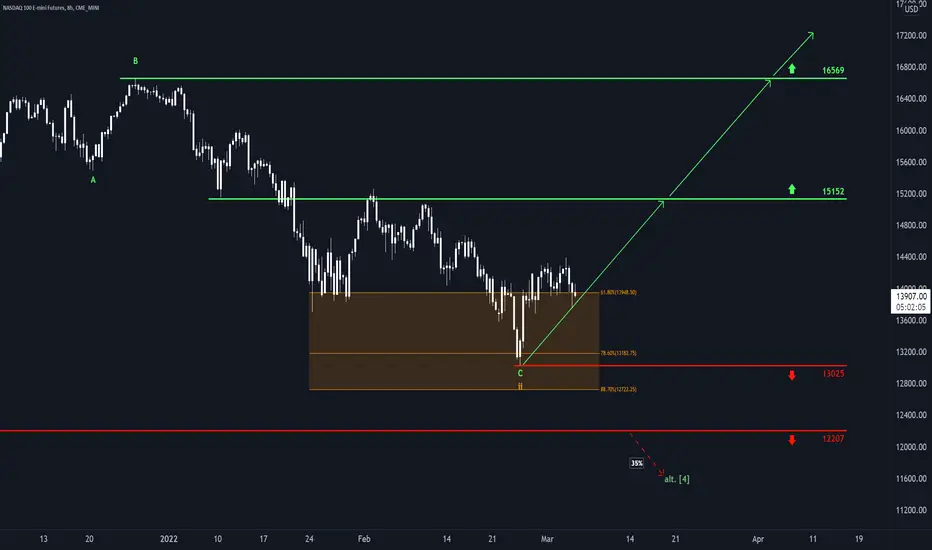
Nasdaq: First Florets Are Sprouting 🌱🌷Just in time for the start of spring, the nasdaq floret has sprouted upwards from the depths of the orange soil between 12722 and 13948 points and has broken through the crust. We expect it to thrive and prosper further and stretch its leaves up to the resistance at 15152 points. From there, it should have caught enough rays of sunlight to grow even above the next resistance at 16569 points.
However, there is still a 35% chance that nasdaq could wither prematurely and fall down below the support at 12207 points.
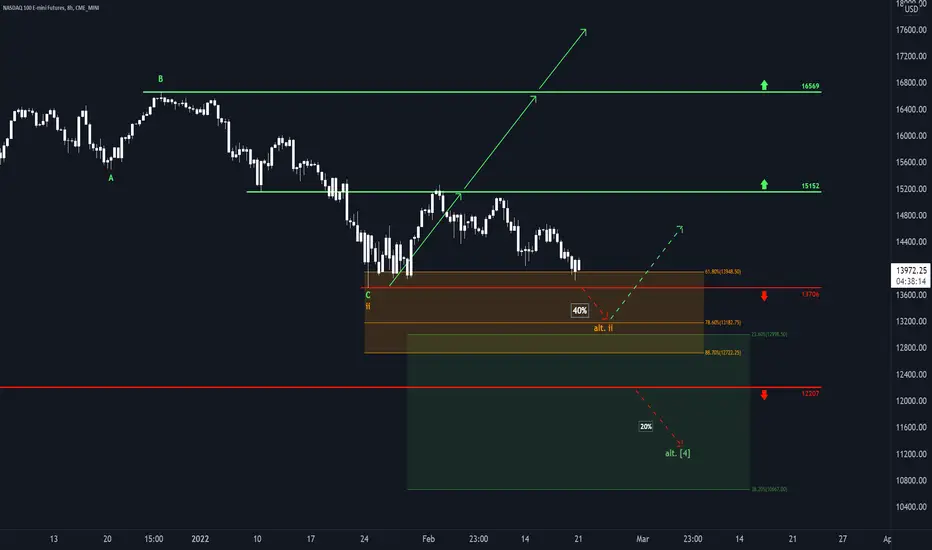
Nasdaq: In the tunnel 🐭Like a mouse, Nasdaq has been scurrying sideways though the tunnel between the resistance at 15152 points and the orange zone. However, we expect it to emerge from his burrow soon and to poke its nose above the resistance line at 15152 points. From there, it should scuttle upwards above the next resistance at 16569 points and further still.
There remains a 40% chance, though, that Nasdaq could behold a bird of prey and scramble back into the orange zone between 13948 and 12722 points. There, it should wait until about 13182 points before feeling save enough again to try to climb upwards for a second time. Still, there is a 20% chance that Nasdaq could simply be too frightened and thus seeks shelter in the green zone below 12207 points for some time.
NAS100 LONG Heloooooooooo PIPPIN TRADERS!!! I have another one. Is it ready to go back to 16k??? Let's wait and see.
Nasdaq: Snake Moves 🐍After it has risen from the upper edge of the orange zone between 12722 and 13948 points, Nasdaq is currently snaking along below the resistance line at 15152 points. However, it should soon surmount this mark and thus gain power for a continued upwards movement, which should lead the tech-index above 16569 points.
Still, as long as Nasdaq keeps up its snake moves and has not safely made it above 15152 points, there remains a 38% chance that the index could tumble below the support at 13706 points. In this case, it should fall a bit deeper into the lower half of the orange zone before rising up again. If the index drops even below 12207 points, there is a 20% chance for further downward movement.
Buy NasdaqLooking at the bigger timeframes (TF) Nasdaq looks like it broke the downtrend starting the movement to the upside.
Confluences:
1- MACD giving buys signals
2- Moving averages about to cross to the up side (4H)
3- Price is currently at 0.38 fib level (daily) which for me indicates the end of retracement.
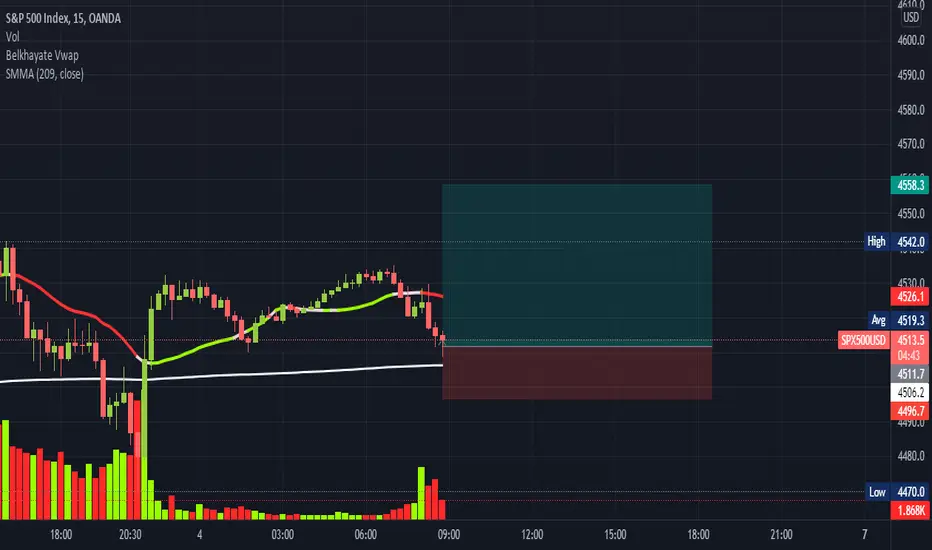
BUY SPX500Good morning Traders ! Today we woke up on a signal to Buy SPX500 and NASDAQ , for the SL and TP don't follow the one I place on the chart, place yours on your own. See you at the end of the day !
NAS100/NASDAQ100 Long position Beautiful consolidation ,break out retest pattern onto the 50-61.8% golden zone.
Good buying opportunity.

Nasdaq: Tap Dance Interlude 👞 👞 Nasdaq has been tap-dancing along the upper edge of the orange zone between 13948 and 12722 points and has just finished this interlude with two hops up in the direction of the resistance line at 15152 points. As long as it has not jumped above this line, though, we expect the tech-index to return into the orange zone to complete wave C in green – ideally just short of 13182 points. Afterward, the index-dance should lead to 15152 points and, if it can keep this trend up, further up to 16569 points.
However, if Nasdaq has gained too much drive already, there is a 25% chance that it could rise earlier without returning into the orange zone. In this case, it should also ascend to 15152 points and continue above 16569 points.
On the other hand, if Nasdaq has worn itself out with its dance moves, there is another quite different 25% chance that it could fall through the orange zone below 12207 points. In the green zone between 12998 and 10667 points at the latest, it should conclude the corrective movement.

NAS100If you look closely the reversal candlesticks on the H4 TF is confirmed and the momentum of the bulls are high. Potential bull setup..trade safe and be blessed..

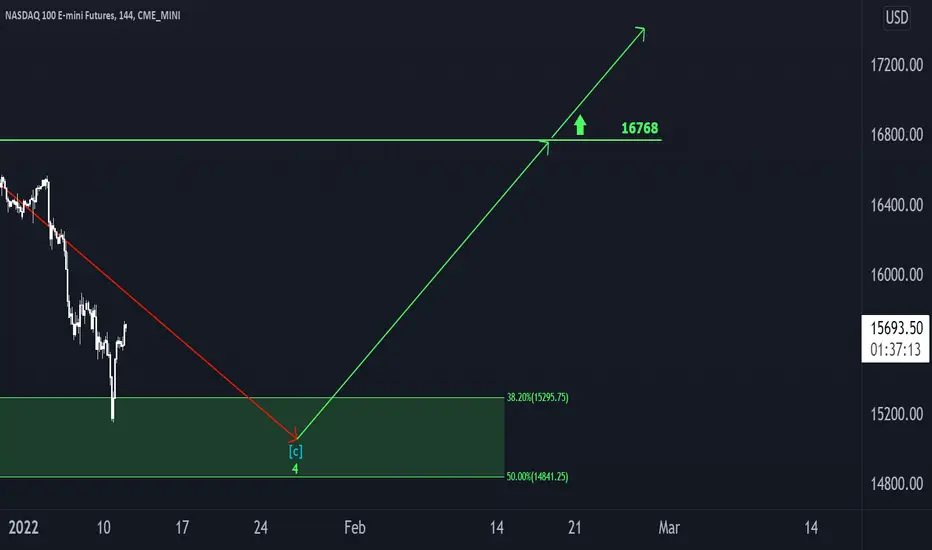
Nasdaq: Bravo! 👏 Give it up for Nasdaq! So far, he has been very well-behaved and has hewn to our forecast. He has let go and fell into the soft green meadow between 15295 and 14841 points. Among this lush pasture, it should finish wave 4 in lime-green and make use of the renewed updraft. We expect the index to turn around before touching the bottom of the green area and to float up to the resistance at 16768 points, from where even higher goals will become more and more possible.

Nasdaq: Southward Ho, Techies! 🤓After it has been heading for it for a while now, we expect the tech-index to dip into the green area between 14841 and 15295 points. There, it should finish wave in blue and the superordinate wave 4 in green respectively. Then, the index should be ready to rise again, aiming for the resistance at 16768 points and further still.