NASDAQ-NXPI: Is the Market on the Verge of a Reversal?A Critical Juncture: What’s Next for NASDAQ-NXPI?
The semiconductor sector has been riding a wave of volatility, and NASDAQ-NXPI is no exception. The stock currently trades at $208.55, reflecting a 29.56% decline from its all-time high of $296.08 recorded in mid-2024. With a downward deviation of nearly 30%, the market is now questioning whether this is a buying opportunity or the precursor to another leg down.
Technicals reveal a battle between bulls and bears. The 50-day moving average sits at $212.72, hovering just above the current price, indicating a near-term resistance zone. Meanwhile, RSI (Relative Strength Index) at 39.35 suggests the stock is creeping into oversold territory, yet not signaling a definitive reversal. Furthermore, sell volumes have surged, forming multiple bearish candle patterns, reinforcing the short-term downside risk.
Adding to the complexity, macroeconomic pressures, including a strong U.S. dollar and shifting interest rate expectations, have kept buyers cautious. But with powerful support levels at $206.34 and $198.82, is this a crucial inflection point?
The Big Question: Reversal or Continuation?
With a resistance ceiling at $211.02, the next move could define NXPI’s short-term fate. A break above this level could trigger a bullish surge, but failure to hold above $206.34 may invite another wave of selling.
Will buyers step in at this critical moment, or are we in for another leg downward? The answer may shape the next major move in NXPI. Stay alert.
NASDAQ-NXPI Roadmap: Tracking the Market’s Footsteps
January 14 – Buy Volumes Max (Confirmed Bullish Signal)
The first major signal of a buy-side push emerged on January 14, with an increased buy volume pattern at $208.88. The price closed higher at $210.53, setting the stage for a continuation. The key takeaway? Buyers were stepping in, and the momentum was shifting.
January 15 – Sell Volumes Max (Bearish Reversal Signal Fails)
Just a day later, sell-side pressure increased, marking a potential reversal with a closing price of $213.49. However, instead of following through, the market did not sustain the downward movement, negating this sell signal. The previous buy volume pattern held firm, proving bulls were still in control.
January 17 – VSA Buy Pattern 3 (Confirmed Bullish Trend)
The market locked in another bullish confirmation as the VSA manipulation buy pattern formed at $214.45, closing higher at $214.61. With strong buying activity in place, the stock continued its ascent, respecting the trendline and validating the prior bullish signals.
January 21 – Sell Volumes Max (Bearish Confirmation)
The first true bearish confirmation materialized as the price turned south, closing at $214.78 after opening at $215.26. This drop signaled a shift in sentiment and tested the conviction of the bulls. With further confirmation needed, all eyes turned to the next move.
January 22 – Sell Volumes (Bearish Momentum Builds)
With a lower close at $215.98, sellers began solidifying control. The sequence of declining closes and increased sell volumes confirmed the downtrend was gaining steam.
January 23 – Buy Volumes Take Over (Reversal in Motion)
Just as the bears looked ready to dominate, buyers stepped back in, driving the close to $219.89. This strong shift nullified the previous bearish sequence and set the stage for a fresh upward move.
January 24 – Buy Volumes Max (Confirmed Bullish)
Momentum followed through with a close at $213.44, reinforcing that buying interest was sustained. The roadmap now pointed to another attempt to test higher resistance levels.
January 27 – Increased Buy Volumes (Final Bullish Confirmation)
The price surged to $215.2, cementing the overall bullish bias established throughout the roadmap. The earlier bearish dips proved to be shakeouts, and those who stayed in line with the buy-side confirmations saw the real move unfold in their favor.
This roadmap clearly showcases how bullish and bearish patterns played out, giving traders and investors a structured way to read the market’s evolution. Will the next setup follow the same rhythm, or is a fresh shakeout coming? Stay alert.
Technical & Price Action Analysis
Support Levels:
206.34 – local buyer zone; if broken, expect further downside
198.82 – critical level for bulls; a break here could trigger a move to 192
192.375 – last potential hold for buyers; below this, free fall territory
Resistance Levels:
211.02 – immediate resistance; needs a solid breakout for upside continuation
222.00 – key level to watch; if bulls take control, momentum could accelerate
234.955 – major resistance; breakout here would shift the structure bullish
Powerful Support Levels:
224.26 – a strong demand zone; if lost, could flip into heavy resistance
Powerful Resistance Levels:
200.00 – psychological barrier; flipping above this would be a strong bullish sign
175.00 – long-term level; failure to reclaim may keep sellers in control
149.90 – structural pivot; reclaiming this zone would confirm trend reversal
If any of these levels fail to hold, they will act as new resistance zones, and the price will likely revisit them before making the next move. Watch for fakeouts and liquidity grabs before committing to a trade. 🚨
Trading Strategies Based on Rays
Concept of Rays
My proprietary analysis method is built on Fibonacci-based rays, dynamically adjusting to market movement. These rays create predictive zones where price interactions suggest either continuation or reversal. Importantly, entry positions are taken only after price interacts with a ray and initiates movement. Each move extends from one ray to the next, setting up structured trade targets.
Dynamic Factors in Play
Moving Averages: MA50 at $212.72, MA100 at $214.16, and MA200 at $212.76 serve as dynamic resistance/support levels. Their intersection with key rays amplifies probability zones.
VSA Rays: These pre-defined market structures align with volume-driven price shifts, making them highly reactive points for execution.
Optimistic Scenario (Bullish Continuation)
Entry: Break and close above $211.02 after ray interaction.
First Target: $222.00 – Key resistance; first profit zone.
Second Target: $234.955 – Breakout continuation level.
Third Target: $247.67 – Long-term bullish extension.
Pessimistic Scenario (Bearish Breakdown)
Entry: Rejection from $211.02 or breakdown below $206.34.
First Target: $198.82 – Major support test.
Second Target: $192.375 – Strong demand zone.
Third Target: $175.00 – Structural breakdown zone.
Trade Opportunities Based on Rays
Momentum Breakout Trade: Long on a break above $211.02, targeting $222.00.
Reversal Trade: Short after a rejection from $211.02, aiming for $206.34.
Pullback Entry: Buy from $206.34 if it holds as support, riding to $211.02.
Breakdown Trade: Short if $206.34 fails, targeting $198.82 first.
Range Scalping: Buying dips at $206.34, selling resistance at $211.02 until a breakout.
These setups provide both aggressive and conservative trading approaches. Every trade moves from ray to ray, setting up the next logical price step.
What’s Next? Let’s Discuss!
Trading is all about understanding key levels and making decisions at the right moment—that’s exactly what my ray-based strategy helps with. If this breakdown made sense to you, drop a comment with your thoughts or questions—I always reply!
Don’t forget to hit Boost and save this idea so you can check back later and see how price moves along my levels. Tracking the market in real-time is the best way to sharpen your trading edge!
By the way, all the rays and levels are automatically mapped by my private indicator. If you’re interested in using it, send me a direct message—I’ll explain how it works.
Looking for custom analysis on another asset? I can do that too! Some ideas I share publicly, others—privately on request. If there’s a ticker you want mapped out, Boost this post and let me know in the comments!
And if you find my insights valuable, make sure to follow me here on TradingView—this is where all my best work gets posted first. Let’s trade smart! 🚀
Nasdaqshort

NASDAQ100After a strong sell offs, nasdaq100 seems not done falling yet, it looks like it has found resistance, remember to use proper risk management. Lets download success.
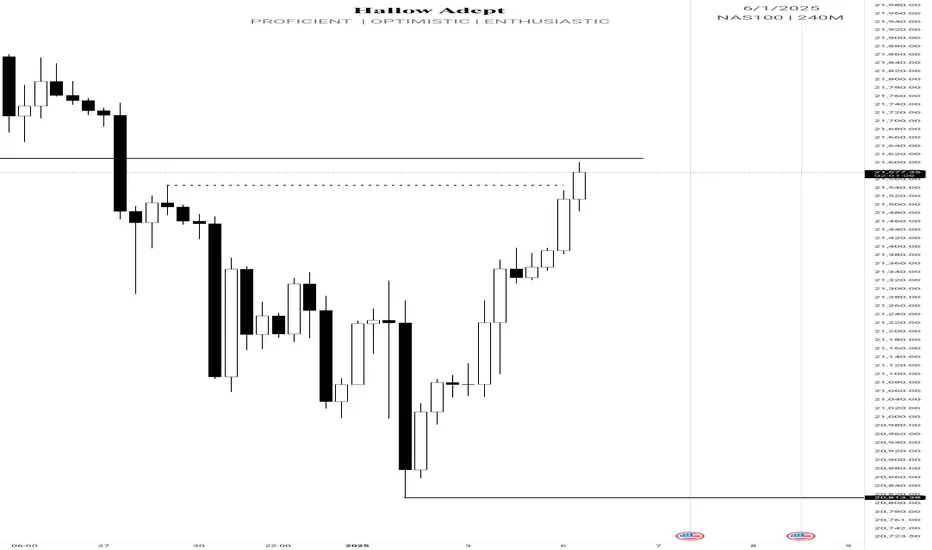
Buy or Sell? Read the caption. I told you...Hello guys
We came with NAS100 analysis.
Due to the heavy selling that has happened now, we need to maintain the defined twin bottom range to maintain the upward trend.
Otherwise, the drop will continue up to the specified limits.
Now, if the price is supported, you can see its growth up to the specified areas.
*Trade safely with us*
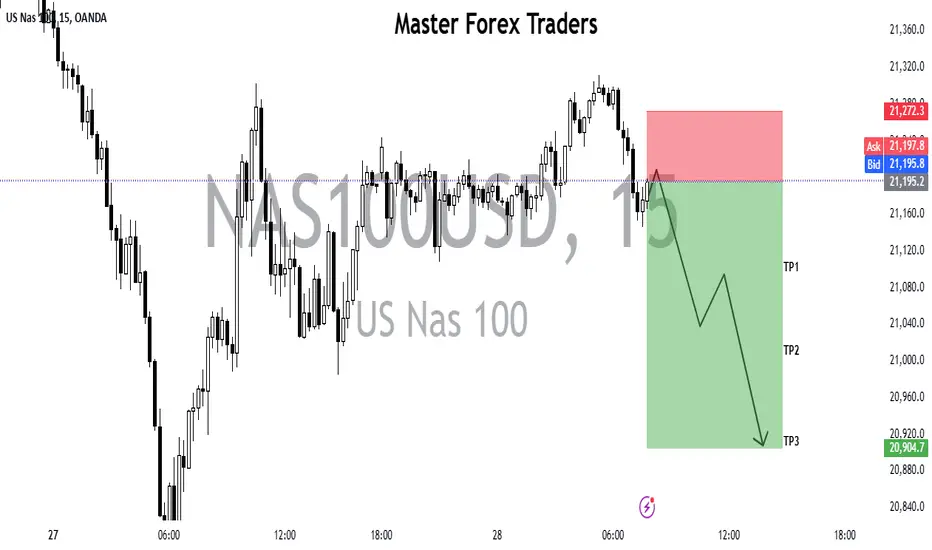
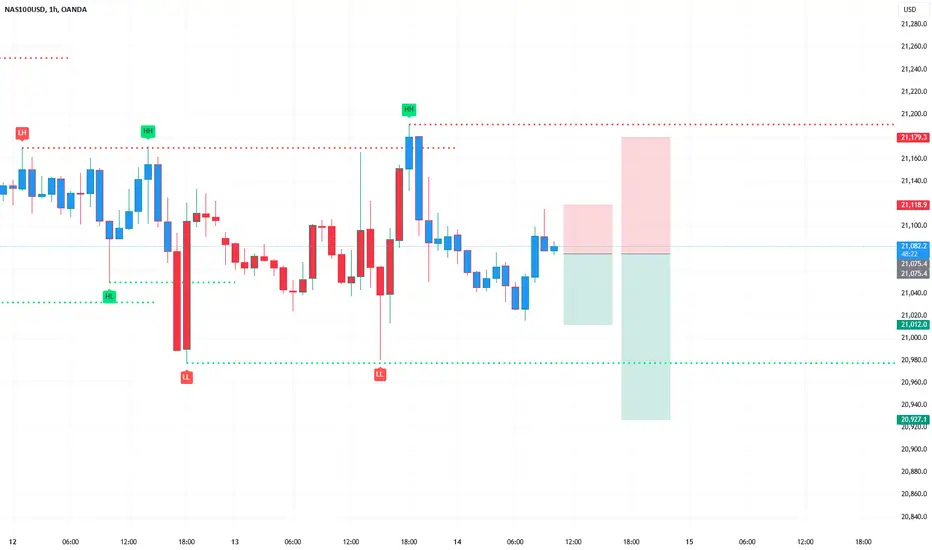
Nasdaq trading insights: 24-Jan-2025Nasdaq trading insights: Not signals, but informative zones to aid your decision-making. Please note: These zones are not trading advice. Use them as a starting point for your own analysis.

US100 Trade LogUS100 has reached the daily FVG , providing a short setup at the 0.5 level with at least "1:2 RRR" and 1% risk.
Any fill above the midpoint is ideal, aiming for a correction into the weekly Kijun .
Recent Fed hawkishness, softening global growth, and tightening liquidity support a downside move. Stops go just above the FVG high; ride the drop toward weekly support.

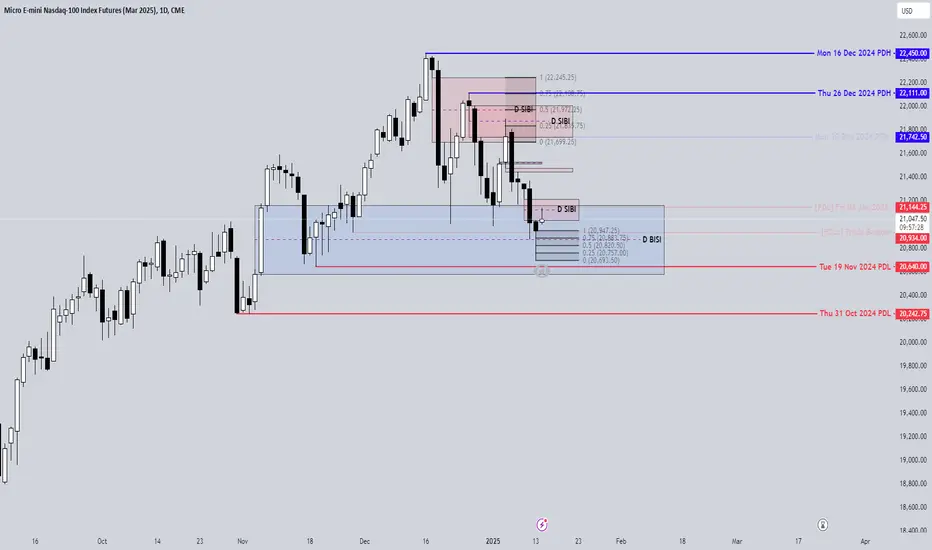
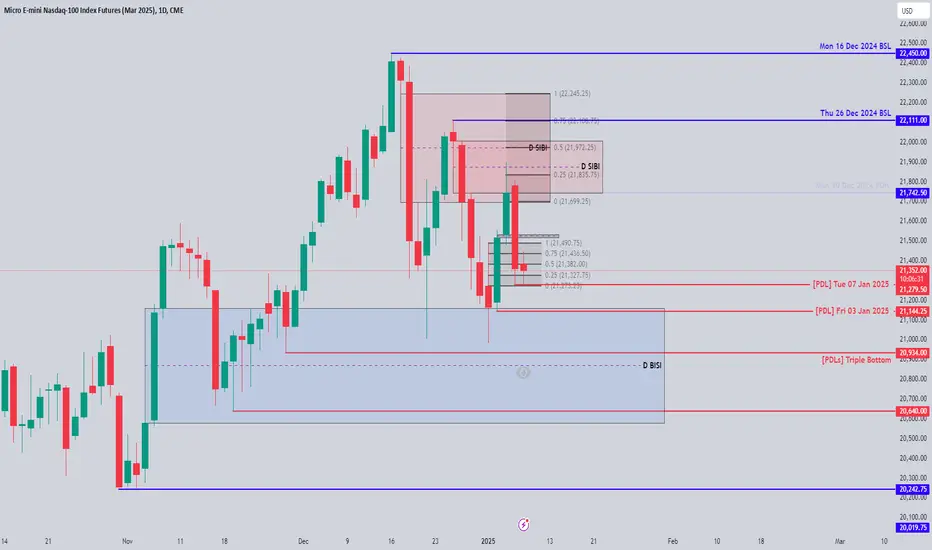
MNQ Continued Bearish Bias OutlookMy directional Bias for MNQ remains Bearish with the expectation on price to trade lower into the D BISI and take the SSL from the double bottom around 20640.00 I also like how price wicked the CE level of the D BISI that could indicate lower prices since price cant even make it through the inefficiencies 50% CE level. Now price may not make the move lower all the way and could just trade as low as the D Discount Wick 50% level which is also conveniently placed in CP to the D BISI CE level as well but lets see what price gives us.
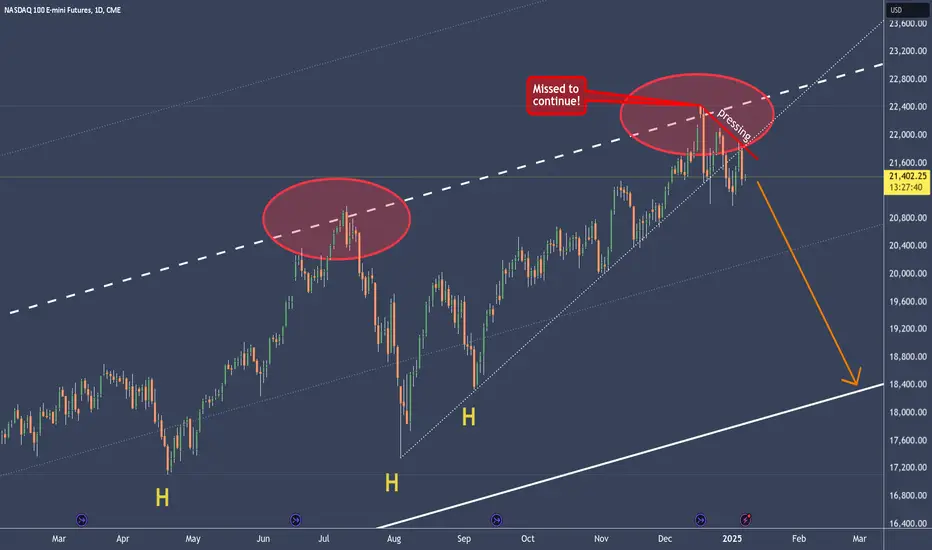
Nasdaq under pressure and aims for 18'400NQ is being pushed down, and a rebound doesn’t seem possible at the moment.
There are some fundamental factors supporting this weakness. However, as a chart analyst, I focus on the signals within the chart itself.
What I see is a possible target around 18,400, which aligns with the L-MLH.
With the weakness of the MAG7, the Nasdaq is unlikely to make further gains. The options are sideways or down. The latter is what I trade according to the rulebook.
Nasdaq analysis: 09-Jan-2025Good morning, everyone! Today's Nasdaq analysis is designed to educate and empower. Use these insights to refine your price action trading strategy.

HTF Directional Bias for MNQ
I have a Bearish Bias in play before the 07:00 Pre Session aiming to reach for the Fri 03 Jan 2025 at 21,144.25 and price could come as low as the 20,934.00 level which has the clean triple bottom SSL.
The reason why I am Bearish is because price has made a recent rally into the D SIBI and found rejection at the 50% CE level on Mon 06 Jan 2025. Then on Tue 07 Jan 2025 price left that D SIBI to trade lower through the Volume Imbalance and into the discount wick of the candle from Thu 02 Jan 2025.
Since it is a very heavy news release I do expect it to make a nice move lower since there is a bunch of SSL resting below the PDL's and price could reach as low as the discount D BISI 50% CE level at 20,871.25
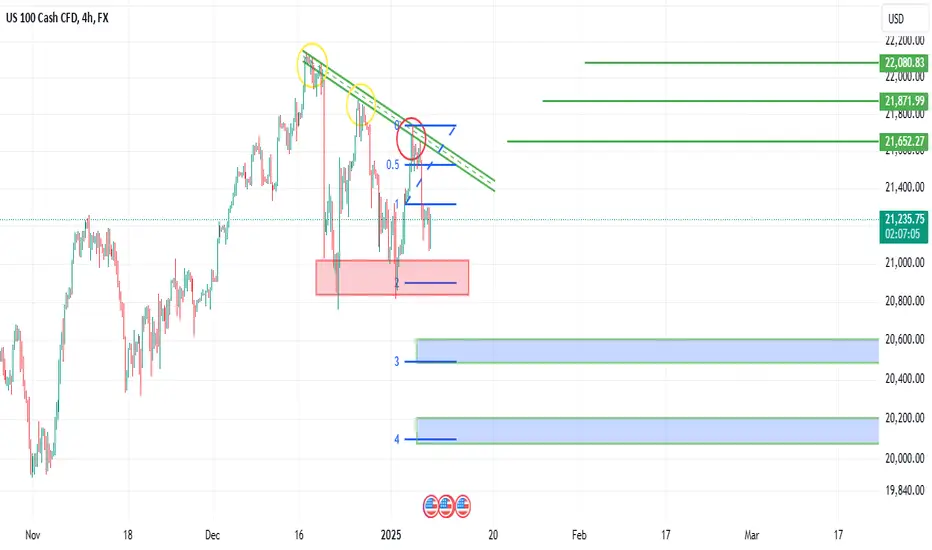
NASDAQ Nas100 Outlook I already anticipated the bullish movement to my zone since last week. Now I'm going to sell from 21610.60 down to last week low 20813.38 join me.
Watch out for more of my insights. And comments if you have different insights.
Ciao!
NAS100On NAS100 I am bearish for the longer term, currently I am waiting for price to reach my area of interes where I will be looking for selling opportunities. You will see there are two areas where i will be interested to look for selling opportunities. This is done based on my strategy on specific charts.
Remember, clear charts better vision.
NQ - Nasdaq? Read Tomorrows Wallstreet JournalIt hasn’t made any sense for a long time now how the markets keep climbing.
Manipulation? Self-perpetuation?
Honestly, who cares why. As the saying goes:
“The dwarves dug too deep. And what they unearthed was their doom.”
Or, in another version:
“The greedy vultures flew too high, and all they found was gravity.”
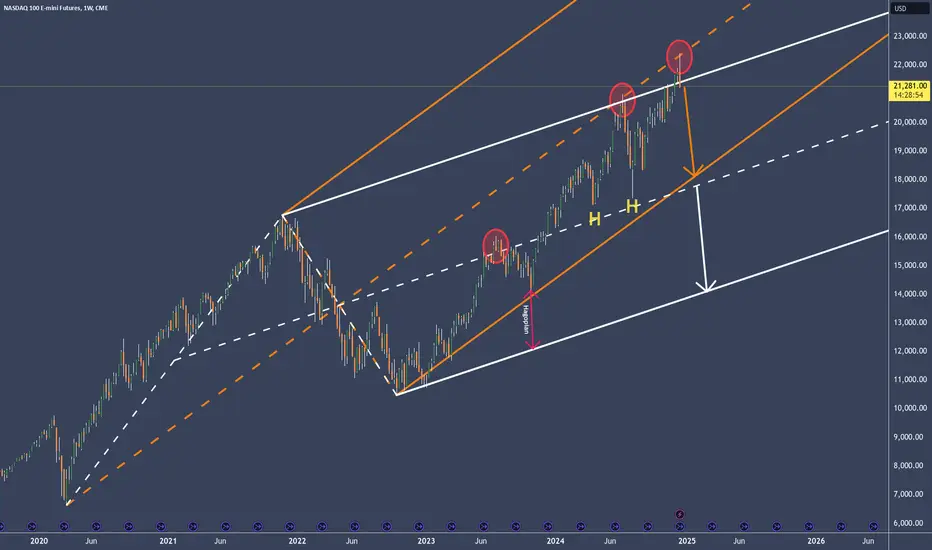
In the chart, we see two pitchforks:
The orange one highlights the actual overextension.
The white one represents the moderated version.
Interpreting this image is simple if you have a rulebook you can trust—and a few decades of market experience under your belt. §8-)
1. **The price turns at the orange centerline.**
This means the market is in "balance"—in the context of the overextension.
Or…
2. **Put differently:** In the context of the white pitchfork, the market overshot the upper median line parallel. This was an overextension by a factor of 2.
**What do we do with this?**
We stick to the rulebook for median lines.
The rulebook says that when the price trades above the U-MLH (upper median line parallel), fails to hold, and drops back into the fork, the market will fall to the next line.
- **Orange fork:** Down to the L-MLH (lower median line parallel).
- **White fork:** Down to the centerline.
Beyond that, I **think/guess/predict/read-tea-leaves** that the market will fall much deeper in 2025.
Please note the distinction here:
- The first statement is the projection—the interpretation of the chart.
- The latter is a speculation (no crystal ball involved).
For me, it’s clear: medium-term **short** with multiple price targets.
NQ making ATH and looking more and more Bearish by the dayJust some simple easy stuff anyone can do. Chart is pretty self explanatory, let me know if you have any questions.

Will Nasdaq plummet be a success?US100/ Nasdaq seems to be shorting, Sellers seem to be at a higher volume than the Buyers on this asset right now

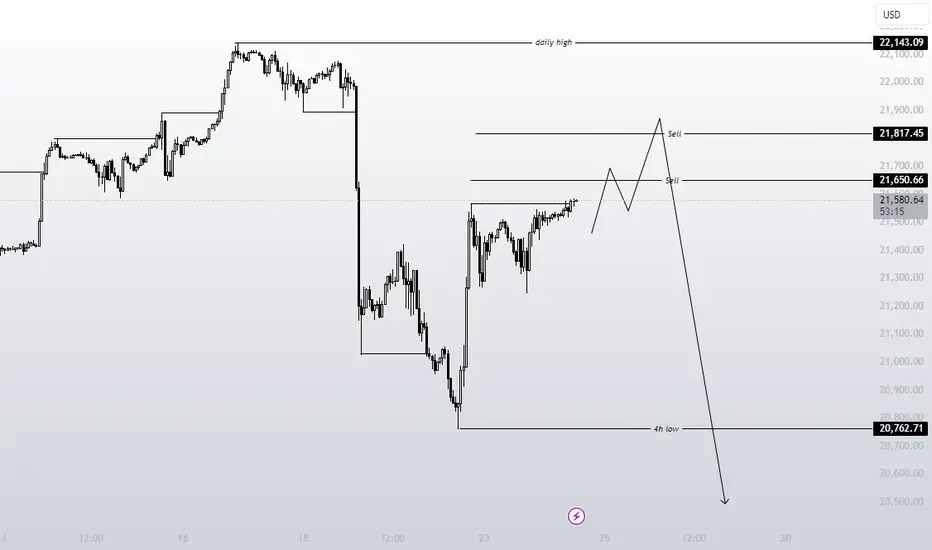
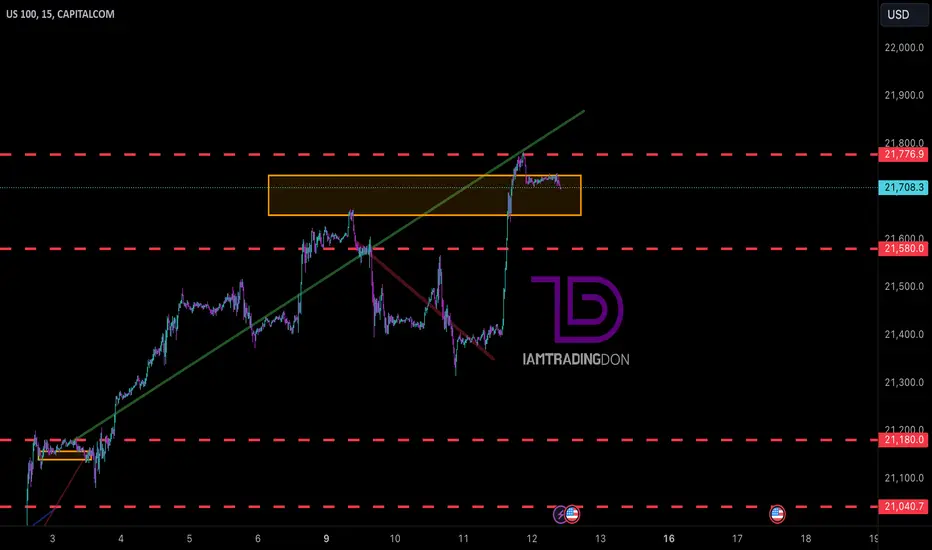
iamtradingdon | NAS100 Market Daily Technical AnalysisWhile NAS100 continues to display a bullish trend, I closely monitor indicators suggesting a likely bearish shift. The price has consistently encountered resistance at a Rejection Block, marking this area as a significant institutional resistance zone. If the price drops and a bearish candle closes below 21735, I will establish my target at 21580.
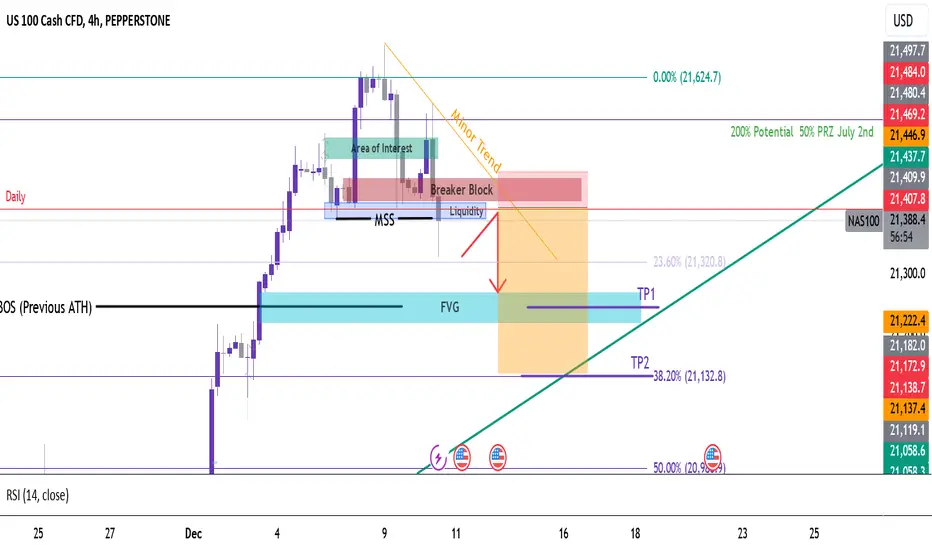
NAS 100 BREAKER BLOCK SHORT! With Price action giving us strong rejection wicks at our area of interest, breaking through the Swing low (Break & Retest set up), along with sweeping buy side liquidity formed at the Daily support level.
Price is poised for a pull back to the breaker block (Structure Low). If we receive a Bearish confirmation, once price reaches the Breaker Block. This would be a good and confident short entry. Watch your risk as we are still above the subjective Bullish Trend line
Take profit 1 at The FVG 21,245
Take profit 2 (Stretch Goal) is the 38.2 Fib retracement level.
* If we see a 38.2 retracement this should be a rejection off of the subjective "Bullish Trendline"
** Volume is giving us a great push down from the breaker block, Also just above TP2 is another area of great volume that could server as potential support.
Concepts used:
Structure
Volume
Price Action
Fibs
ICT
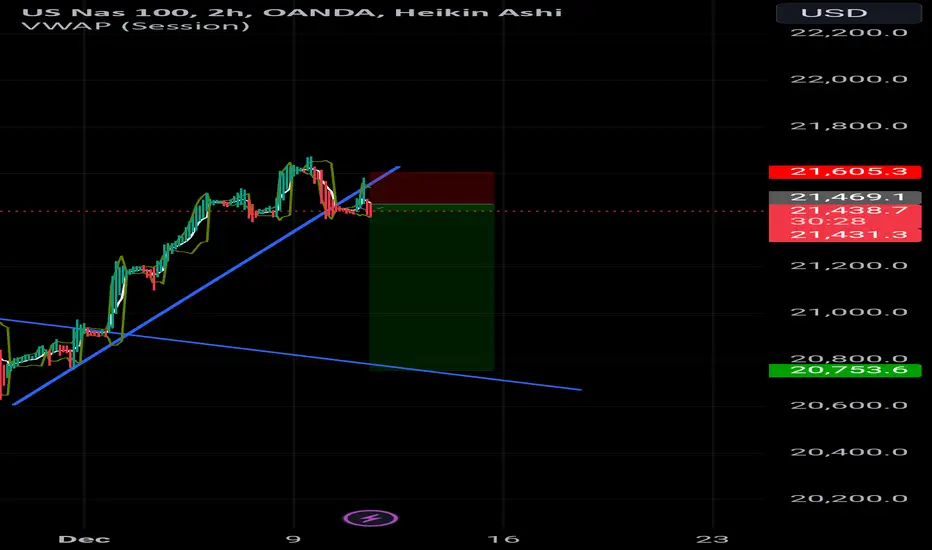
Sell setupTrendline break out.. Retested on the new support trendline for the downside.. Observe and trade safe be blessed
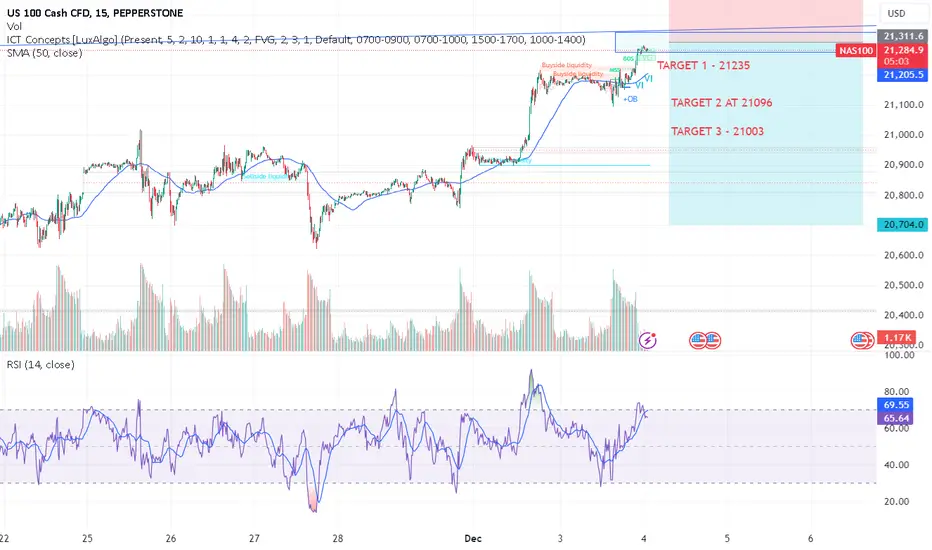
NAS100 - WE ARE LOOKING 3R-5RTeam, look at NAS100,
we would consider short at 21275-21300 ranges
STOP LOSS AT 21345 - can extend to 21360
Target 1 at 21235-47, take some partial and bring stop loss to BE
Target 2 at 21096-21112
target 3 at 21003-21018
we are looking for 3R-5R on this.
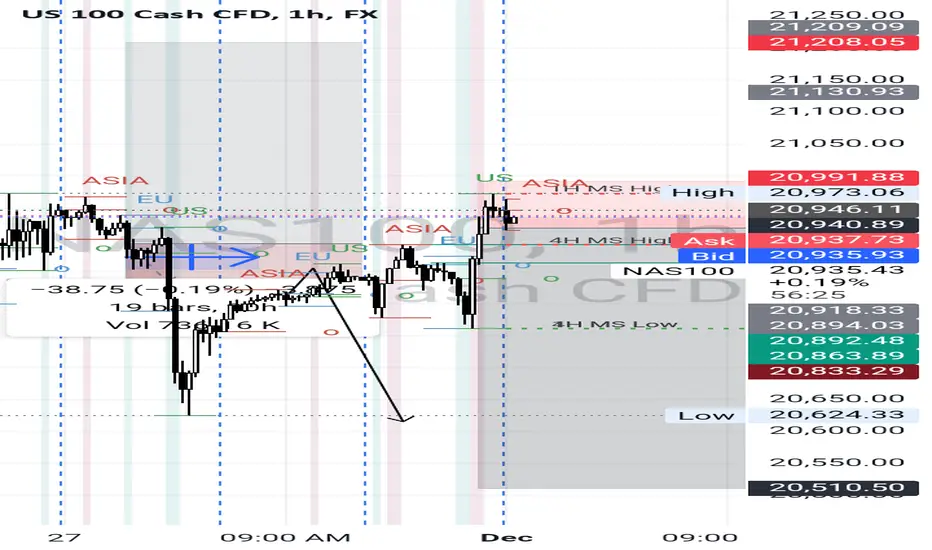
$NDQ shortsAfter Monday's peak @21026.5 and Wednesday's drop to 20624.8 and Friday's return to 20973 area is the market prepping for a major bear run within week 1 - 2 of December
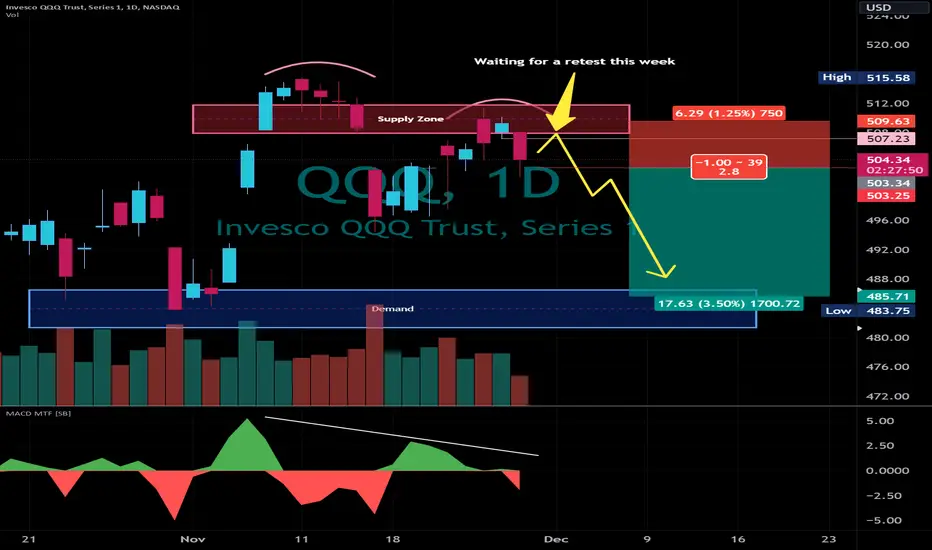
QQQ Market Structure Update, Short Setup👋Hello Traders,
Our 🖥️ AI system detected that there is a H4 or higher timeframe, a Short Setup in
QQQ for swing trade (a couple of days)
We are waiting for a retest with less buying power under the Supply Zone before Swing Short trade this week.
For more ideas, you are welcome to visit our profile in tradingview.
Have a good day!
Please give this post a like if you like this kind of simple idea, your feedback will bring our signal to next better level, thanks for support!
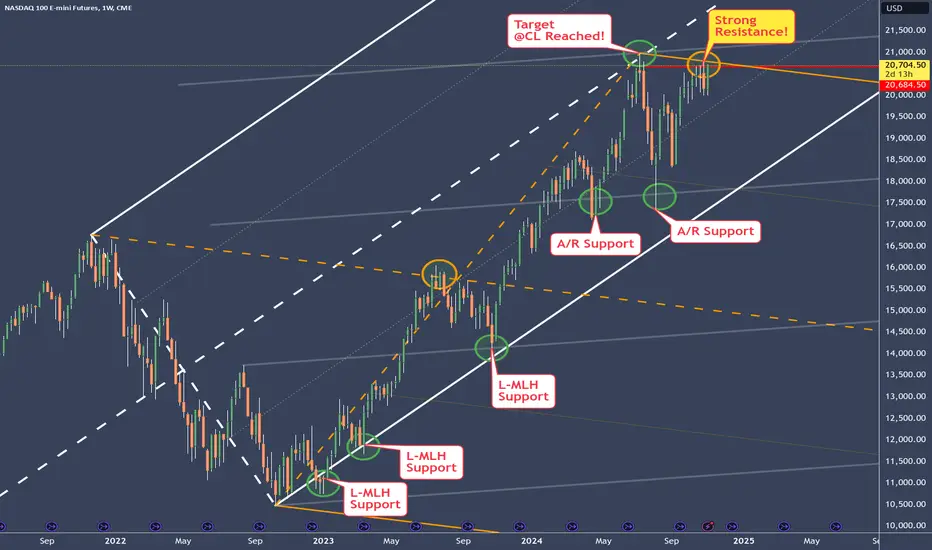
NQ - Nasdaq struggles. The weekly reveals itSee the support NQ had?
Super nice how the the Medianlines and the A/R set reveals it. But now there is some trouble in the Kitchen.
After reaching the white Center-Line, price is struggling to punch through the orange U-MLH.
If price can't fight ti's way through this resistance, it will turn south - probably very sharp.
To me, this is a cheap Short.
If I'm wrong, so be it, it's just one of 1000s of trades. But, it's a offer I can't reject §8-)
NQ DAILY BEARISHtill holding on to my Bearish bias but we are ranging on the 4HR TF expecting 10am Candle to take us lower with 5 minute confirimation
