"MDLZ Heist LIVE! Quick Profit Grab Before Reversal!"🚨 MONDELEZ HEIST ALERT: Bullish Loot Zone! (Swing/Day Trade Plan) 🚨
Thief Trading Strategy | High-Risk, High-Reward Play
🌟 Greetings, Market Pirates! 🌟
Hola! Oi! Bonjour! Hallo! Marhaba!
To all Money Makers & Strategic Robbers 🤑💸—this is your blueprint to plunder "MONDELEZ INTERNATIONAL, INC" with precision.
🔎 THIEF TRADING ANALYSIS (Technical + Fundamental)
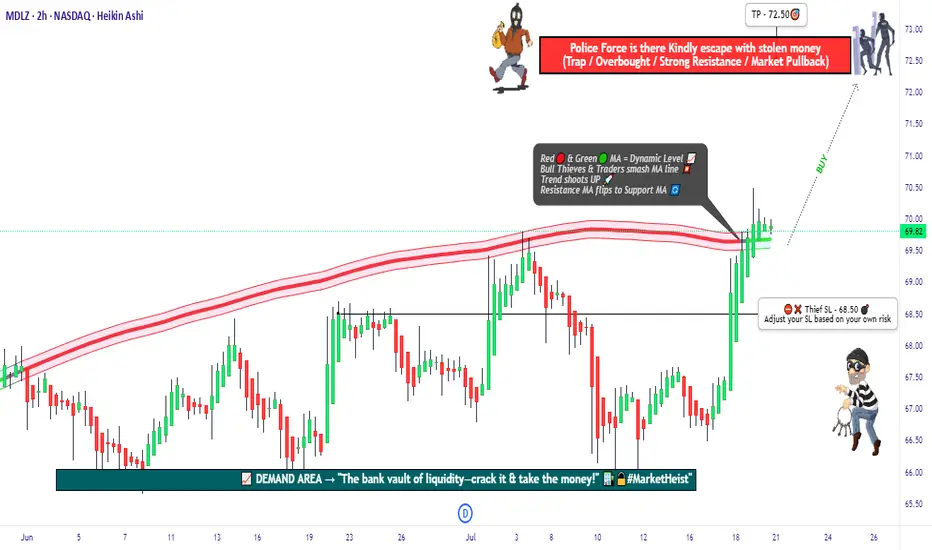
The Vault is Open! Bullish momentum detected, but caution—this is a high-risk police barricade zone (resistance level).
Overbought? Consolidation? Reversal? Yes. Bears lurk here, but we’re stealing profits before the trap snaps.
🎯 Target: 72.50 (or escape earlier if momentum fades).
🚨 Scalpers: Long-only! Use trailing stops to protect gains.
📈 ENTRY: How to Swipe the Loot
"Buy the Dip" Strategy: Optimal entries on pullbacks (15m/30m timeframe).
DCA/Layering Tactics: Spread limit orders for better risk control.
Aggressive Robbers: Enter now. Patient Thieves: Wait for retests.
🛑 STOP LOSS: Survival Rules
SL at 68.50 (nearest swing low wick on 2H chart).
Adjust based on risk/lot size—protect your capital!
⚡ CRITICAL ALERTS
📰 News Volatility: Avoid new trades during major releases. Lock profits with trailing stops!
📊 Fundamental Drivers: Check COT reports, macro trends, and sector sentiment Klick the 🔗.
⚠️ Reminder: This is NOT financial advice. DYOR and manage risk!
💥 BOOST THE HEIST!
Like 👍 + Boost 🔄 to fuel our next market robbery plan. Together, we trade smarter, steal bigger, and profit faster!
🚀 Stay tuned—more heists coming soon! 🤑🔥
Nasdaqstock
NASDAQ 100 TECH HEIST: Bullish Loot Before the Bear Trap!🚨 E-MINI NASDAQ 100 HEIST: Tech Rally or Bear Trap? (Thief Trading Blueprint) 🚨
🌟 Hola! Oi! Bonjour! Hallo! Salam! 🌟
Attention all Market Bandits & Tech Raiders! 🏴☠️💻💰
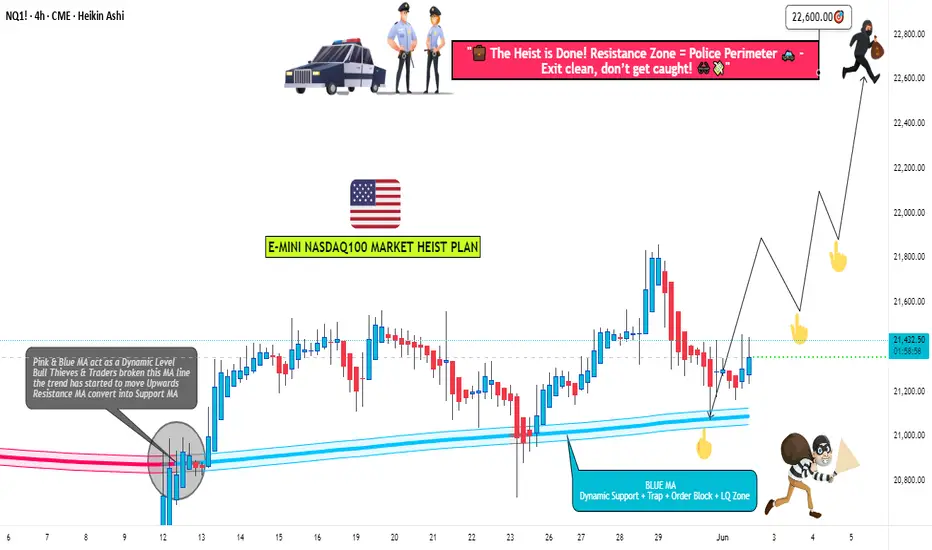
🔥 Thief Trading Intel: We're targeting the E-MINI NASDAQ 100 for a bullish loot grab! Long entry only—high-risk Red Zone ahead: overbought, consolidating, and primed for a reversal. Don’t let the bears ambush your profits!
"Claim your tech treasure and run—you’ve earned this steal!" 💰🚀
🚪 ENTRY: The Tech Vault is Open!
📈 "Swipe bullish loot at any price—the heist is LIVE!"
Buy Limit orders at recent swing lows/highs (15-30 min TF).
📌 Pro Thief Move: SET ALERTS! Don’t miss the breakout.
🛑 STOP LOSS: Escape Plan
📍 Thief SL (Smart Crew): Recent swing low (20,700.00, 4H TF).
📍 Adjust based on your risk, lot size, and orders.
🎯 TARGET: Loot & Exit!
🎯 22,600.00 (or bail early if the market flips!)
⚡ SCALPERS’ QUICK HIT
👀 Long scalps ONLY!
Deep pockets? Raid now.
Light wallet? Join swing traders.
Trailing SL = Your Profit Shield! 🛡️
📢 WHY THIS HEIST? (NASDAQ Bullish Momentum)
Tech rally brewing! Key drivers:
Fundamentals (COT, Macro, Geopolitics)
Sentiment & Intermarket Trends
Index-Specific Analysis & Positioning
🔗 Full intel? Bio linkss checkk! 👉🏻👉🏻👉🏻
⚠️ WARNING: News = Danger Zone! 📡🚨
Tech news moves FAST! Protect your loot:
❌ Avoid new trades during news.
🔒 Trailing SL = Lock profits.
💖 SUPPORT THE TECH HEIST CREW!
💥 SMASH THAT BOOST BUTTON! 💥
More boosts = bigger future heists!
Stronger crew = more $$$ for all!
Profit daily with Thief Trading Style! 📈🏆
Next tech raid coming soon—stay tuned! 🖥️🤑
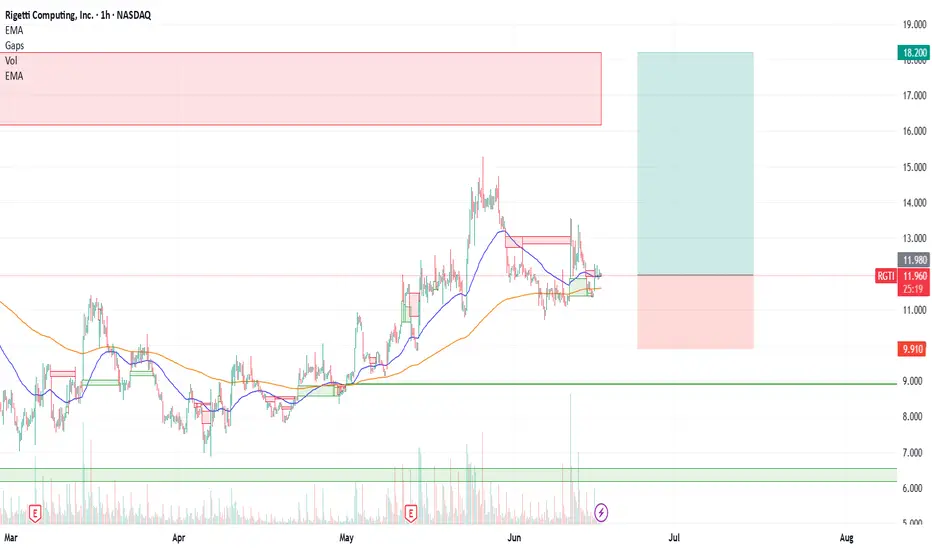
RGTI : First Long Position AreaNASDAQ listed Rigetti Computing Inc. stock is currently trading above the 50 and 200 period moving averages.
Once it gained momentum, it later lost it but its outlook is not weak at the moment.
Right now, if the Iran-Israel war uncertainty is overcome and if there is no bad news affecting the index, the gap may close.
Risk/Reward ratio of 3.00 is a very valuable ratio to try with small position amounts.
Risk/Reward Ratio : 3.00
Stop-Loss : 9.91
Take-Profit : 18.2
Regards.
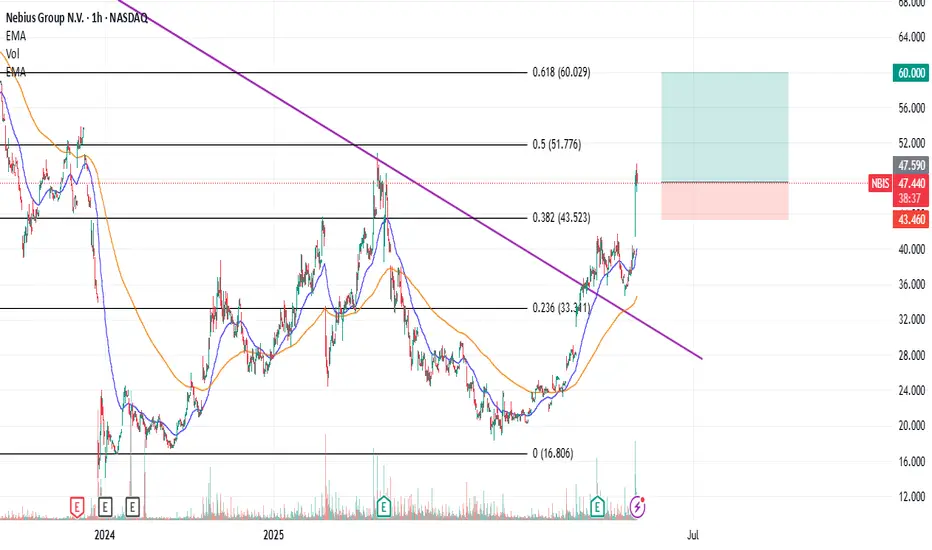
NBIS : Long worth TryingNebius group stocks are technically strong.
The downtrend since November 9, 2021 has been broken and the price is trading above the 50 and 200-period moving averages.
When we draw a medium-term Fibonacci level, we can take the take profit point at 0.618 and the stop-loss point at 0.382.
This gives us a Risk/Reward Ratio of 3.00.
A small position size is ideal.
Risk/Reward Ratio : 3.00
Stop-Loss : 43.46
Take-Profit : 60.00
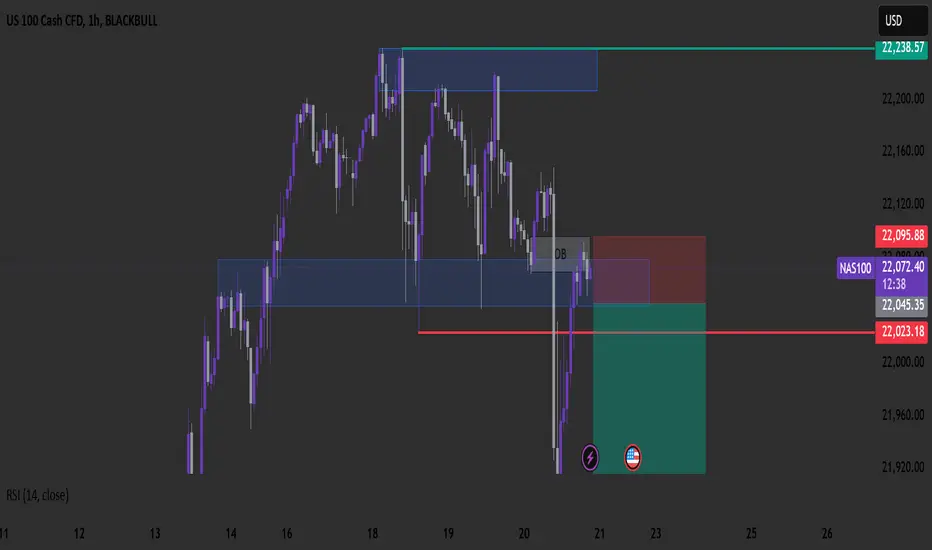
Possible push down for NAS100After A strong Bearish push, price action is filling the inefficiency left behind. Price is currently testing the structure lows previous support. The bearish move and retracement is the 78.6% PRZ
Wait for your lower time frame play to enter. This is an over all counter trend trade, however this could have a nice quick move down to retest the Daily previous structure high area of 21,843
Daily Chart has a Bearish Divergence that is playing out.
**Caution** on the macro bullish trend, this recent pull back retraced back to the 23.6 lvl with a wick while "retesting" the previous structure high on the H4 time frame....Enter with caution.
ENPHASE ENERGY (ENPH) Short Play: Bearish Momentum Building!Technical Analysis:
Enphase Energy (ENPH) on the 15-minute timeframe signals a solid short trade setup. The price is moving steadily below the Risological dotted trendline, showing sustained bearish pressure with room for the price to descend further.
Key Levels:
Entry: 78.13
Stop Loss (SL): 85.38
Target 1 (TP1): 69.18
Target 2 (TP2): 54.69
Target 3 (TP3): 40.20
Target 4 (TP4): 31.2
5
Observations:
The price is consolidating near the entry, showing potential to test the lower targets.
The Risological dotted trendline continues to act as overhead resistance, indicating a strong bearish outlook.
Enphase Energy is positioned for a potential decline with all targets set. Traders should watch for a breakdown below TP1 to confirm continued bearish momentum and aim for deeper targets!

NAS100 BUYSBuys on NAQ100 TP7800PIPS Watch Out On Monday Or Tuesday For a Fake Out But Keep looking out a Discount
KEEP SL BELOW 4H FVG
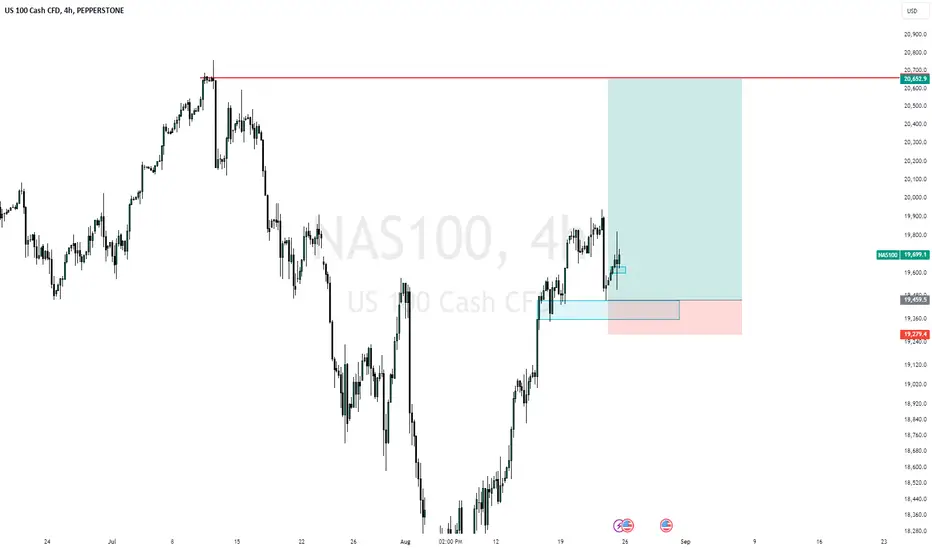
NASDAQ SHORT 1500+ pips (UPDATE....FLOATING 700+ PIPS IN PROFIT)Good evening gents so today has been EXCELLENT. My previous analysis that was posted on JULY 29th has gone perfectly. During NEW YORK session today at 16:00pm (south African time), market gave us a beautiful drop out of our POI DAILY SIBI....We are now currently running 700+ pips in profit! If you were one of the viewers to see my previous post, give me a heads up if you got in on this trade. COMMENTS ON THIS POST IS MUCH APPRECIATED.

Honeywell: Nearly There!Honeywell almost made it to the resistance at $210.61, which it should overcome as part of the current magenta wave (3). However, there is still a 32% chance that the price will pull back down into our magenta Target Zone between $188.24 and $180.93. This short-term bearish alternative scenario will be triggered if HON drops below the support at $189.66 before reaching a new high.

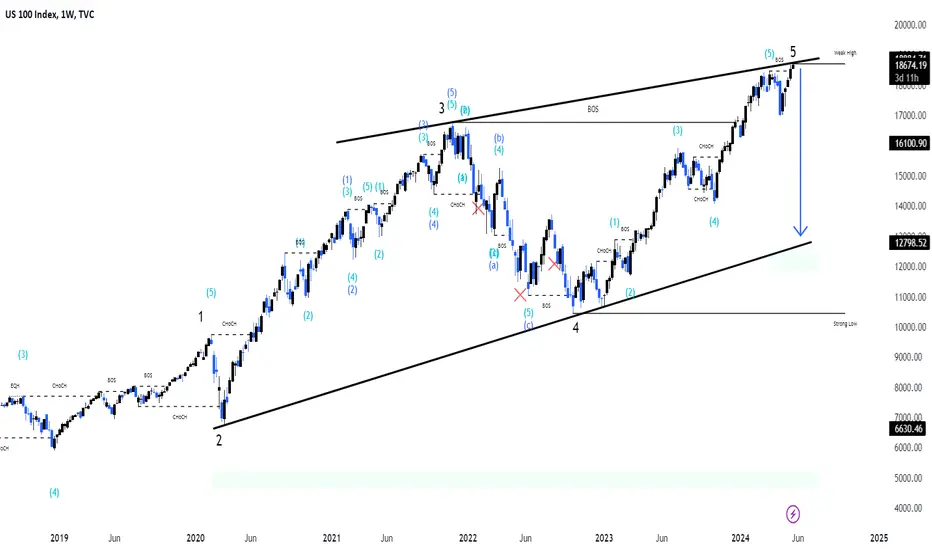
nasdaqPair : NASDAQ ( US 100 )
Description :
Completed " 12345 " Impulsive Waves
Break of Structure
Rising Wedge as an Corrective Pattern in Short Time Frame
RSI - Divergence
Fibonacci Level - 261.8%
Nas100 Trading setup Institutional tacticsHello traders this my trading setup in the higher time frame
My tactics ;
TECHNICAL ANALYSIS
Key Support & Resistance
Market Structure , Price Swings
Open Interest
Order Blocks & breaker block=> Expansion
liquidity => Reversal
imbalance => Retracement
Consolidation => Equalibrium
Market Maker Models buy and sell
Weekly Profiles
If you like my content please follow and hit the like button and show some love
wish you good luck and good trading

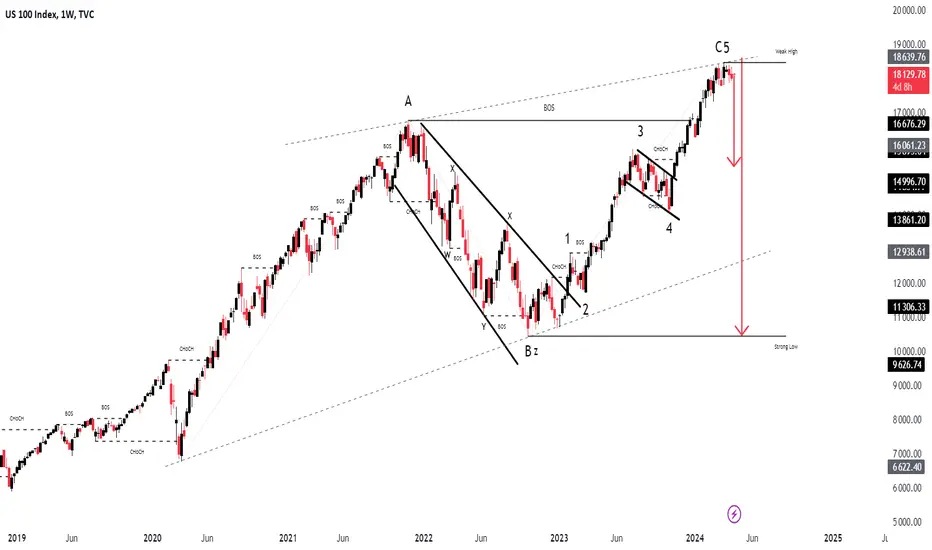
Nasdaq Pair : NASDAQ
Description :
Rising Wedge as an Corrective Pattern in Long Time Frame
RSI - Divergence
Break of Structure
Completed " 12345 " Impulsive Waves and " ABC " Corrective Waves
Resistance Level
NASDAQThis Is Another Perspective On The Nasdaq Analysis I Just Shared, What Can Also Happen Is Nasdaq Trading Above Monday's High To Form A Classic Tuesday High Of The Week, We'll See Tomorrow What Is Likely To Happen Between The Two Anticipations.

US100 SHORT, NASDAQ SHORTPrice has recently into an area of resistance, I'll be expecting price to trade down as marked on the chart. My setup for the week to come until take profit is hit. HAPPY TRADING

NAS100 4H NAS100 is in a bearish move over two weeks. LH and LL are keep forming. Now any signs of BOS (break of structure). There is a huge gap between last week High and last week Low. We can see a possible correction reversal move. A lot of imbalances are also to be taken out as we can see a lot of single print moves. This week we wait for FED decision about rates. Be careful with your trades and use tight SL.

NASDAQ Breakout Long! NASDAQ broke the
Resistance cluster of the
Falling and horizontal level of 15396.5
And the breakout is confirmed
Because the candles are closing above
the cluster so now
I am bullish biased
And I think that the Indices
Will go higher up !

NASDAQ 23-08 MovePair : US100 - NASDAQ
Description :
Support Level
Completed " 1234 " Impulsive Wave
Bearish Channel in STF as an Corrective Pattern
Break of Structure
Divergence - RSI

NASDAQ US100 15-08 MovePair : NASDAQ - US100
Description :
Bearish Channel in Short Time Frame as an Corrective Pattern
Break of Structure
RSI - Divergence
Demand Zone
Completed " 1234 " Impulsive Wave

NASDAQ Will Go Down!NASDAQ broke the support
Cluster of the rising and
Horizontal lines at around
15432 so we are now
Bearish biased and I will
Be expecting a move down!

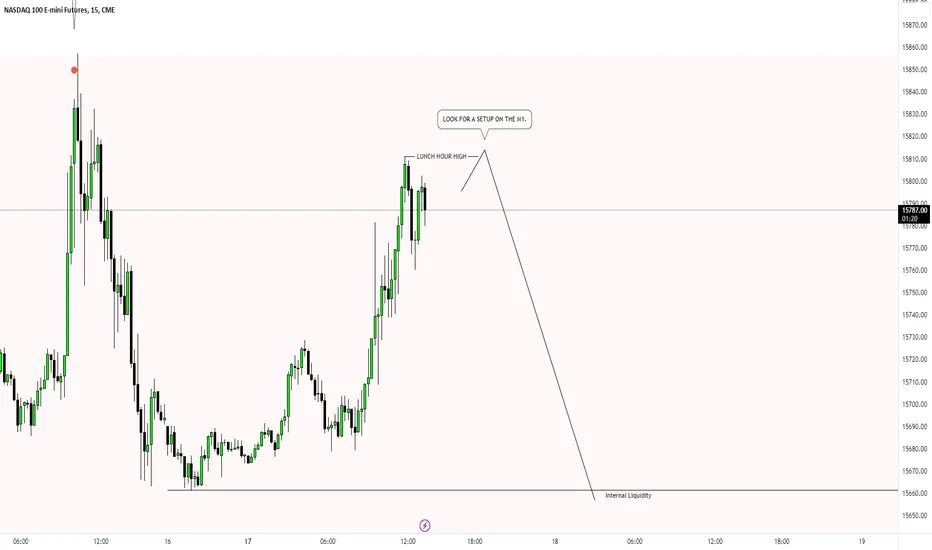
NASDAQI Also Want To See The Nasdaq Trading Lower This Week, They Can Trade Up To Take That H4 Liquidity Above That High.
Or They Can Run Out Today's Lunch Hour Highs Then Sell Off.
Do Remember To Use The S&P500 And The Dow Jones Index For SMT Divergence.
Nasdaq's Rebalancing of Fabulous 7 Tech Stock so CautionRecent news concerns Nasdaq's decision to rebalance its equal weighting for the Fabulous 7 tech stocks. While this may seem like a routine adjustment, I urge you to exercise caution and remain skeptical about future stock returns and performance.
It is no secret that the Fabulous 7 tech stock has been the talk of the town lately, capturing the attention of investors worldwide. Its remarkable growth and seemingly unstoppable momentum have undoubtedly piqued the interest of many. However, as seasoned traders, we must be aware of the hype and excitement surrounding these stocks.
Nasdaq's decision to rebalance the equal weighting of the Fabulous Seven tech stock raises concerns and warrants a closer examination of the situation. Why would such a move be necessary if everything was going swimmingly? It is essential to question the motives behind this adjustment and consider its potential implications on the stock's performance.
While rebalancing can be a regular part of market operations, it often signifies a shift in the underlying dynamics of a stock. It is crucial to remember that past performance does not guarantee future success. The Fabulous Seven tech stock's meteoric rise may have been impressive, but more is needed to ensure continued growth or prosperity.
As traders, we must remain vigilant and not mindlessly follow the crowd. While the Fabulous Seven tech stock has undoubtedly provided lucrative opportunities in the past, it is crucial to approach future investments with a healthy dose of skepticism. We must carefully analyze the potential risks and rewards, considering the rebalancing decision and its impact on the stock.
In conclusion, please proceed cautiously regarding the Fabulous Seven tech stock and any future investments. Nasdaq's rebalancing decision serves as a reminder that the market can be unpredictable and subject to sudden changes. Let us remember the importance of conducting thorough research, diversifying our portfolios, and making informed decisions based on careful analysis.
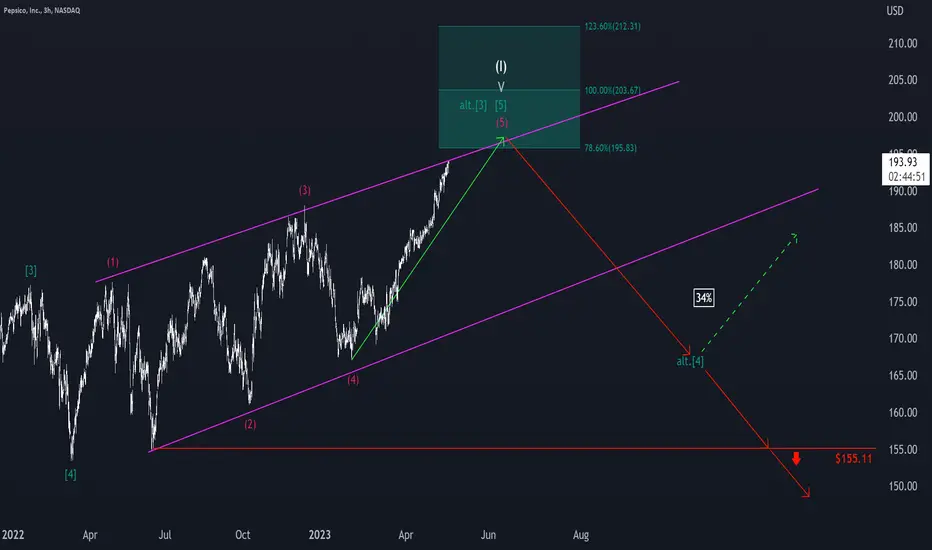
PepsiCo: Thirst for More 🥤PepsiCo is thirsty for more, heading upwards and striving for the green zone between $195.83 and $212.31 purposefully. Soon, the share should reach its goal and complete wave (I) in white. Afterwards, it should rebound from the upper edge of our pink trend channel and start an extended downwards movement, leaving the pink trend channel on the southern side and dropping below the support at $155.11. There is a 34% chance, though, that PepsiCo might finish wave alt.3 in green in the green zone instead and stop the descent above the support at $155.11. In that case, it should conclude wave alt.4 in green at this level and turn upwards earlier already.
Corbus Pharmaceuticals Holdings, Inc.Corbus Pharmaceuticals Holdings, Inc(#CRBP) in good demand area
Orange Zone is a place to enter but Considering SL:6.02
Long Term Target:71 means 800%
MidTerm Target:20 Measn 150%
