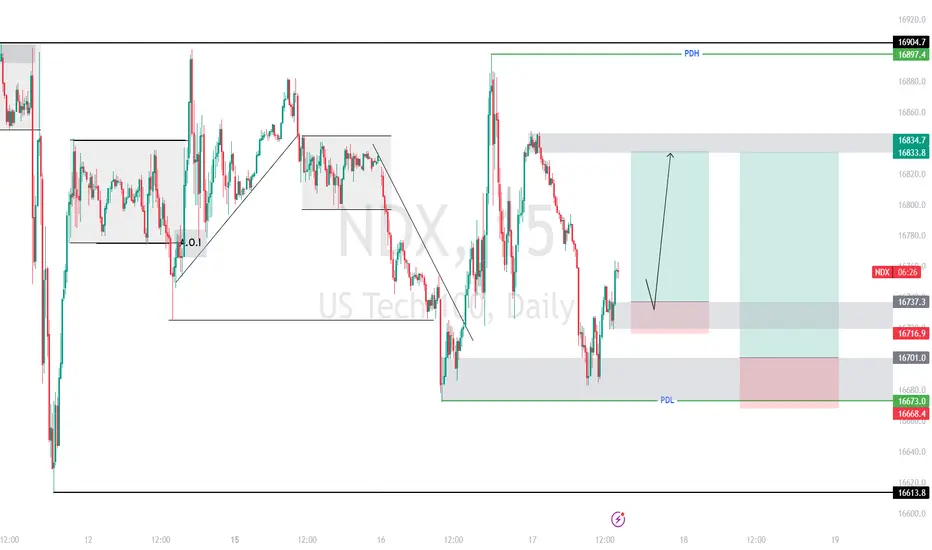
NASDAQ 100 ShortFollowing the news last week, I do anticipate that this index will continue with its bearish momentum as we look to test the 0.382 Fib level at 16800.
There will be a follow up analysis using a shorter timeframe so that we can have a clear entry position.
Nasdaqstrategy

NASDAQ SHORT 1500+ pips (UPDATE....FLOATING 700+ PIPS IN PROFIT)Good evening gents so today has been EXCELLENT. My previous analysis that was posted on JULY 29th has gone perfectly. During NEW YORK session today at 16:00pm (south African time), market gave us a beautiful drop out of our POI DAILY SIBI....We are now currently running 700+ pips in profit! If you were one of the viewers to see my previous post, give me a heads up if you got in on this trade. COMMENTS ON THIS POST IS MUCH APPRECIATED.

Nasdaq Thoughts 23-07-2024Hello everyone! Please find my NASDAQ market analysis for today below. As a price action trader, I encourage you to compare my charts with yours and use my insights to enhance your skills. These videos are designed for educational purposes only, not as trading signals. My goal is to help you grow and become a proficient trader.

Nasdaq NY session plan 12-JUL-2024Here's what I am looking at for Nasdaq during the New York session. Will the pull back continue or not? I do not know, we'll let price show us what it intends to do.

Nasdaq thoughts - 11-JUL-2024Hello all, here's my plan for Nadaq entries for today. Remember to use this to compare with your chart and improve yourself, they aren't meant for you to just use as signals. On trading view, you can click on " Make this chart mine" and it will automatically open the chart on yours.

Nasdaq thoughts 28-06-2024Here are my Nasdaq thoughts for today. Waiting for volume to come into the market to enable be decided where I am entering. My zones have been marked out, you can decide to make the chart yours.

NASDAQNasdaq analysis
Weekly and daily time frame
The price can return to the midline of the daily trading range and move towards the weekly resistance from there.

NASDAQ H3 Idea | SELL to BUYPlanning to initiate a short position in the Nasdaq when it reaches 19,100, aiming to capitalise on a downward movement to 18,600. Once the Nasdaq hits 18,600, I will close my short position and open a long position, anticipating a rebound that could lead to a new all-time high (ATH). This strategy is designed to take advantage of both the anticipated decline and the subsequent recovery in the Nasdaq index.

Nasdaq buy setup institutional tactics hello traders this is my nas100 buy setup
risk reward 1:10
the system: institutional tactics
if you like this deal hit the like button follow comment subscribe and show some love ❤️
wish you good luck and good trading
i would like to have conversation and share our ideas and know you good people
remember the flow state is important
Flow , Glow and know and never blow

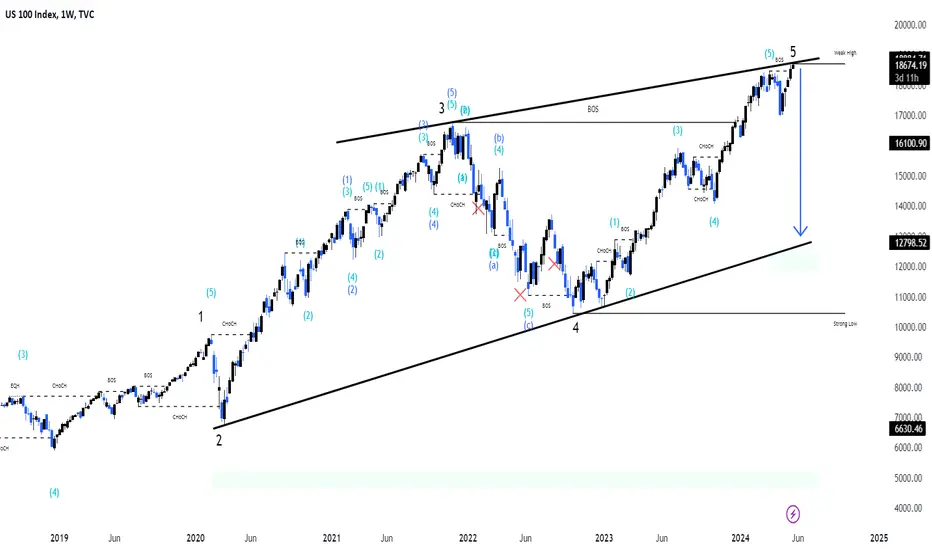
nasdaqPair : NASDAQ ( US 100 )
Description :
Completed " 12345 " Impulsive Waves
Break of Structure
Rising Wedge as an Corrective Pattern in Short Time Frame
RSI - Divergence
Fibonacci Level - 261.8%
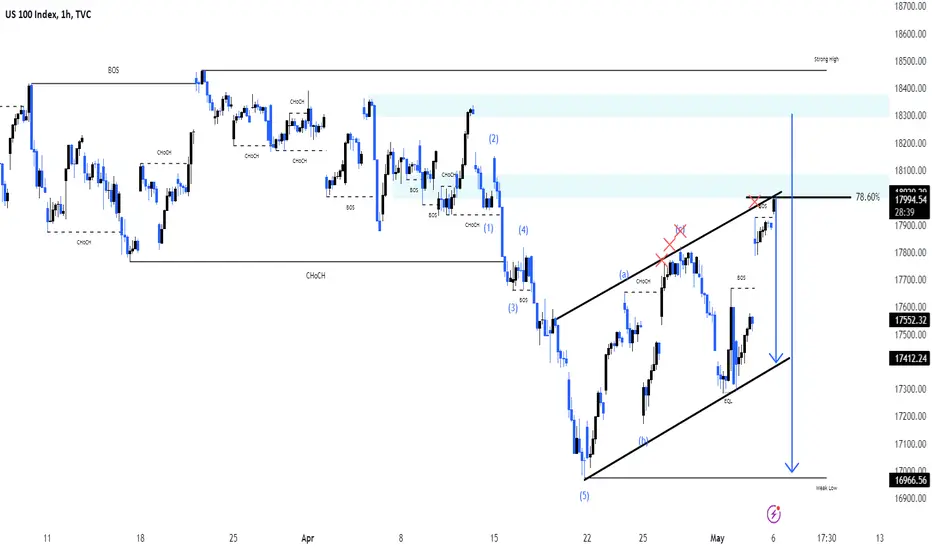
NASDAQPair : NASDAQ
Description :
Completed " 12345 " Impulsive Waves
RSI - Divergence
Break of Structure
Bullish Channel as an Corrective Pattern in Short Time Frame
Fibonacci Level - 78.60%
Nas100 In case of retracement and continuation upPlease see my previous idea
As my previous idea, I mentioned the next nas100 movements.
Where we are now?
As you can see from the picture, Friday we touched liv 0.786 Fibonacci (17917.60).
On the RSI indicator an overbought position in multiple TF.
Appl on RSI indicator shows overbought in multiple TF.
This calling an obviously down from now. I advise to all that don’t have a positions open now, To open a Short position.
Green LH red HL
Nas100 will aim surely to
0.618 fib level (17529.90)
0.786 fib level ( 17418.40)
If stop the downtrend on those levels and will start to back up, we will consider the downtrend in large Tf invalid and a continuation up, possibly on the ATH.

Nas100 Trading setup Institutional tacticsHello traders this my trading setup in the higher time frame
My tactics ;
TECHNICAL ANALYSIS
Key Support & Resistance
Market Structure , Price Swings
Open Interest
Order Blocks & breaker block=> Expansion
liquidity => Reversal
imbalance => Retracement
Consolidation => Equalibrium
Market Maker Models buy and sell
Weekly Profiles
If you like my content please follow and hit the like button and show some love
wish you good luck and good trading

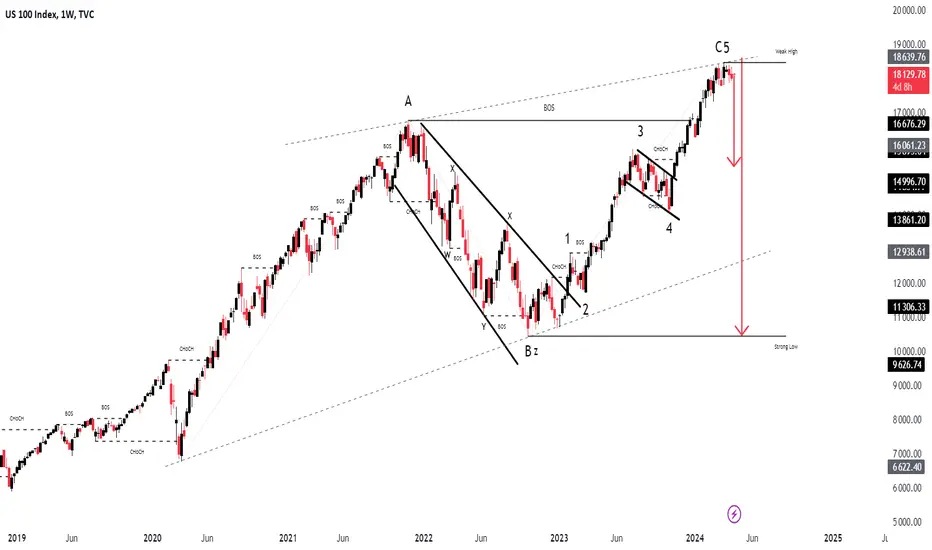
Nasdaq Pair : NASDAQ
Description :
Rising Wedge as an Corrective Pattern in Long Time Frame
RSI - Divergence
Break of Structure
Completed " 12345 " Impulsive Waves and " ABC " Corrective Waves
Resistance Level
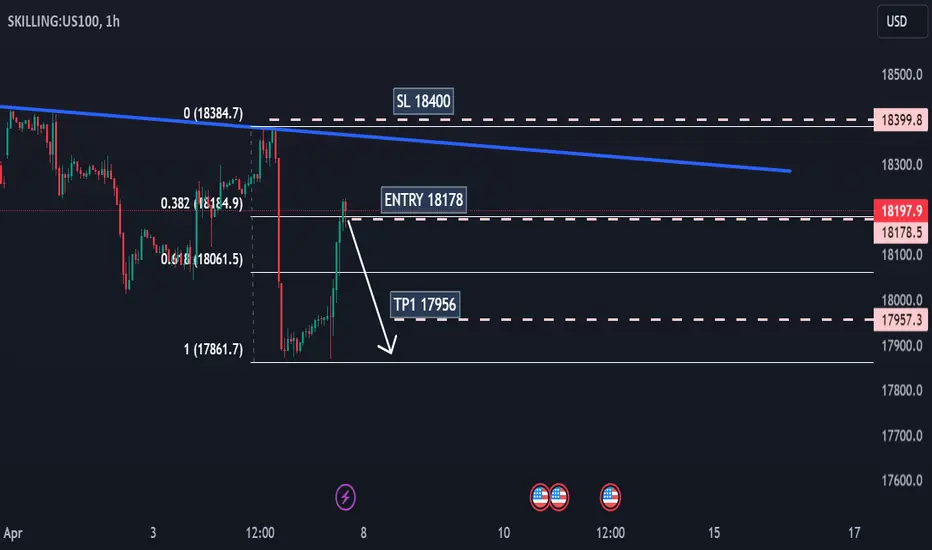
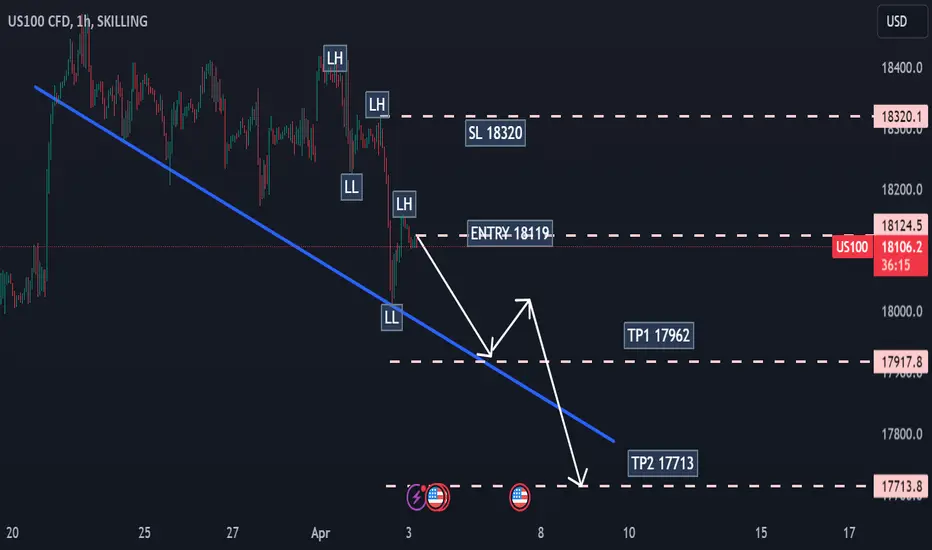
Nasdaq - In Bearish TrendNasdaq following the Berish Trend making LH and LL also respecting the bearish trendline.
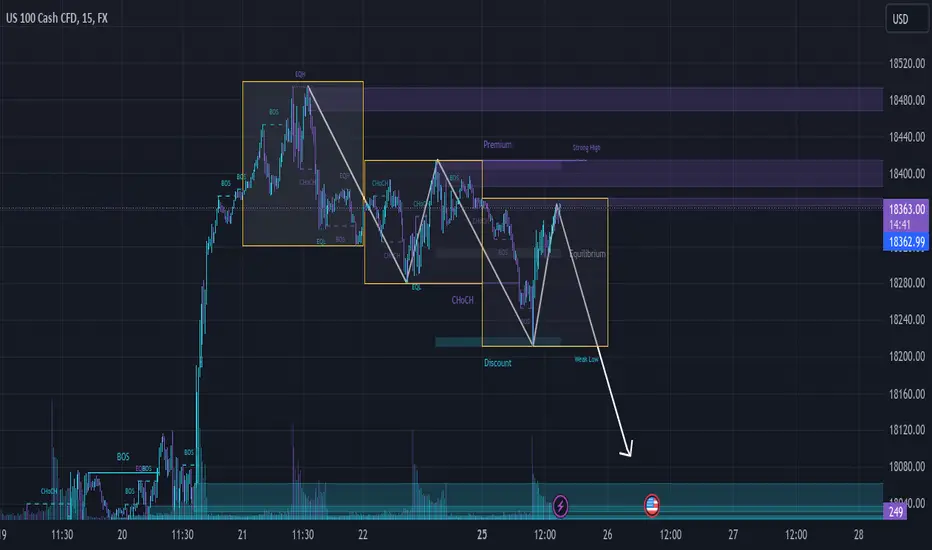
Possible sell opportunity on NASDAQwere on a 3rd day of push to the downside, also currently in the golden zone and also in Premium zone. On the 4H & 15 min time frame weve reached order blocks. Id go for a 1:2 RR for this just to keep it light since this still is an uptrend. If it goes beyond the 2nd leg the trade will be invalid
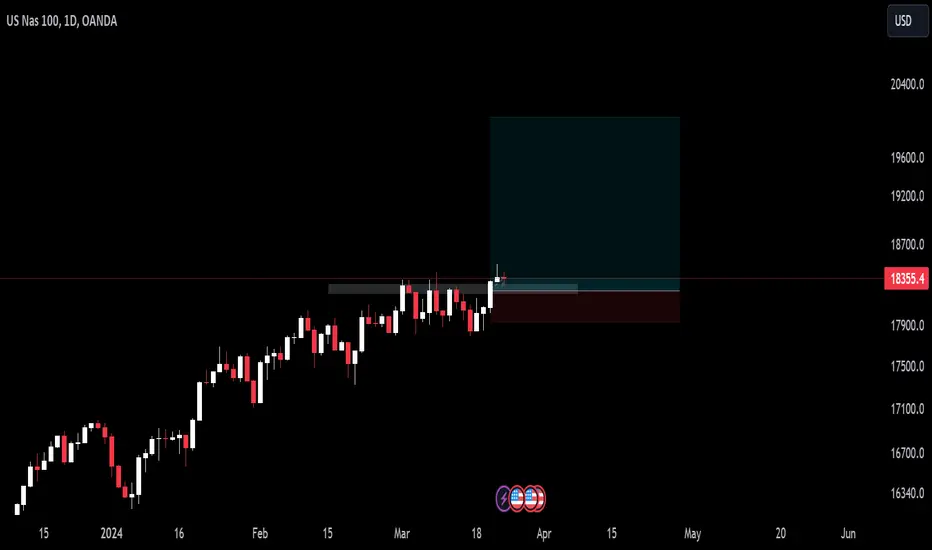
NASDAQ100 ON MAJOR BUYING ZONEThe analysis suggests that NAS 100 (Nasdaq 100 index) is currently within a major buying and demand zone. This zone is a price range where significant buying interest has historically been observed, indicating strong demand for the index. Specifically, the demand zone is identified between 18,200 to 18,300 points on the NAS 100 index.
In technical analysis, demand zones represent areas where buyers outnumber sellers, resulting in increased buying pressure and potential price support. Traders often view demand zones as favorable entry points for long positions, anticipating a bounce in price from these levels.
The target for this trading setup is set at 200 pips, representing the expected upside movement in the NAS 100 index from the demand zone. Traders typically set targets based on technical analysis indicators, historical price movements, and market sentiment. In this case, the target of 200 pips suggests a significant potential gain for traders who enter positions at the demand zone.
Overall, the analysis indicates a favorable trading opportunity in NAS 100, with a major buying and demand zone identified between 18,200 to 18,300 points. Traders may consider entering long positions with the expectation of a 200-pip upside movement, aiming to capitalize on the potential price appreciation from the demand zone.
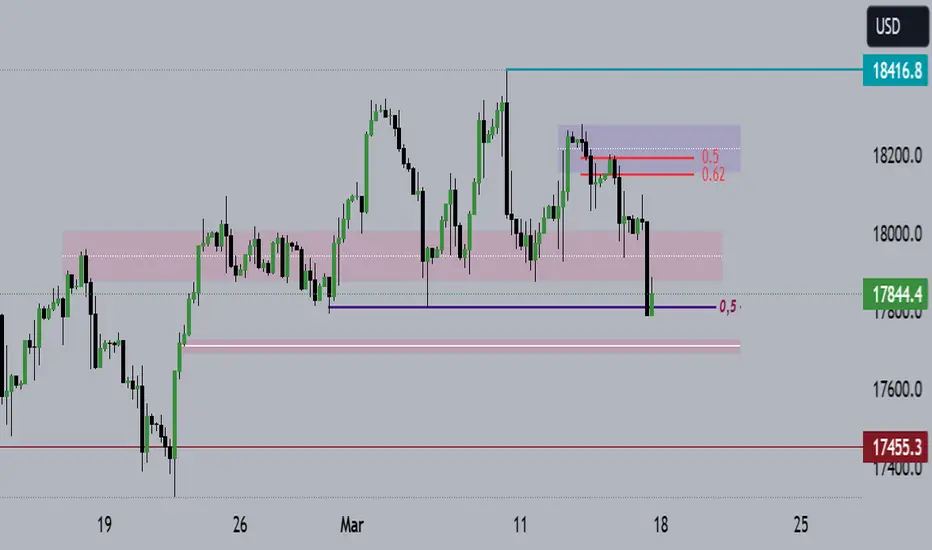
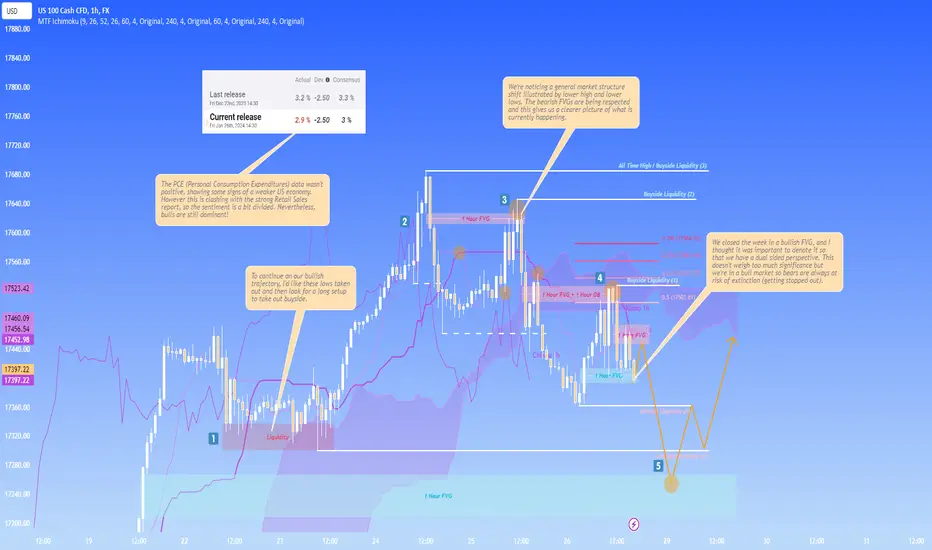
NAS100 - MONDAY'S SMALL SHORT FOR BIG LONG! (TARGET 17265)As you might have noticed, the Nasdaq is on fire and I'm more of a reversal trader so times are harder. But, there is an old saying that states: "the trend is your ". I forgot the rest but I'll let you figure out the last word. So in homage of this old saying, we'll tighten our bullish running shoes and propose a setup that satisfies both camps. Here's what I see happening on Monday (29/01/2024):
What is on the chart? (follow the steps)
1) We have our liquidity target level which gave place to the continuation of the rally. So far so good for bulls, price is going up and their net worths too.
2) Our first reversal structure, with a low taken out and the high intact.
3) This is our retracement signal, confirming the market structure shift to the downside. This is paired with the fact that price broke the hourly Tenkan and Kijun + the Tenkan and the Kijun crossed over + breaking the Kumo + breaking the latest low. Additionally, the 4H Kijun and Tenkan reside within the 1H Kumo so those too were broken (not shown on the chart to promote clarity). These are reliable reversal signals. I am not trying to be a contrarian against the general trend but, this is how we spot general highs and lows. The daily is simply bullish so it's harder to spot a minor intraday opportunity such as this one.
4) This rejection confirms our reversal idea, and strengthens the probability of sellside liquidity getting taken out.
5) This is our final target, ideally the 1 Hour FVG. Again, on Monday anything can happen of course but this seems the most likely. I want these lows taken out before anything and, therefore we can short in anticipation of these lows getting taken out!
Most importantly, take some rest and have a great weekend! ;)
Nasdaq Crash Loading - The Black Swan The current state of the NASDAQ indicates an extreme overbought condition, with a rally influenced by speculation surrounding six potential rate cuts in 2024. However, the risk arises from the Federal Reserve's concern about inflation. If the Fed, in response to persistent inflation, opts to raise rates, it could lead to a market decline. Conversely, a decision to cut rates may not be sufficient to buoy the stock market if the number of cuts is lower than expected.
Examining current fundamentals, the housing market has stabilized with low prices and mortgage rates. Although there is a rebound, a potential increase in housing speculation and mortgage rates could prompt a reassessment. Improved employee wages contribute to consumer confidence against inflation.
President Joe Biden's initiatives, such as pausing student loan payments in November and plans to provide homes for 500,000 Americans, may stimulate housing demand, causing prices to rise. This could prompt a review of interest rates and a tightening of monetary policies.
While I maintain a long-term bullish outlook, anticipating a correction of at least 50%, it is prudent to reevaluate macroeconomic indicators at that point to determine whether to take profits or continue holding.

Ichimoku Kinko Hyo - The Most Underrated Indicator (e.g. NAS100)Welcome to my first educational post. This is a big one, Ichimoku Kinko Hyo is the most underused, underrated, least understood and yet most powerful trend indicator available to the general public. I'll first briefly describe the 4 components:
- Tenkan Sen (turning line): it's like a small period moving average but calculated slightly differently. So if price breaks it, it's a first signal of a trend reversal but always wait for the retest.
- Kijun Sen (standard line): it's like a larger period moving average but like the Tenkan it's calculated differently. One interesting note is that when it flatlines it represents the 0.5 fib level of the current range.
Together, they are used for crossovers just like classic moving averages.
- Kumo (Cloud): which is composed of 2 special moving averages called the Senkou Span A and the Senkou Span B. Generally serves as a support/resistance zone and is also subject to crossovers that can confirm reversals (not signal) since it is too slow to signal them. The thicker the cloud the stronger the trend and vice versa.
- Chikou Span (Lagging Span): Mirrors current price action 26 periods in the past. In simple terms, it puts things into perspective and can detect potential blocking points for price.
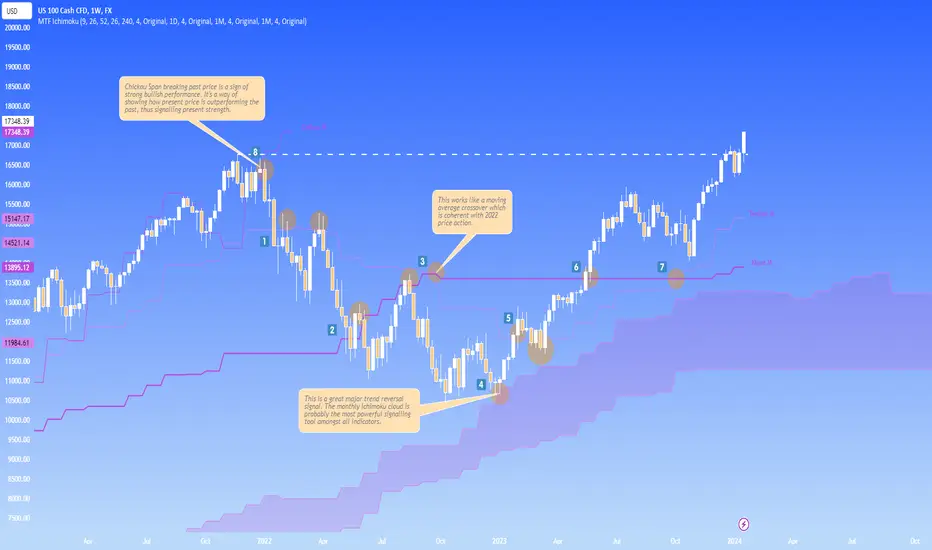
Here is a case study of the NAS100 and monthly Ichimoku:
What do we see? (Follow the steps)
1) Price breaking the Tenkan and retesting it twice. This is already a major bearish signal.
2) Following the Tenkan break, price doubled down and broke the Kijun + retested it TWICE!
A strong bearish confirmation that the downtrend will continue.
3) The Tenkan/Kijun crossover, this is like a death cross of MAs (look it up).
4) This is a reversal signal. You'll notice how price never touched the cloud again. The monthly Ichimoku really puts things into perspective. It really enables you to see the bigger picture and that it is okay to buy in a bear market. You just have to let it guide you.
5) First confirmation of the reversal: the break of the Tenkan + retest.
6) Second confirmation of the reversal: the break of the Kijun + no retest was even needed.
7) 'Golden cross', the Tenkan/Kijun crossing over which is the third confirmation and that price is simply extremely bullish.
8) The Chikou Span breaking past price. This is similar to price breaking a resistance level, it gives the same kind of signal. This is the final bullish confirmation.
This a very summarised explanation of how the Ichimoku Kinko Hyo indicator should be used BUT if you want to learn more about it, I strongly suggest you read the book by Karen Péloille: Trading With Ichimoku, A Practical Guide to Low-Risk Ichimoku Strategies.
As always, have a lovely Sunday and happy trading! ;)
NASDAQ100 TECHNICAL ANALYSIS INTRADAY Here I present my technical Analysis for Nas100 , with key zones where I will be more interested in taking some trades.