Strong Support & Favorable Risk-Reward in Natural GasI'm bullish in the short-term and through 2020.
- Natural Gas ($2.327) is currently sitting below the 20d ($2.37), 50d ($2.56), and 200d ($2.8) MAs.
- The recent retest of the 13-year falling trendline (orange) should also strengthen bull cases. In 2016 the trendline changed from resistance to support. And most recently in August, Natural Gas bounced off this trendline with gusto.
- Several converging support levels. There is minimal downside in Natural Gas Versus upside.
Over the short-term, 2-4 weeks, I think $2.55 will be achieved. From there $3.0 will potentially be next. I believe the support at $2.1 and $2.2 will hold over the near-term. I believe $3.8 may be achieved at some point in 2020.
Of course, there does exist risk in Natural Gas. There is a bear case. We could see a sell-off towards the lowest support levels. That would come in around $1.3. If that selloff does come, the signals will be the price action between 2.2-1.9 and a breaching of the white & orange trendlines lower. If this selloff does occur, I expect these lower prices to get bought up very quickly, thus making this scenario a strategic buying opportunity.
I welcome this selloff but I am not waiting for it. I expect the white support lines to be respected and for 3.0 to be achieved in the next couple months.
Natgassignals
NATGASUSD -AnalysisNATGASUSD is highly oversold on every single chart except the daily (M30, 1H, 2H, 4H). On the daily chart, while not oversold, we have reached the RSI support line we have held since August 2019 (3 mo.). This line can easily be broken, but it is here where I am taking a position with a tight stop loss.
Price bounced from the 2.26 (0.236) fibb level, and will normally reach 0.50 fibb (2.37-2.40) before next big move.
Another option - is that it is setting up a much larger bearish head and shoulders pattern, which is a common pattern as I have noticed and mentioned in previous analyses.
Winter storms are still to come, even though this winter is predicted to be lighter than most. I think reaction was very strong in the past daily sell off, and should rebound to at least 2.37-2.40.

NATGAS bounced from support, potential for a further rise!
NATGAS bounced off 2.255 where it could potentially rise further to 2.430.
*Disclaimer.*
Trading leveraged products carries a high level of risk and may result in you losing substantially more than your initial investment. Pepperstone Group Limited is licensed and regulated by the Australian Securities and Investments Commission (AFSL 414530). Pepperstone Limited is authorised and regulated by the United Kingdom Financial Conduct Authority (FRN 684312). This information is not intended for distribution to, or use by, any person in any country or jurisdiction where such distribution or use would be contrary to local law or regulation.

NATGAS bounced from support, potential for a further rise!
NATGAS bounced off 2.410 where it could potentially rise further to 2.660.
*Disclaimer.*
Trading leveraged products carries a high level of risk and may result in you losing substantially more than your initial investment. Pepperstone Group Limited is licensed and regulated by the Australian Securities and Investments Commission (AFSL 414530). Pepperstone Limited is authorised and regulated by the United Kingdom Financial Conduct Authority (FRN 684312). This information is not intended for distribution to, or use by, any person in any country or jurisdiction where such distribution or use would be contrary to local law or regulation.

NATGASUSD bounced from support, potential for a further rise!
NATGASUSD bounced off 2.410 where it could potentially rise further to 2.660.
*Disclaimer.*
Trading leveraged products carries a high level of risk and may result in you losing substantially more than your initial investment. Pepperstone Group Limited is licensed and regulated by the Australian Securities and Investments Commission (AFSL 414530). Pepperstone Limited is authorised and regulated by the United Kingdom Financial Conduct Authority (FRN 684312). This information is not intended for distribution to, or use by, any person in any country or jurisdiction where such distribution or use would be contrary to local law or regulation.
NATGASUSD bounced from support, potential for a further rise!
NATGASUSD bounced off 2.450 where it could potentially rise further to 2.660.
*Disclaimer.*
Trading leveraged products carries a high level of risk and may result in you losing substantially more than your initial investment. Pepperstone Group Limited is licensed and regulated by the Australian Securities and Investments Commission (AFSL 414530). Pepperstone Limited is authorised and regulated by the United Kingdom Financial Conduct Authority (FRN 684312). This information is not intended for distribution to, or use by, any person in any country or jurisdiction where such distribution or use would be contrary to local law or regulation.

NATGASUSD reversed from resistance, potential drop!
NATGASUSD reversed off its resistance at 2.660 where it could potentially drop further to 2.450.
Trading CFDs on margin carries high risk.
Losses can exceed the initial investment so please ensure you fully
understand the risks.

NATGAS approaching support, potential for a further rise!
NATGAS approaching support at 2.450 where it could potentially rise further to 2.660.
*Disclaimer.*
Trading leveraged products carries a high level of risk and may result in you losing substantially more than your initial investment. Pepperstone Group Limited is licensed and regulated by the Australian Securities and Investments Commission (AFSL 414530). Pepperstone Limited is authorised and regulated by the United Kingdom Financial Conduct Authority (FRN 684312). This information is not intended for distribution to, or use by, any person in any country or jurisdiction where such distribution or use would be contrary to local law or regulation.

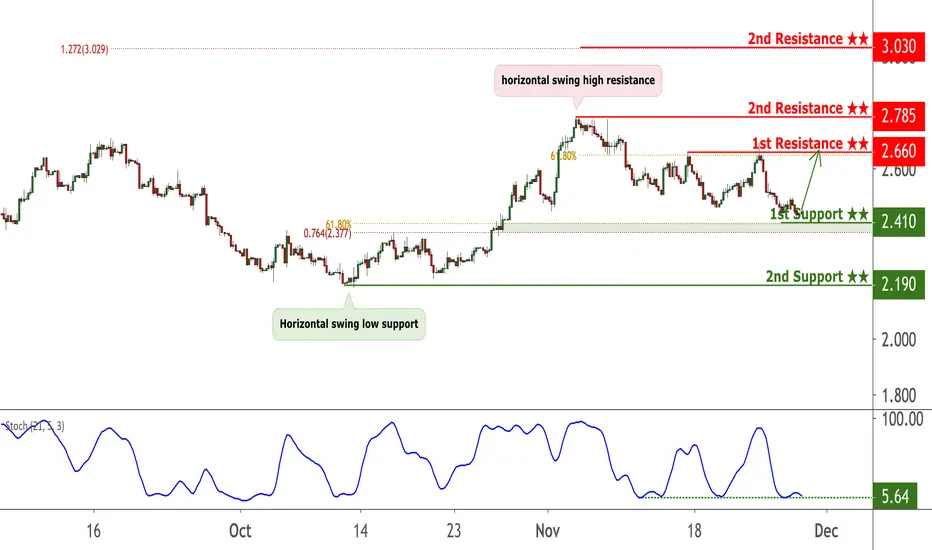
NATGAS reversed from resistance, potential drop!
NATGAS reversed off its resistance at 2.785 where it could potentially drop further to 2.600.
*Disclaimer.*
Trading leveraged products carries a high level of risk and may result in you losing substantially more than your initial investment. Pepperstone Group Limited is licensed and regulated by the Australian Securities and Investments Commission (AFSL 414530). Pepperstone Limited is authorised and regulated by the United Kingdom Financial Conduct Authority (FRN 684312). This information is not intended for distribution to, or use by, any person in any country or jurisdiction where such distribution or use would be contrary to local law or regulation.

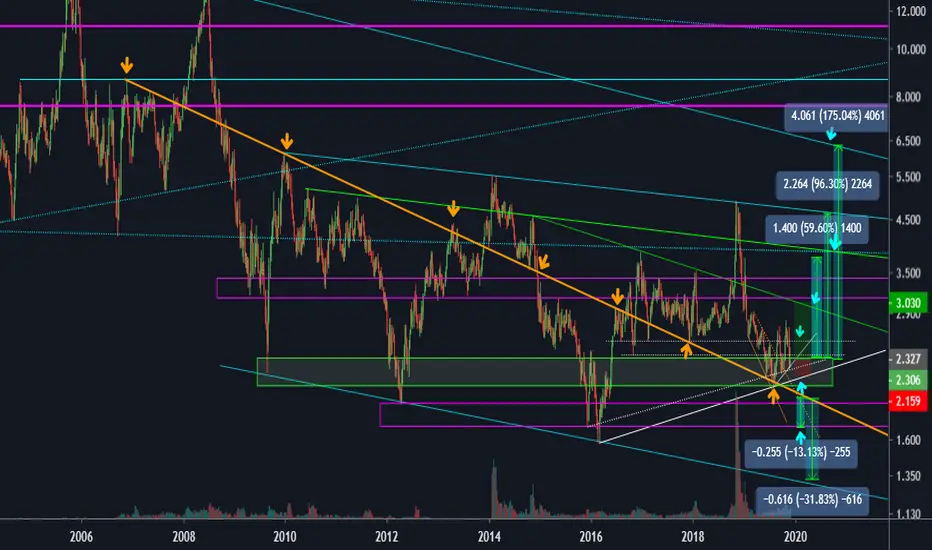
NatGas - Monthly overviewWhy the previous long idea is so interesting....?
I highlighted by red arrows the 3 year cycle lows.
There was a one in 2006 Sept, the next 2009 Sept, then 2012 April, and 2016 March...
And I think the next one is here in 2019 April....
On the monthly chart the bear started in 2006.
The first multi year cycle printed the low in 2006 September. The second one broke down tested back the highs and printed a double top; the low arrived in 2009 September.
The third multi year cycle printed lower lows lower highs : clear bear market with a new low in 2012 April.
The fourth multi year cycle‘s yearly cycle started making higher highs but it was not enough to print a multi year cycle’s higher high. This multi year cycle low ended in 2016 March with a depressive low.
The fifth multi year cycle( we are still in this one) spent most of its time in a range. And the range broke up. Still not a higher high in the multi year cycle but attacking that 5 $ level again.
We are due for a multi year low again. Oil printed it. Gold printed it. So most of the commodity complex is ready to suck in the printed billions what central banks produced in the last few years.
Seasonality. The multi year highs are usually peaking in November - December, so we need to be in position for 6-7 months..
But if we starting a new bull market we might have 2 yearly high. One before summer one after it.
The multi year cycle's gains :
2: 4.2 to 13.6 323%
3: 2.2 to 6.1 272%
4: 1.9 to 5.5 289%
5: 1.6 to 4.87 304%
6: 2.56 to ???
That's why it is so important to try to catch the daily cycle lows these times in Natty...

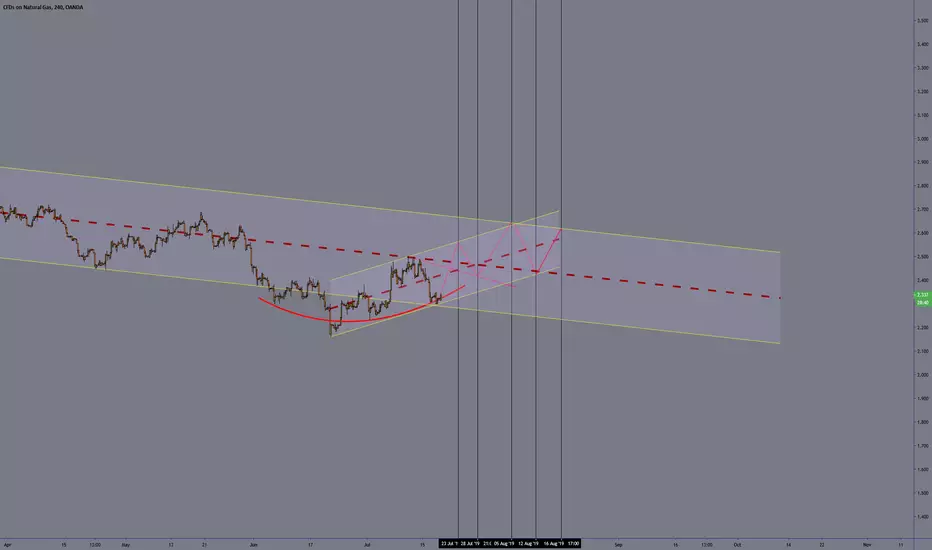
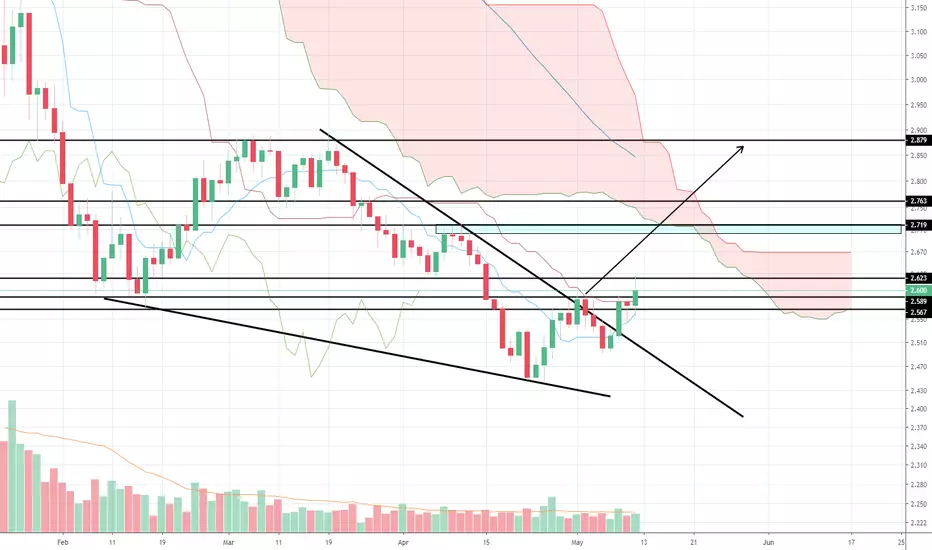
NATGAS falling wedge broken - Time to go longTitle is simple. Can go long. Have already been long for a while.
We have broken out of the downtrend.
Targets are black lines above. First target has already been hit.
If you want to play it safe, wait for a close above the black line before entering.
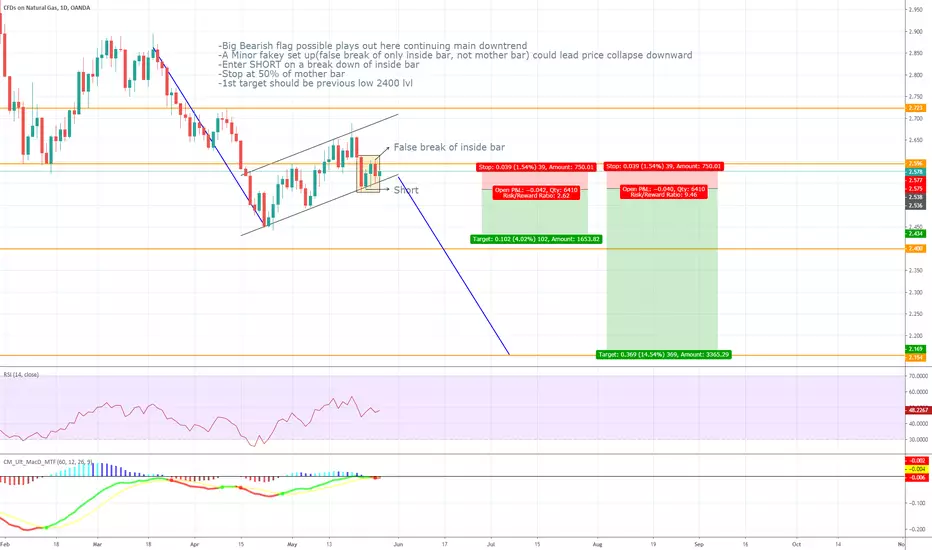
NATURAL GAS Sell SignalPattern: 4H Channel Down.
Signal: Bearish after a Lower High was made yesterday.
Target: 2.641 (estimated Lower Low).

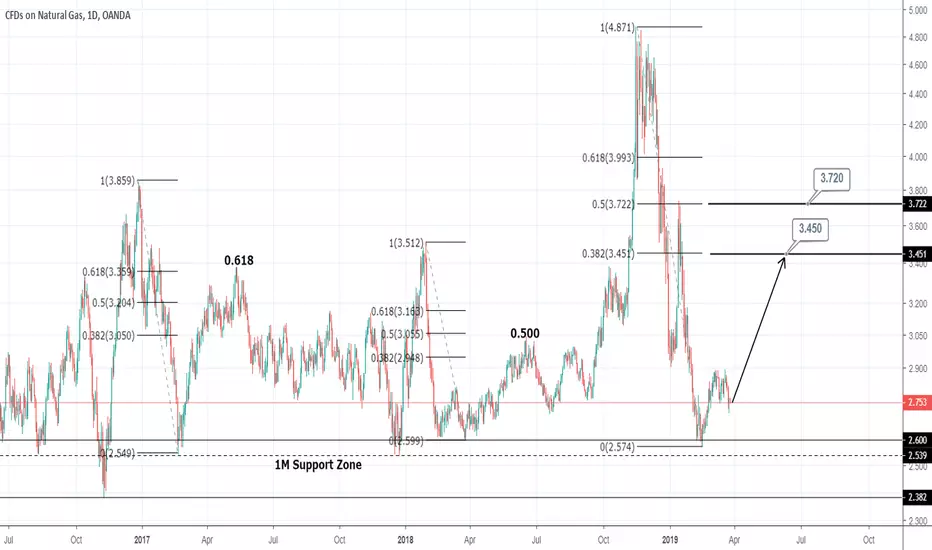
NATURAL GAS Buy Signal long termPattern: Fibonacci retracement.
Signal: Bullish as it rebounded on the 1M Suppport Zone.
Target: TP1 3.450 (0.382 Fibonacci) TP2 3.720 (0.500 Fibonacci).