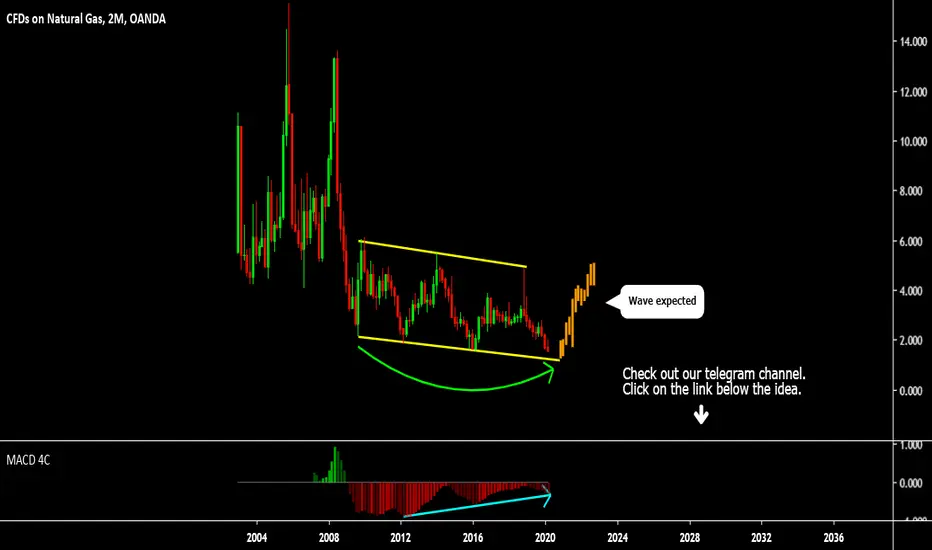
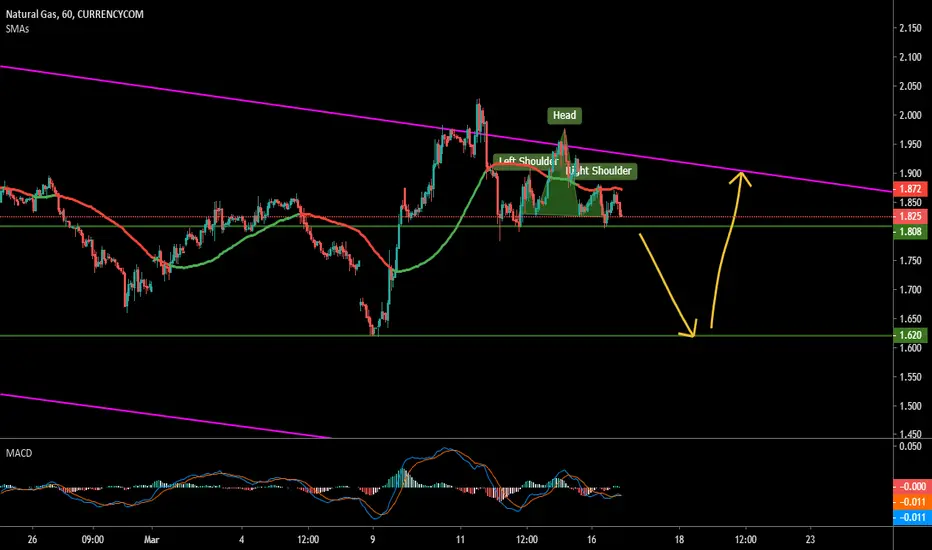
NATGAS USD BUY (NATURAL GAS - US DOLLAR)Hi there. Price is forming a reversal pattern to change its direction. Wait for the price to complete the pattern and watch strong price action for buy.
NATURAL GAS
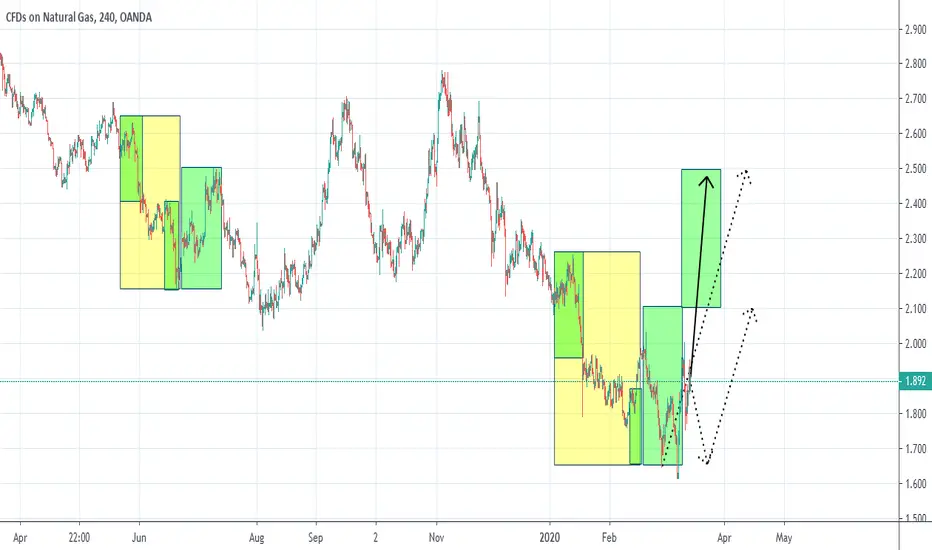
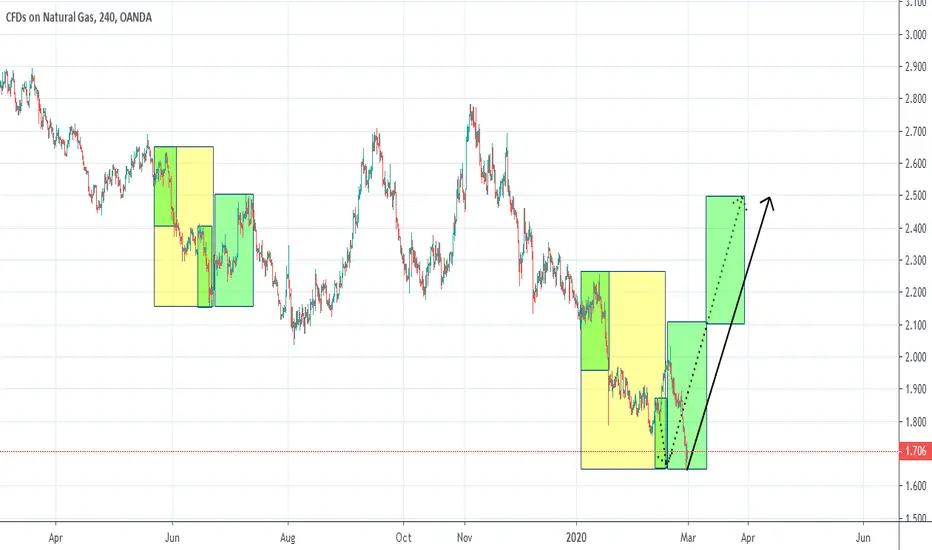
NATGASUSDSo taking this trade into what's happened with price before this is a no brainer if you ask me so we either break lower hitting the outer structure and then start a bullish run or we start from the double bottom.
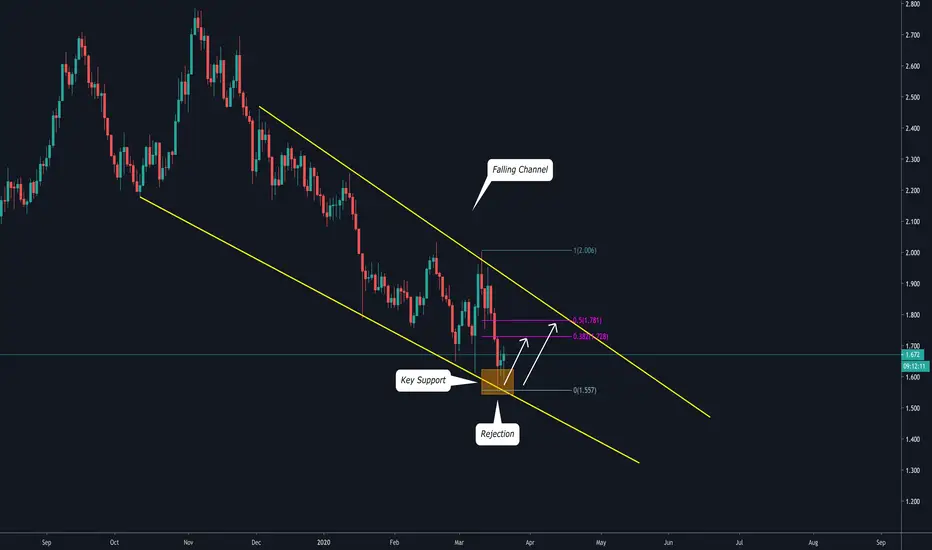
Natural Gas (NATGASUSD): Bullish Forecast
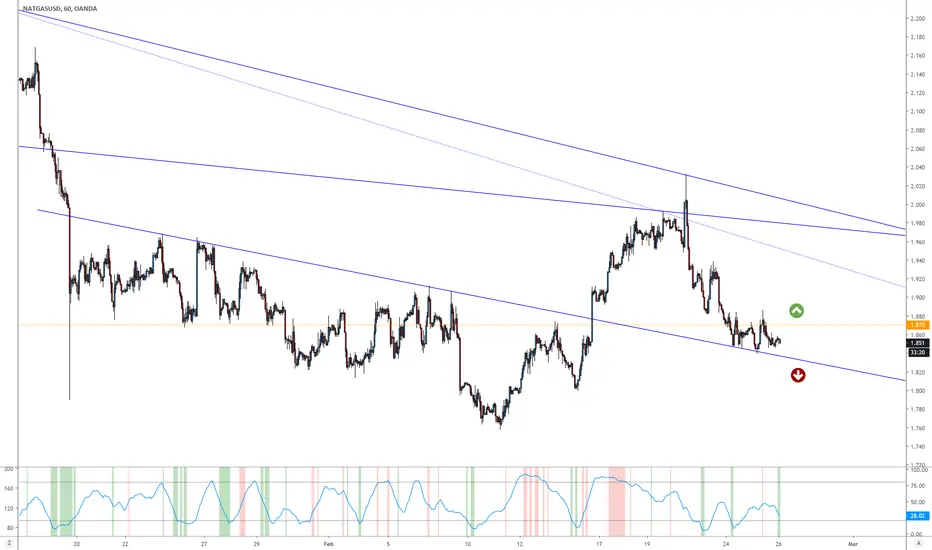
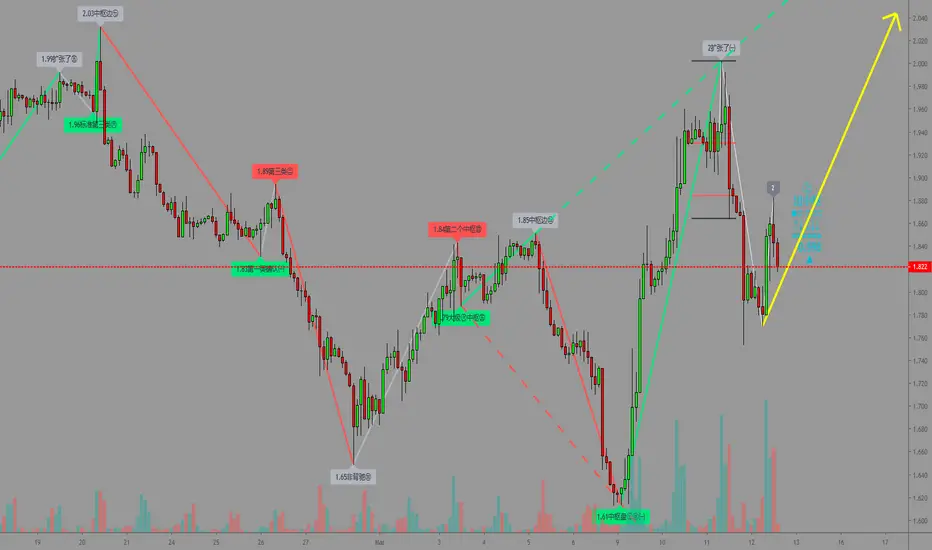
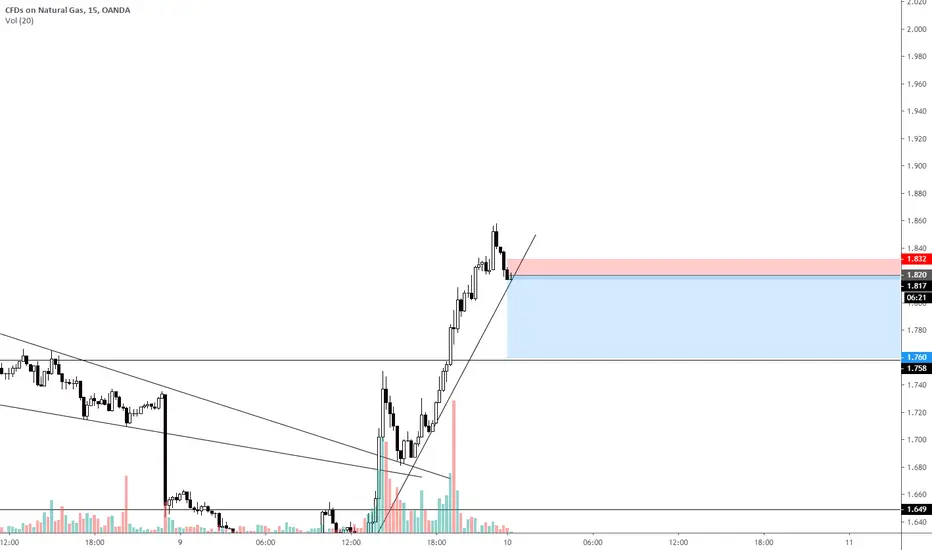
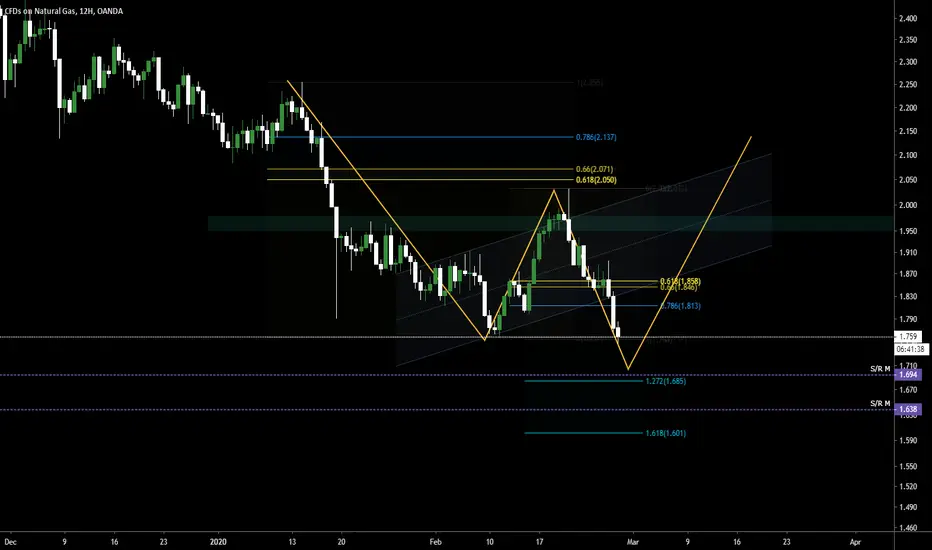
Natural gas is testing a support line of a falling channel three days in a row!
with rejection and clear exhaustion on lower timeframes, I believe that we can expect a bullish reaction to higher structure levels.
key levels:
1.73 / 1.78
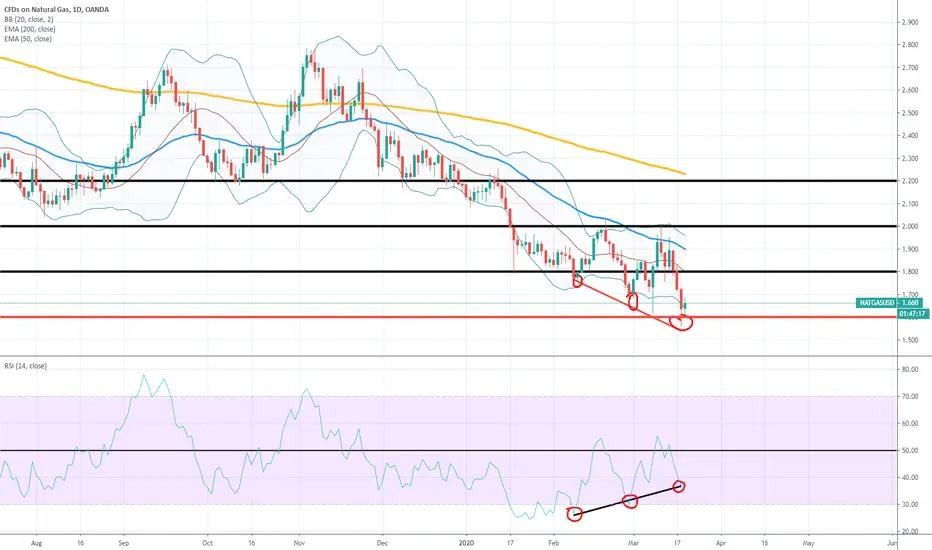
Natgas bullish divergence, are we reached the bottom?Bullish divergence on daily chart, first target 1.80!!!
XLE IS THE PLACE FOR MEBuy cheap. Sell expensive. Buy fear. Sell/short greed. I don't have an established trend here but I like energy long term. Now let's hope that ETF's don't collapse.

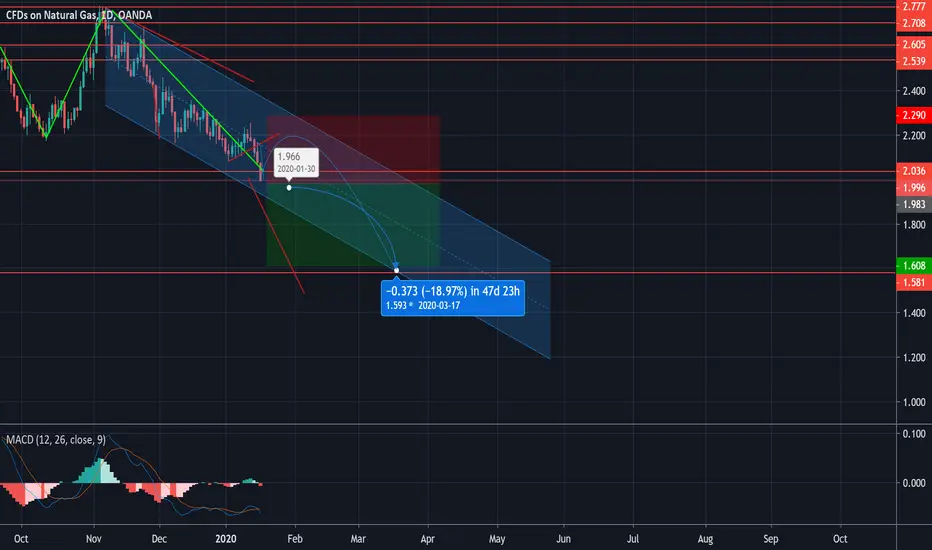
NATGAS BUY TP_2.139_18.24%_0.330pips_SL_1.699_6.08%_0.110pipsNATGAS BUY TP_2.139_18.24%_0.330pips_SL_1.699_6.08%_0.110pips

NATGASUSD possible higher rated upward momentumFollowing on from my previous analysis, I predicted a short followed by a long, this analysis stands, but I see the rate a climb bing quicker in the following few weeks
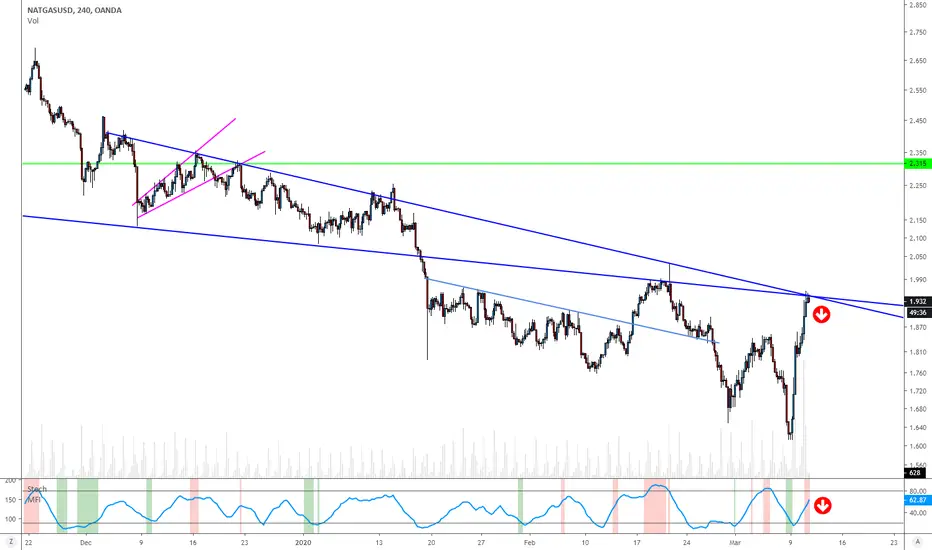
Natural GAS SHORT.Overextention to the up side and touching convergence of 2 major trend lines .
simple!
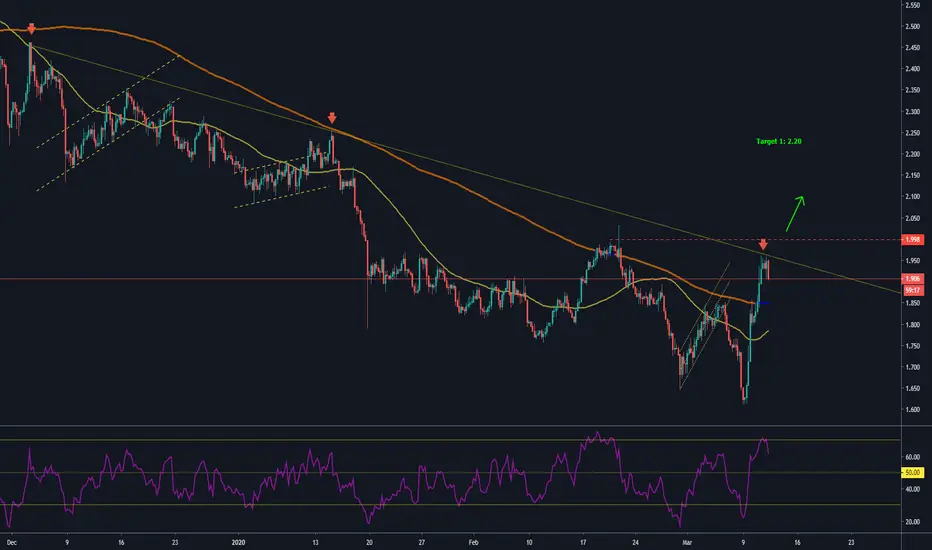
Nat Gas setupPrice testing the downtrend line again. A break to the upside and close above 2 is a buy signal.
Target 1 at 2.20, stop below the latest swing.
Good Luck!
SHORT NATGAS USD short selling because the candle breakout old support
double top break in M30 and H1
BUT you can wait for confirmation on D1 time frame Because the price is at the bottom of the channel and maybe go up
remind that you can wait for test and short sell again !
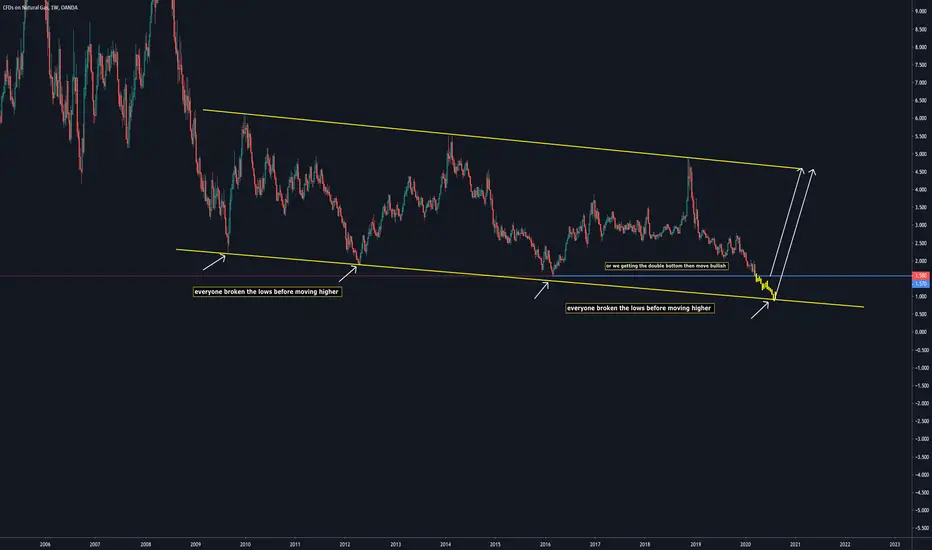
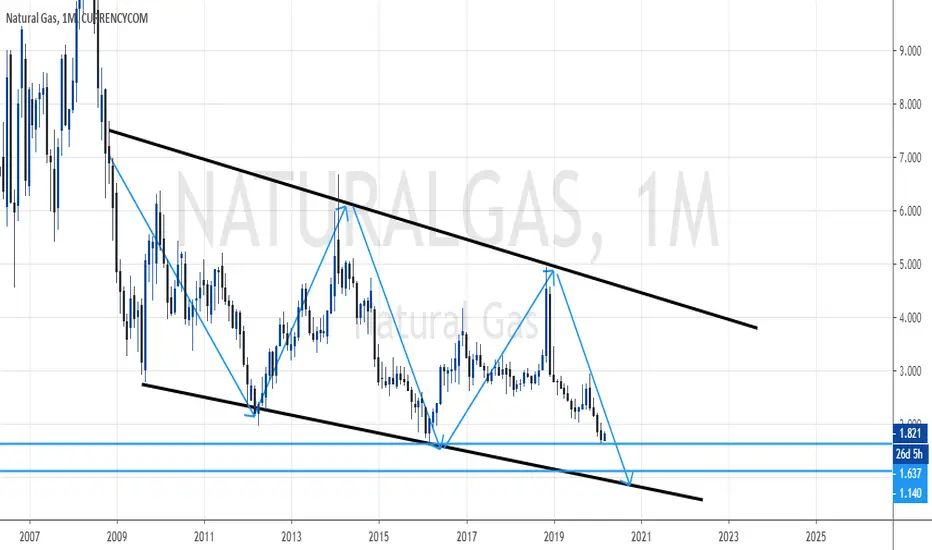
Weekly analysis on NG by ThinkinAntsOkToday we will focus on the Weekly chart on Natural Gas. Use this as a guide to develop your view of the chart:
Main items we can see:
a)Currently, the price is on a massive support zone
b)In 2012 and 2016 we observed massive reversal movements on the area between 1.90 and 1.60
c)If we are thinking about developing long setups, we have a good filter that has worked on previous situations
d)First, we need a clear breakout of the descending trendline / Second, we need a corrective movement / If that happens, the setup will be ready to trade.
e)This is a Swing view, which means that it requires patience to wait for the expected formation.
f) We will not develop short trades unless there are clear signs that the support zone is broken.

Natural Gas (up or down) Pick your poisonIn my own opinion, since Natural Gas first landed on the market in 2004, it has 1 all time low at 1.574, which is lower than 2004 and since then we have never tested this bottom again. I think with news of coronavirus, it is the perfect opportunity for this level to be tested and i think it will go much further down creating a new low for natural gas.
DISCLAIMER
Please note that this chart is an opinion based chart only. Please trade at your own risk
NATGASUSD exepcting higher bearish ocntinuation
ENTRY: 1.780
TP: 1.755
TP2: 1.735
TP3: 1.720
SL: 1.805
Chart time frame - 4H
Time for reaching TP - 1-2D
Follow, Like, Share or Comment
Thanks on supporting!
All best!

NGAS Posible longFormación de posible long en NGAS, hasta ahora lleva mucho momentum bajista, esperar rechazos y confirmaciones para posible entradas en long
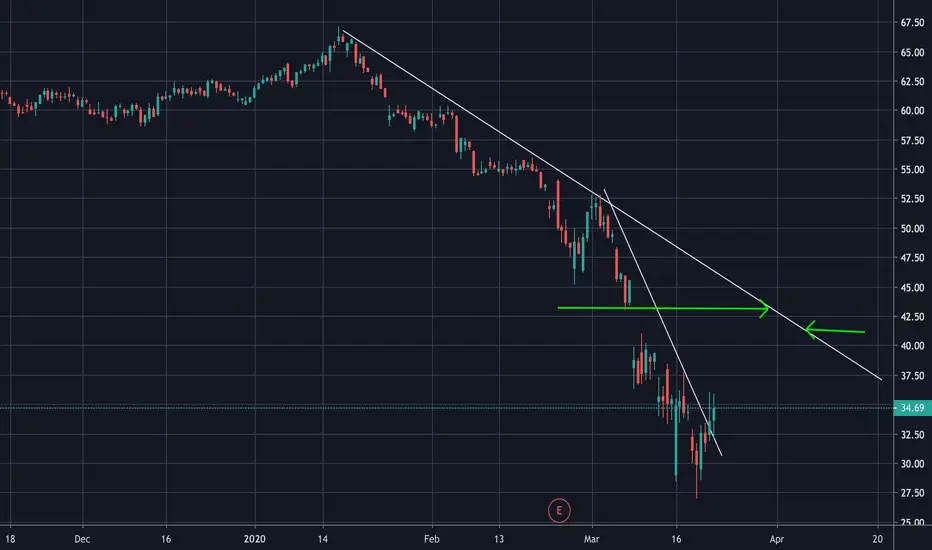
IS NATURAL GAS TOO CHEAP?expecting natural gas price to stabilize if equity markets can recover soon.

UPDATE NATGASUSD Short followed by LongFollowing on from my previous analysis, NATGASUSD has reached the short predicted, if follows my previous chart should now move north to around 2.125
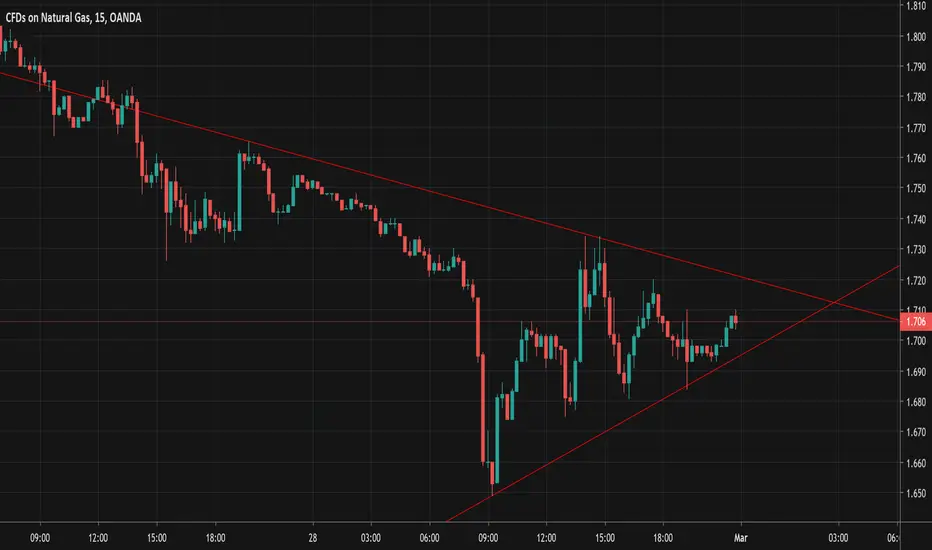
Interesting formation on Natural GasLet's see if it bounces again off that support area or just continues downwards.