NATURAL GAS
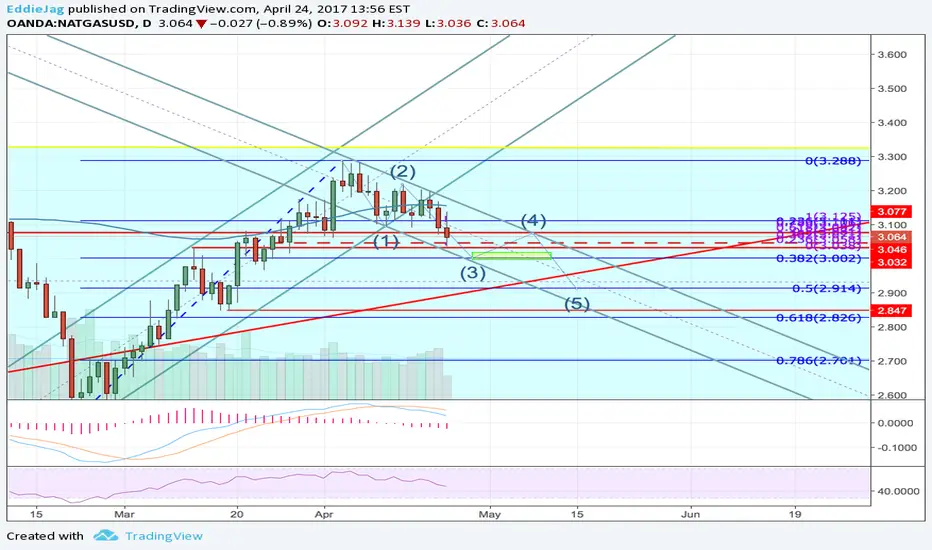
Natural Gas: Completed Cypher and 2x AB=CD in Oversold TerritoryThe current price is 3.065 (this chart is delayed) and I have just entered.

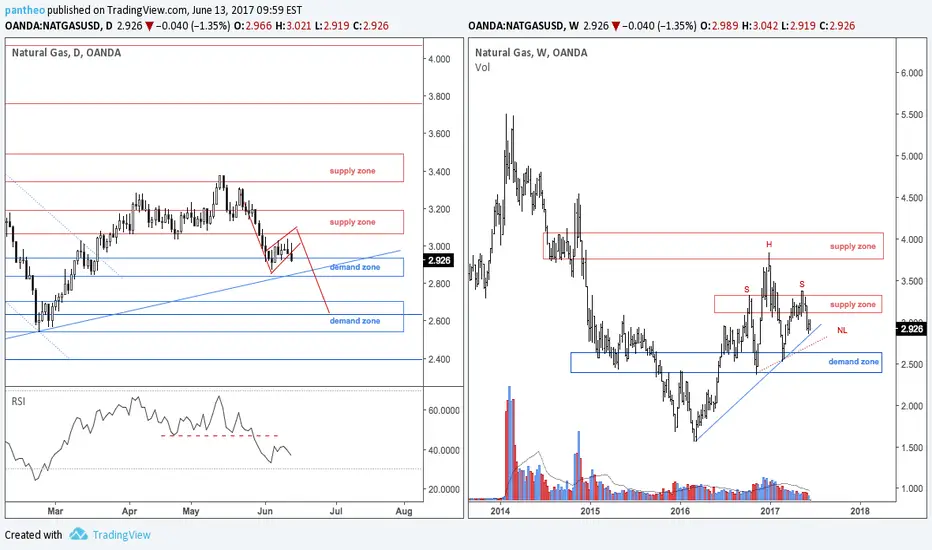
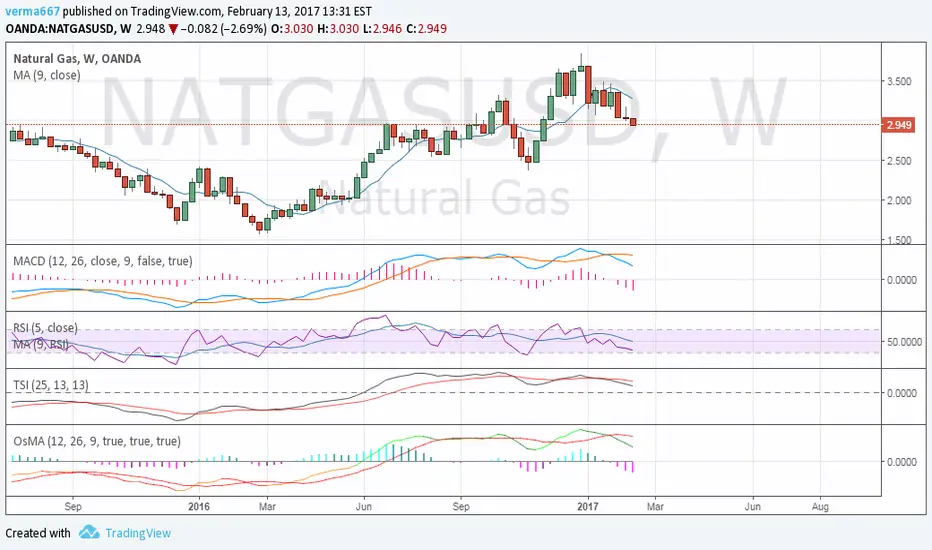
NATGASUSD Short Hello,
I think NATGASUSD is in for a bigger drop and report may be the catalyst .
Consider the scenario.
1. It consolidated in a range for a long time
2. Made a higher but was unable to hold gains
3. Second wave up after the last report failed to make a newer high
4. It closed on channel below the channel
5. Almost half the volume on the upswings and new highs
That's how I look at things. Trade accordingly. I'd wait until it hits the Declining channel then short. 3.315 would be my stop if I short at around touch of declining channel.
Will be a good risk/reward because I'd short it at touch of channel and stop at 3.315.
However, if it breaks the channel with conviction goes to set another high, this idea has failed it's validity.

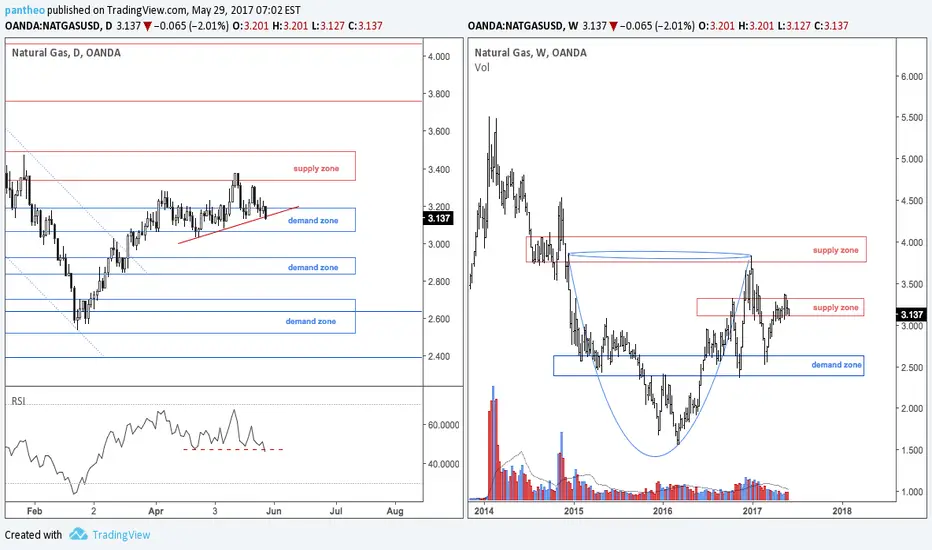
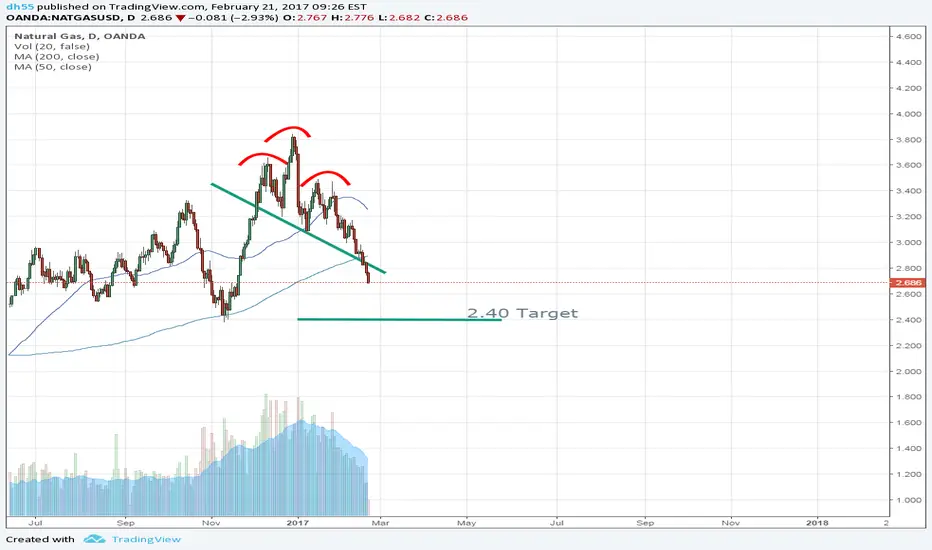
NATGAS UPTHTRUST (FALSE BREAKOUT)$UGAZ
IT IS AN UPTHRUST AND IS JUST PART OF THE CYCLE
IN A LONG TERM WE ARE IN A BULLISH ABCD PATTERN BUT FOR NOW WE ARE GOING TO ENTER IN DANGER ZONE ABC=D ENDING IN 2.50

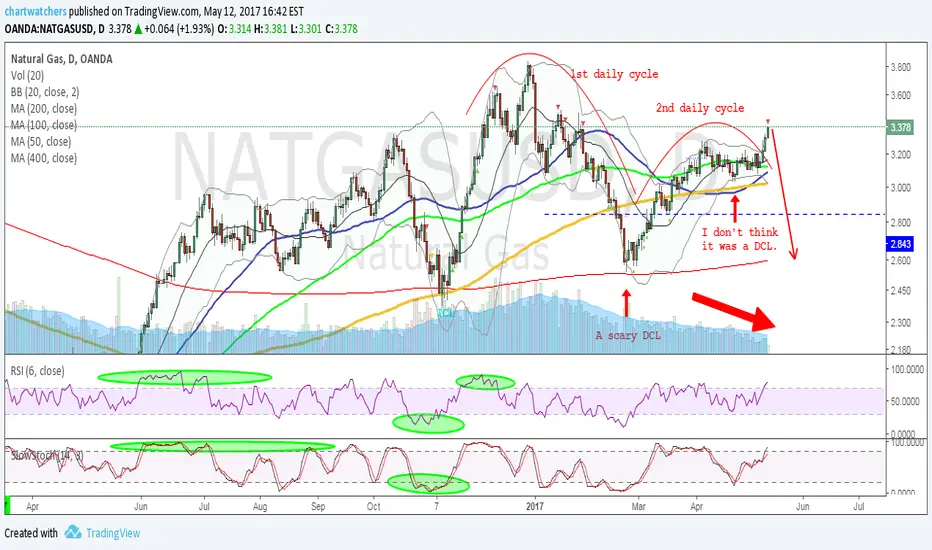
NatGas - Missed or Escaped?I got a few messages that we missed the NatGas rally. I'm not so sure about it...
Yes we missed this pop, but it looks fishy to me.
We are in the 2nd daily cycle of Natty and this daily cycle was not able to run to new highs. The previous daily cycle was a great run but the daily cycle decline was too strong... We got very close to the the ICL low at 2,4$. I was close to call a DCL at 24-25th April but after that scary first daily cycle low we should have had a steeper DCL...
Today's whole candlestick is out of the Bollinger Bands . This signal with the overbought RSI with decreasing volume is really strange.
So I think we are not at the beginning of a new daily cycle as many traders think, but we just topped today.
So I think we not missed the rally but escaped the possible false breakout of this consolidation.
If this is the case and we topped today this daily cycle is left translated daily cycle with a lower high which means a failed daily cycle.
Based on this speculation I will start a short trade in Natty here.
It's going to be a very small trade , with small margin impact : 2-3%, maximum 5%.
If I'm not right the volume will come in and we are breaking higher in the following few days but first price needs to get back between the Bollinger Bands . So we will still have time to stop out the position if we are in the wrong direction.
NEW SHORT ENTRY - up to 5% margin impact.
It's a very risky trade because Natty is a beast if it runs... If we don't reverse in 2-3 days and start a serious decline I will stop the position.
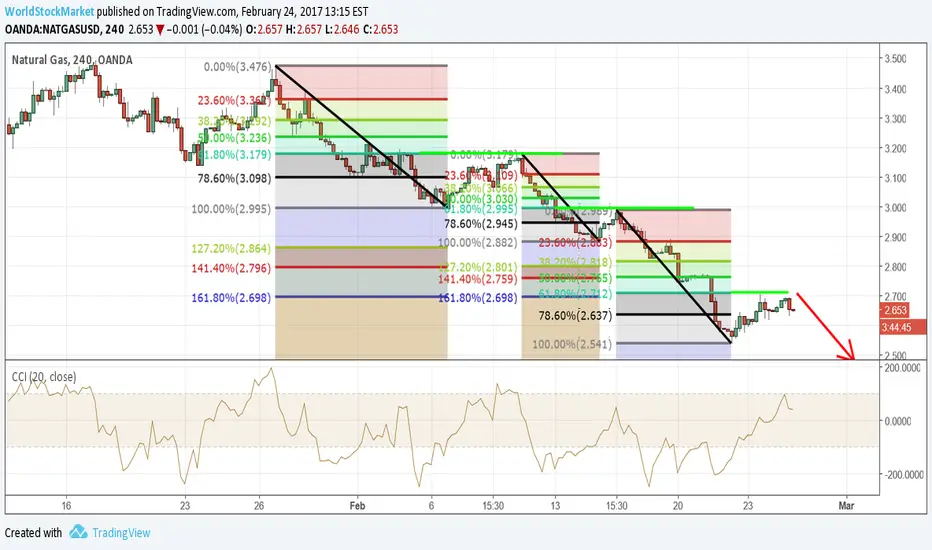
NG ShortHello,
Disclaimer-I'm new to all this.
This Up bar on daily had no volume compared to a previous Up bar we saw on 20 March 2017-(drawn for comparison). or 4 April 2017
I don't like to recommend anything but it's a requirement to post so ,
Stop loss -3.200 (if this seems too close, well it's a good placement so it'll make it clear pretty soon)
Potential loss of 360$ for gain of $1780 give or take commissions
Profit target is 2.986
That's it. I keep it simple.
Please trade accordingly.
NatGas Stalls at Key LevelNatural Gas stalled for the last 2 days and finally sold off today. There just wasn't enough power left in the recent bull move to climb above the 7 day moving average. Price is now wedged between the 7 and 21 day moving averages. If price does drop below the 21 day moving average, I expect that price would continue to at least the 3.00 level, which is the lower Bollinger Band.
Disclaimer: This post is for educational purposes only. Trading is at your own risk.

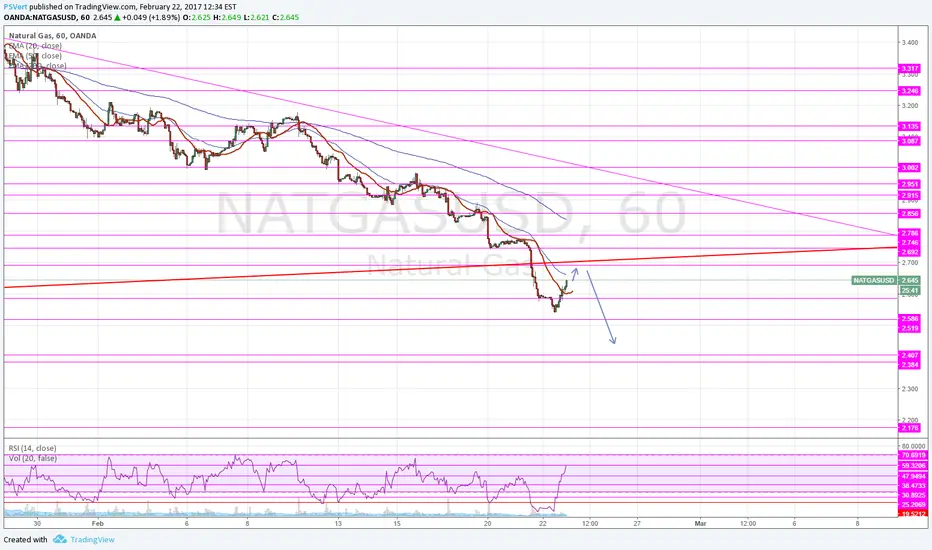
Suggestion for correction in NGASWe have broken the mid-uptrend line, and it seems like we will correct to the main one.
Probably we will find support at 2.875 and then we'll go up again.
Stay tuned.

NatGas, BOILLooking at NatGas here. Looks like we had a reversal a week ago, then a retest. I could see a good move here with little risk to the downside. Set your stops at Yesterdays lows. Should not test again. Upside target to the 200 ma

Natural Gas 2 Small Bullish Bats; Getting In On Large Bat This idea is in accordance with my larger term view of the very large Bullish Bat which completed last week @2.547 (idea linked below).
I missed that entry but patiently waited for a new pattern. Now I have found 2 bullish bat patterns to get me in to the (hopefully) longer term move. One advantage to this method is that the risk is much less than with the larger Bat...stop loss for me here is the red line @ 2.529.
I have entered at the first bat...will add a second contract if the price reaches the second Bat. Wish me luck!

Short NG for 4 to 5 days.NG is repeatedly going down and then retracing back to 28.3%. Its retrace is completed and is now expected to fall again.
Resistance 1 : 2.712
If resistance is broken and moved to 2.765 then reversal.. and go for long.
For now, SHORT.
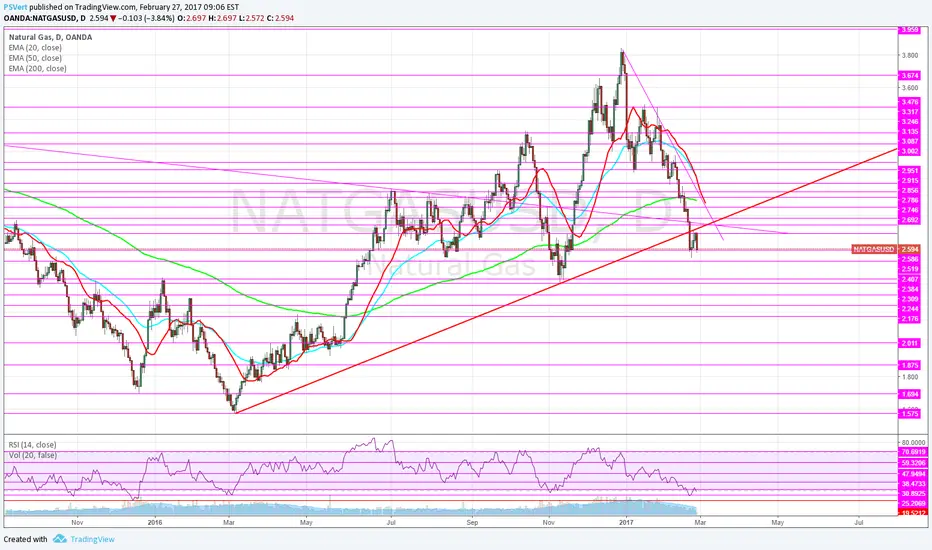
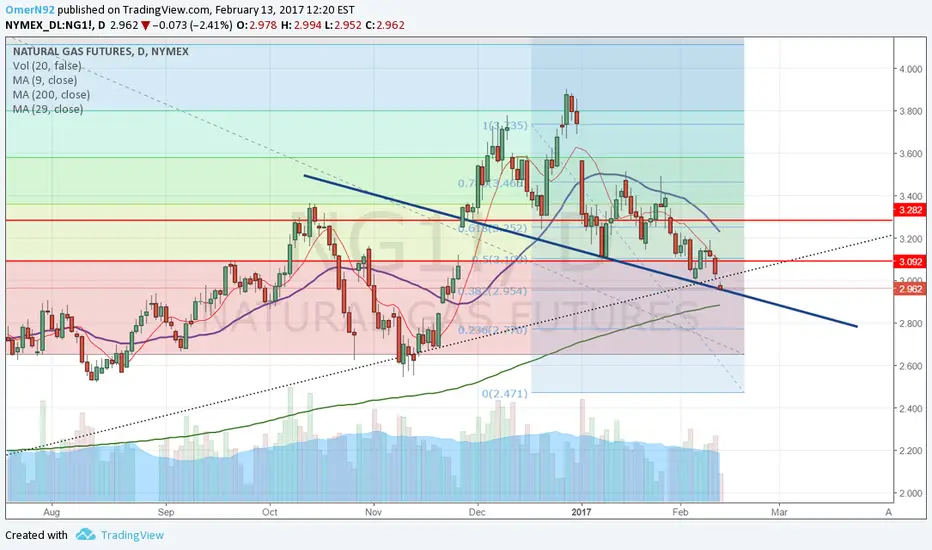
NATGASThink it can recovers to red trend line...then it could be good short again.......
I have and will not take positions See DAX prediction 2017 for details
NatGas LongRisky? Yes.
Potentially rewarding? Definitely.
This is a bull-market speculation trade -that NatGas is done with its consolidation phase.
Keep SL reasonable. I don't want to see sub 2.5 in this scenario.

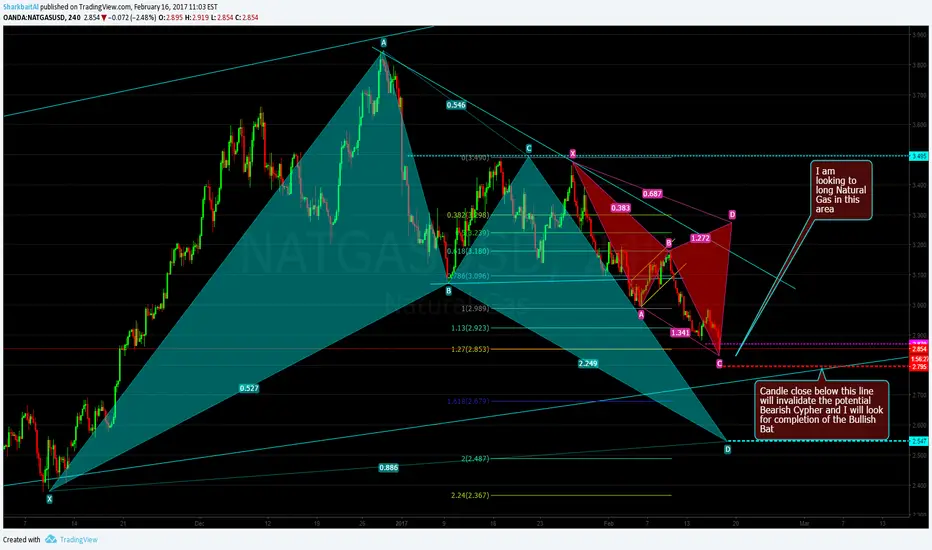
Natural Gas May Complete a Bearish Cypher or Bullish Bat (4H)Looking to long where indicated in the chart. In this scenario I will then watch for a short at the Cypher completion point.
If price closes below the red dashed line I will abandon longs until the completion of the Bullish Bat.
NGAS is strugglingNGAS broke down the support line (black dots), but finds support at 0.382 fibonnaci and some trend line I found.
I wouldn't like it to meet the 200MA, but if it will break down from that support- it might happen.
it will rally on the following days, that's for sure

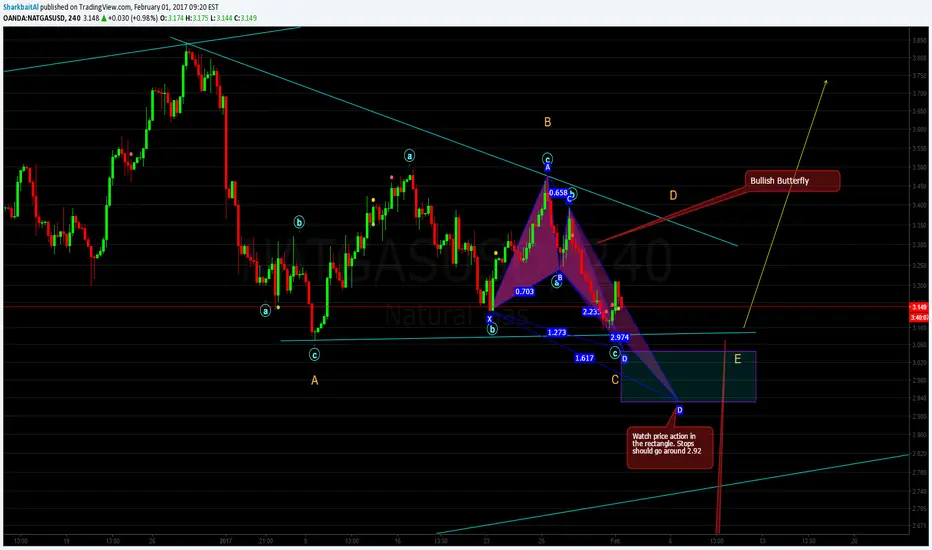
Natural Gas: Watching For Triangle or Bullish ButterflyEverything is pretty much shown in the chart. I have heard Natural Gas is hard to technically analyze but in my limited experience patterns seem to work pretty well.
---If price continues to the top trendline, I will look to see if it forms in 3 waves. If so, I will be more confident this is a triangle and will look to long around the E point (perhaps right after a break of the lower trendline)
---If price instead goes down from here I will watch the rectangle which is the completion of the potential Bullish Butterfly pattern.
---- Note : both of these scenarios can play out concurrently, which would make me feel even better for this trade!
I am always happy to receive any comments and/or feedback in my ideas. Good luck!
Natural Gas May Complete a Short Term AB=CD PatternEarly this morning Natural Gas broke the trendline and has begun to consolidate. Thus I am short-term bearish on Natural Gas and looking for sell set-ups.
I usually stay off of the 15 minute for trade ideas but as this is coherent with my short term analysis for this pair I will look to take this trade. The bearish AB=CD pattern may complete around the .5 retracement of this impulse down which would be a nice location for the short.
Once in the trade I will watch the recent bottom around 3.34 to depend whether I will take profit or hold for further targets (3.297 or beyond).
**This is not meant to be a trading signal so please do not use it as one -- I still have very much to learn as a trader and none of my ideas are trading advice. That said I always appreciate any comments and feedback on my charts and ideas!**
