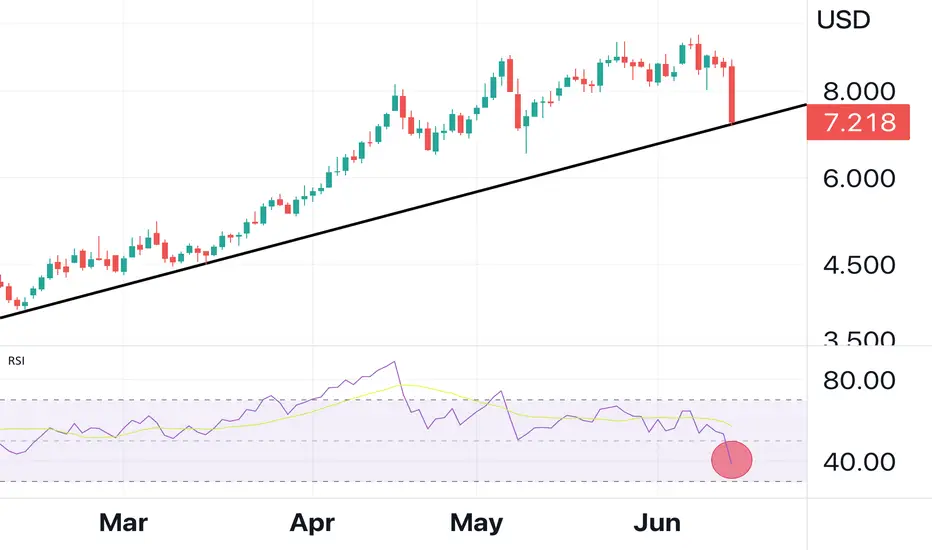
US Natural Gas Had Its Worst Day Since 2018: RSI falls Below 50US natural gas prices posted their worst daily performance since mid-November 2018 today, plummeting 17% to $7.2/MMBtu, as of writing, after Freeport LNG announced early Tuesday morning that it does not expect the export facility to resume full plant operations until late 2022 due to the explosion occurred on June 8.
The Freeport LNG facility has a production of 2 billion cubic feet per day, or around 16% of US LNG export capability, and has been operating at near full capacity in recent months.
The disruption at one of the largest US liquefied natural gas export terminals will put a severe upward pressure on European gas prices ( Dutch TTF ), which have been falling in recent months as Europe has significantly increased its liquified natural gas imports from the United States.
Technically, US natural gas prices are now testing the 2022 bullish trendline, with the momentum indicator (14-day RSI) dropping to 38, the lowest level since the start of the year.
A breach below the psychological threshold of $7/MMBtu would open the door for a bearish assault to the nearest support in the 6.50 zone (lows of April 25 and May 10).
NATURAL GAS
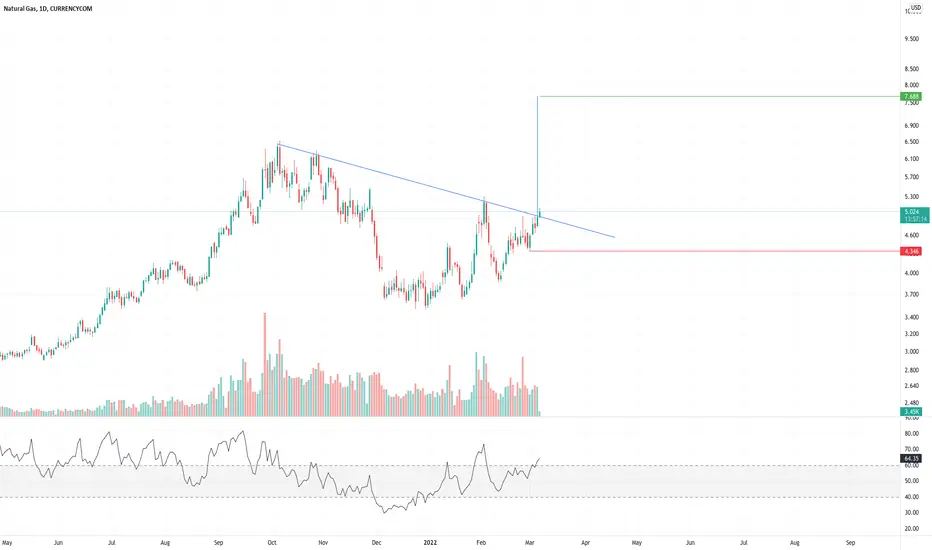
#NATGAS - Surely not?Hi all!
This chart is pretty self explanatory and tells a lot of potential stories.
As we all know, NATGAS is a beast of it's own and often technicals are embarrassed by NATGAS movements.
But considering inflation, whispers of war, absurd weather, perhaps this isn't as crazy as it sounds.
Anyhow, I really wanted to put this out there as a lot of technical indicators are suggesting a bull run.
Weekly and Monthly RSIs are both towards oversold and the current political and economical situations point at a commodity bull run, especially is Oil and NatGas.

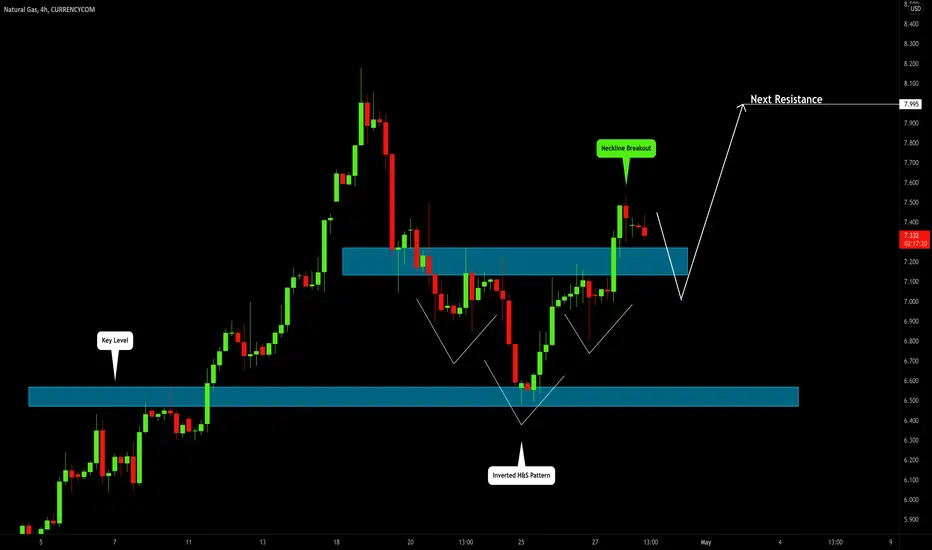
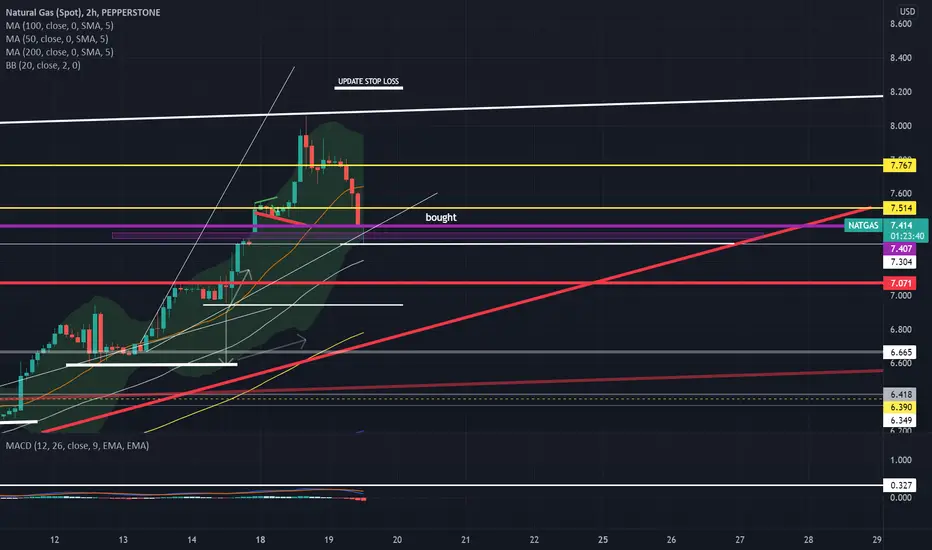
Natural Gas (NATGASUSD): Can We Go Higher? 💨
As I predicted, Natural Gas perfectly bounced from a key level.
Now we see an inverted head and shoulders formation with a confirmed neckline breakout on 4H.
I believe that the price can reach 8.0 level soon.
Be ready
❤️If you have any questions, please, ask me in the comment section.
Please, support my work with like, thank you!❤️
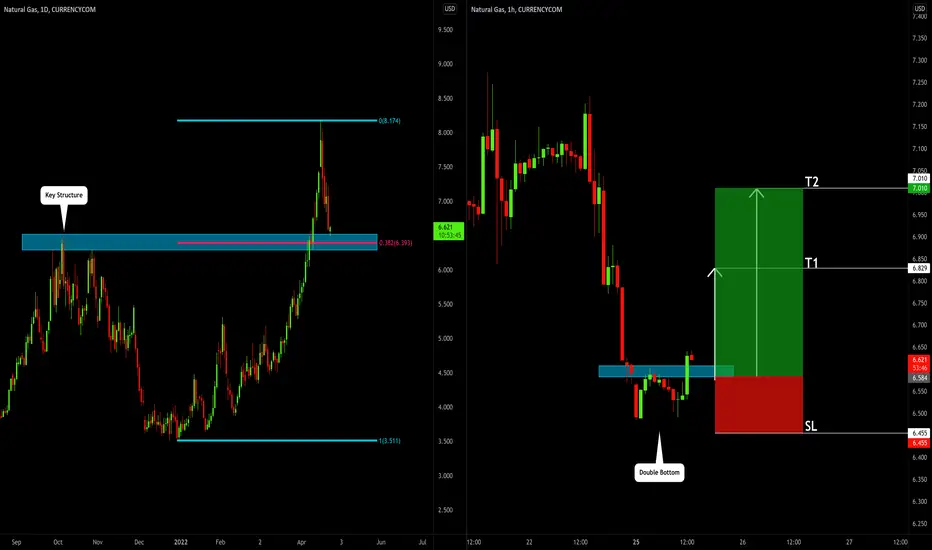
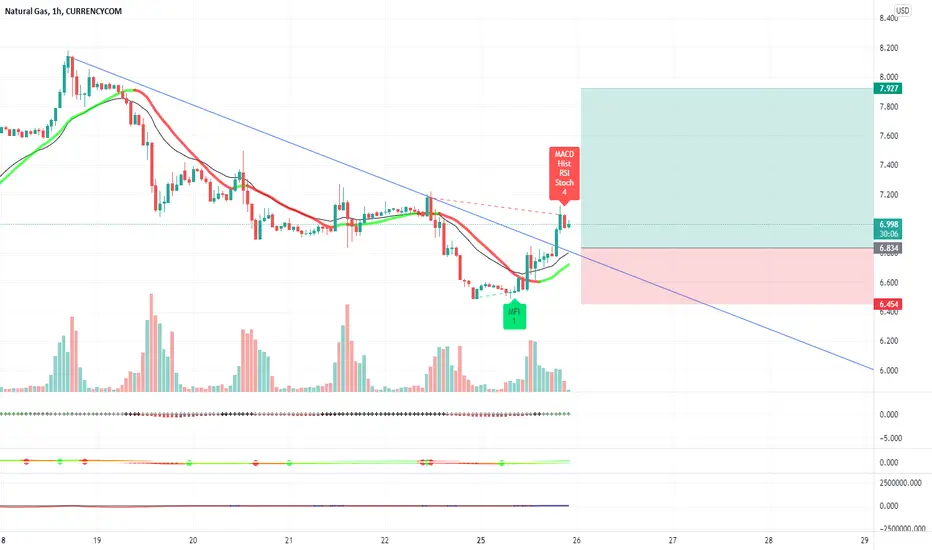
Natural Gas (NATGASUSD): Time to Grow AGAIN?! 💨
This morning with my students we discussed a great buying opportunity on Natural Gas.
The market dropped to key daily structure support.
On that, the price formed a tiny double bottom formation on 1H time frame.
Taking into consideration that the market is trading in a sharp bullish trend,
it can be a very nice confirmation to buy the market.
Goals:
6.825
7.0
❤️If you have any questions, please, ask me in the comment section.
Please, support my work with like, thank you!❤️
Quick deal on natural gas 16% profit for 5.5% Stop Loss "3:1"simple analysis
Trend lines have been relied upon
and volume analysis
and moving averages
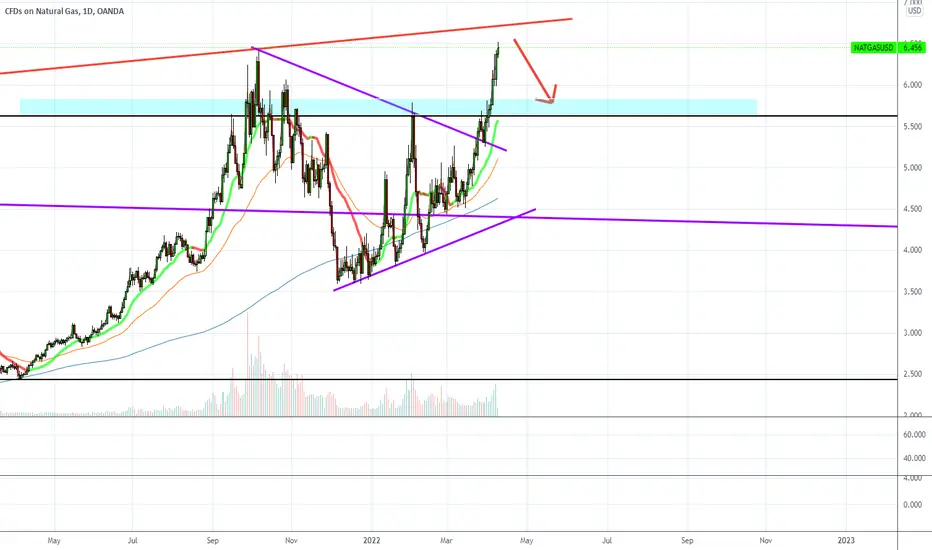
NATURAL GAS 📉📉📉Expecting bullish price action on this pair but simply on a fundamental reason, price tapped on 7.0$ institional figure taking out some retail stops below this price area and for now we are going for the ATH - ALL TIME HIGH.
What do you think ? Comment below..

Natural GasOk, So down 5% on the day, but I think its found its base... lets see if the market makers continue this lovely Ladder.
NatGasUsd: Double top or just a 0.5 correction? I suppose natural gas is one of the most dangerous assets, so if you trade it (any side) be very careful. Not for beginners or those who don't tolerate high risk trades.

$UNG $KOLD $BOIL Key Levels, Analysis, & Targets$UNG $KOLD $BOIL OMG Key Levels, Analysis, & Targets
Try it, Natty… hit 40 (ung) and I’ll short the hell out of you…

Natural Gas (NATGASUSD): The Situation May Become Worse 💨
Update for Natural Gas.
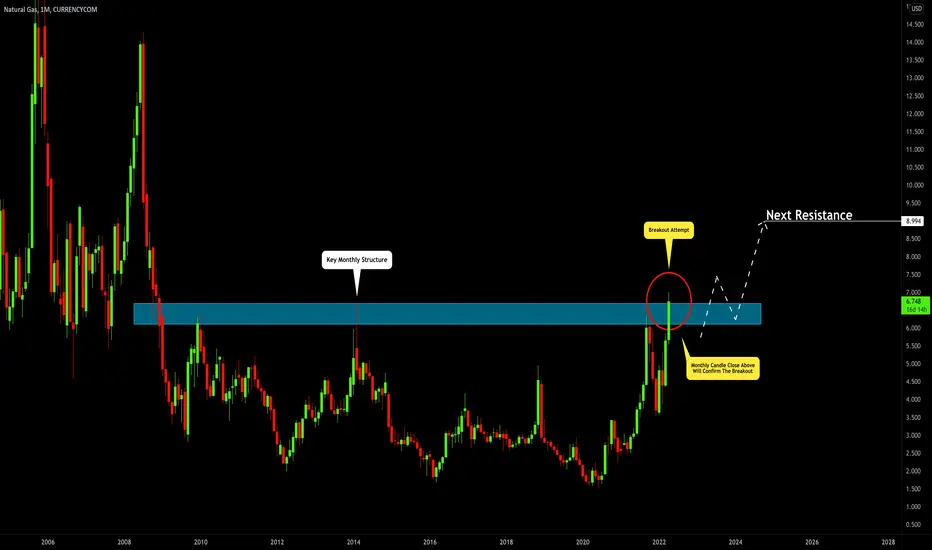
This week the market set a new higher high higher close on a daily violating a previous high.
Analyzing a monthly chart we may see a breakout attempt of 6.07 - 6.70 structure resistance cluster.
Monthly candle close above that zone will confirm a breakout and may lead to a strong bullish rally.
Next resistance on focus will be 9.0 level.
Be prepared for bullish continuation traders.
❤️Please, support this idea with like and comment!❤️
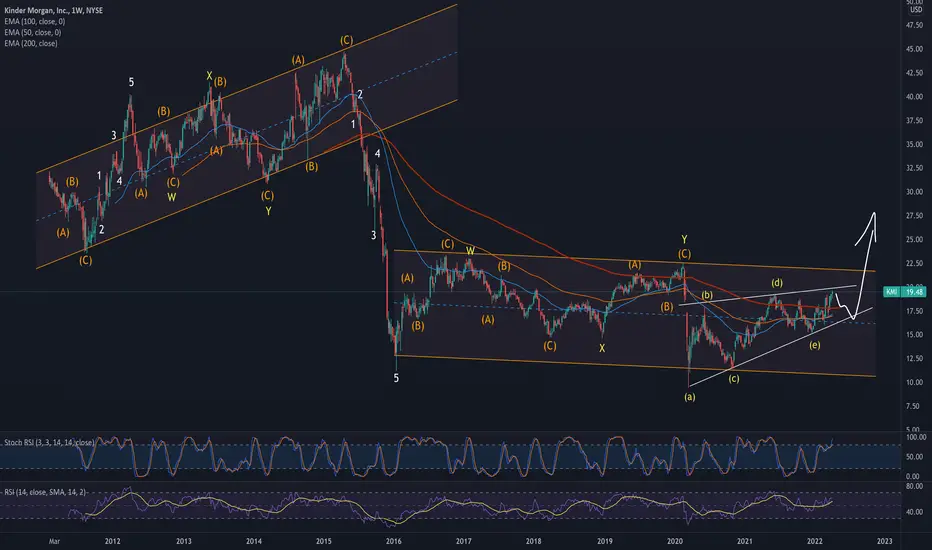
KMINat Gas looks to be entering a LT bull Market. Kinder Morgan is a huge Nat Gas corp. I'D say they will perform very well into the strength of the Nat Gas bull Market. Dips around $16.55 could be a buy if that price holds as support.
Natural Gas (NATGASUSD): Key High Ahead! What is Next?! 💨
Technical analysis on Natural Gas.
Potential scenarios & things to watch.
Structure analysis & thoughts.
❤️Please, support this video with like and comment!❤️

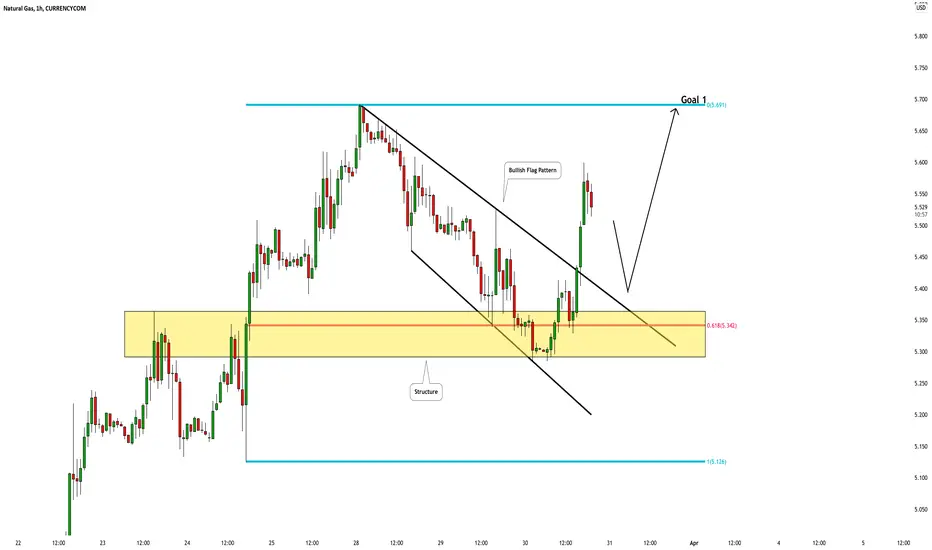
Natural Gas (NATGASUSD): Did You See That Confirmation? 💨
Update for my yesterday's post on Natural Gas:
the price retested a broken supply area and I spotted a very nice confirmation.
The market broke a resistance line of a bullish flag pattern.
Now you can wait for an occasional retest to buy expecting a bullish movement at least to 5.68 level.
❤️Please, support this idea with like and comment!❤️
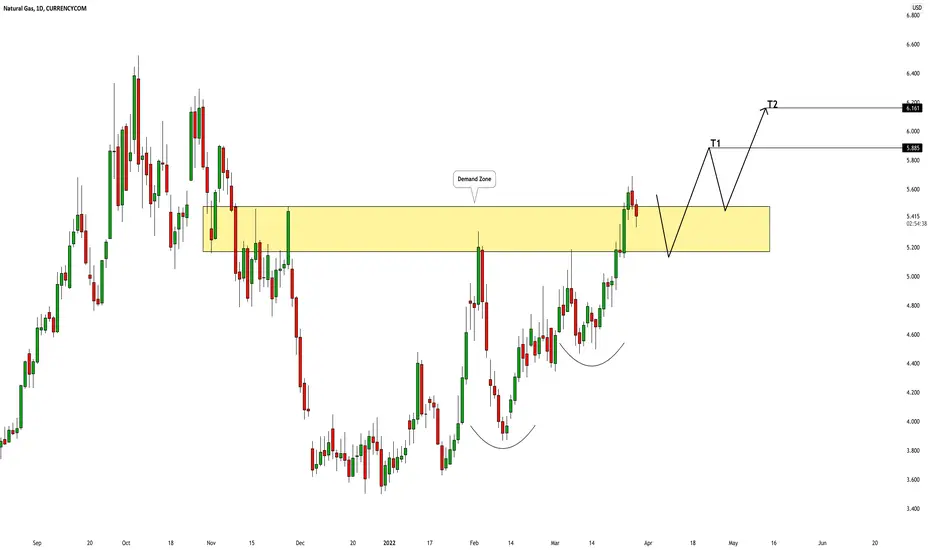
Natural Gas (NATGASUSD): Important Breakout & Bullish Outlook 💨
Hey traders,
After a very nice bullish accumulation,
natural gas broke and closed above a strong supply area on a daily.
I believe it will trigger a bullish continuation to the next resistance.
Goals:
5.885
6.16
❤️Please, support this idea with like and comment!❤️
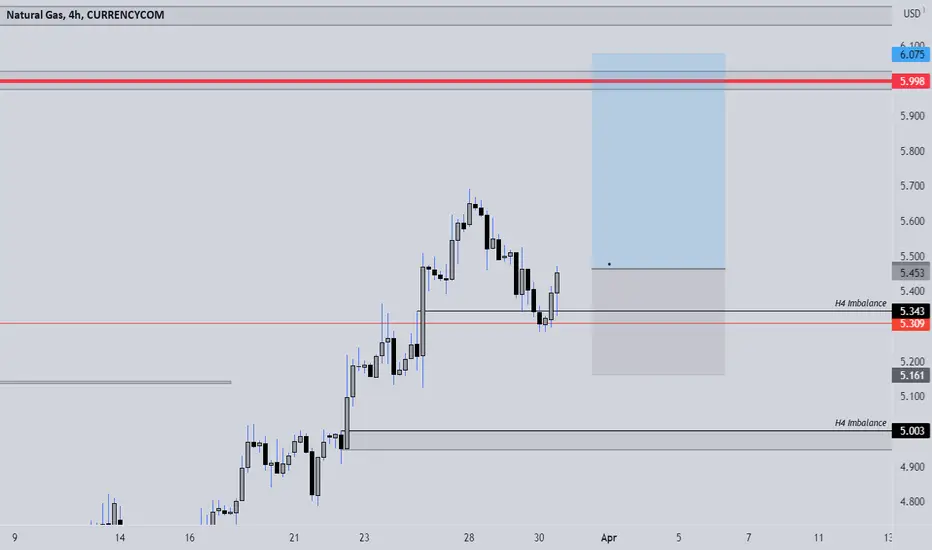
NATURAL GAS LONGS ACTIVE 📉📉📉📉 Expecting bullish price action on NATURAL GAS as price is in a clear bullish market strucutre on D1/H4 timeframe, price made a breakout above the weekly highs retraced back into the H4 imbalance testing the weekly highs and clearly reject from that area. I think we will see 6.0 ASAP.
From a market seasonality standpoint we are very bullish as naturalgas should rise in this period of the year + the problems between the Russian Federation and European Union about the gas delivery in the Europe.
What do you think ? Where we go next ?
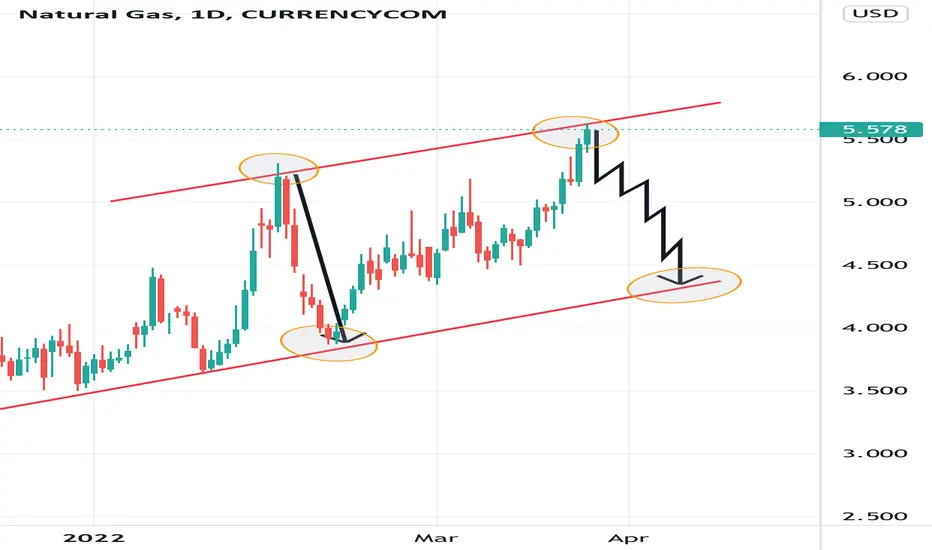
Natural Gas to drop!Here's the Daily chart of Gas downtrend! 1.0 is would be a healthy trend channel!
USGAS TAKE PROFIT HIT 📉📉📉📉 I CLOSED ALL TRADES IN PROFIT ON USGAS, we are still bullish on this asset from a fundamental/tehnical analysis context. My last target for this asset is 6.0,i think we will go there but not before price makes a retracement back into 5.0 institutional figure H4 Imbalance + bullish orderblock area.
What do you think ? Do you agree on my analysis ?

Ng long termsince few days now this is laging and struggkin to bypass 5.000 ill keep my 2.500 tg before any higher move!
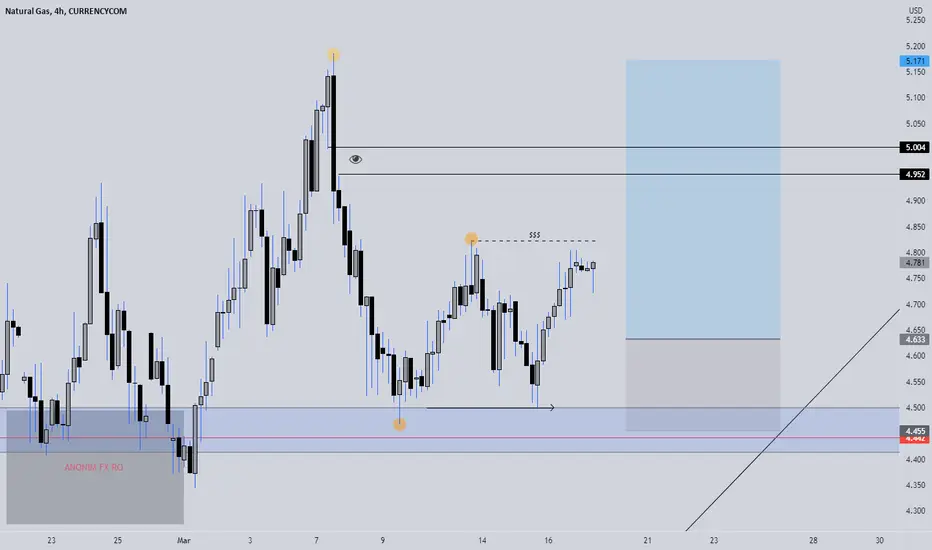
NATURAL GAS LONGS 📉📉📉📉 Expecting bullish price action on NATURAL GAS from a medium-long term perspective as we are in a HTF BULLISH MARKET STRUCUTRE, price kept the 4.5 psychological barrier without breaking it to the downside, we have bearish imbalances somwhere around 5.0 that should magnetize price back there, Market Seasonality is very bullish on chart as we have a BULLISH CYLCE + the fundamental context makes me thing we will go higher. I think in the next 2-3monts we will have a huge problem with supply/demand because Russia advised European Union of higher prices on GAS.
What do you think ? Comment below...
NATURAL GASThere was a big ending diagonal and the price broke out from top and there is pullback you can see in the chart. another reason is fundamental analysis, Russian war and sanctions can grow the price of NATURAL GAS.
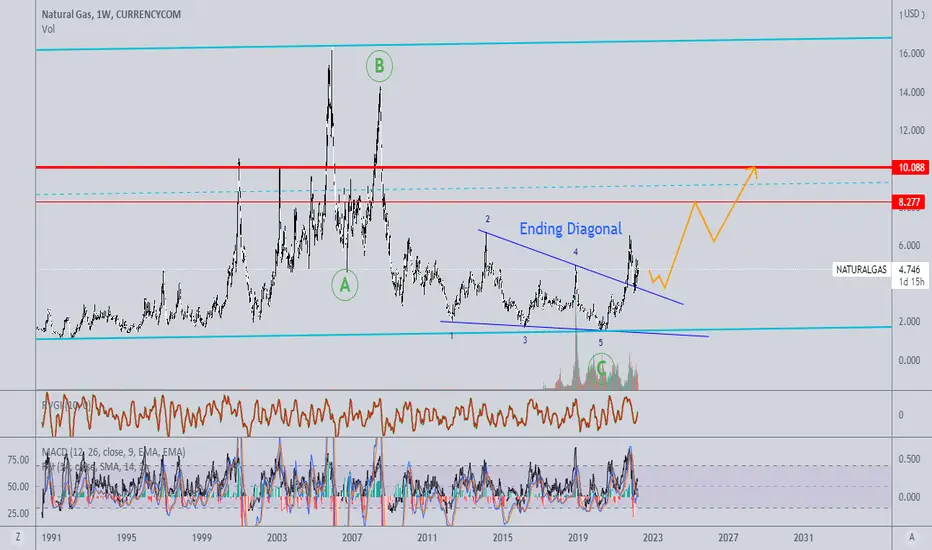
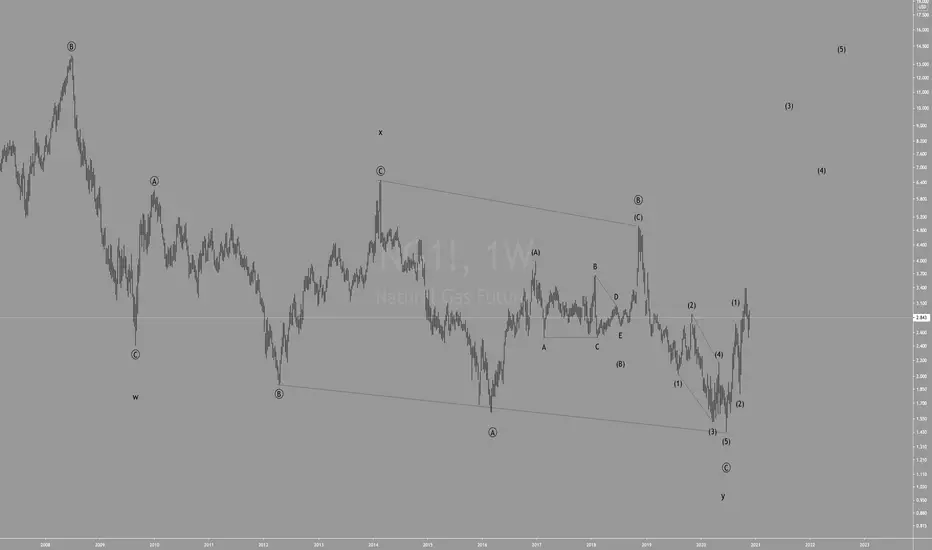
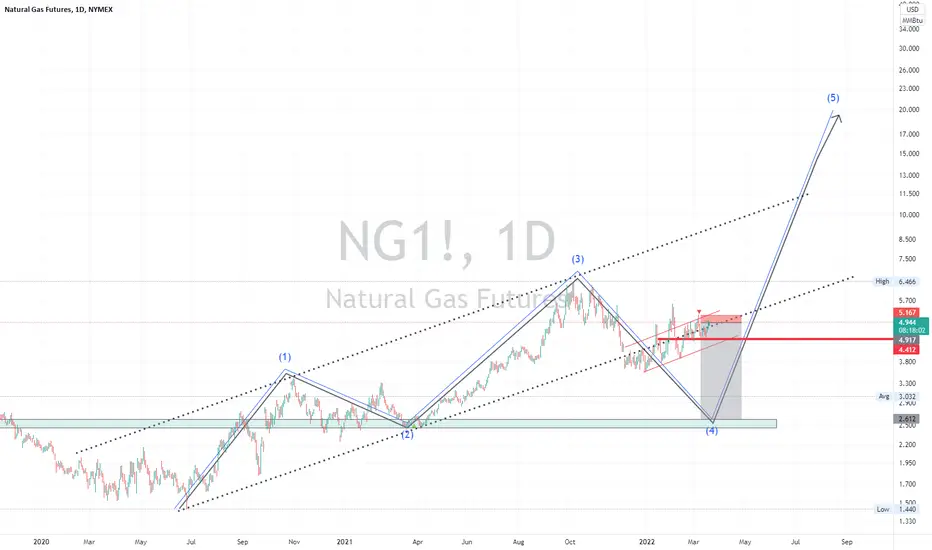
Natural Gas (NYMEX) - Weekly UpdateNatural Gas - Weekly
Bottom Line : "Big-picture" Bullish.
Repeating : The higher probability view is to label the Primary wave ((C)) decline as an ending diagonal to complete Cycle y . Ending diagonals are terminal structures. They are typically followed by swift reversals that retrace the entire length of the pattern. There’s not enough historical price data to confidently assess the wave degrees above Cycle, but a multi-year rally from the Cycle wave y low is likely to retrace the bulk of the decline from the 15.78 all-time high set in 2005 .