U.S. NATURAL GAS SUCCESSFULLY REBOUNDED FROM FIRM SUPPORT.U.S. NATURAL GAS SUCCESSFULLY REBOUNDED FROM FIRM SUPPORT.
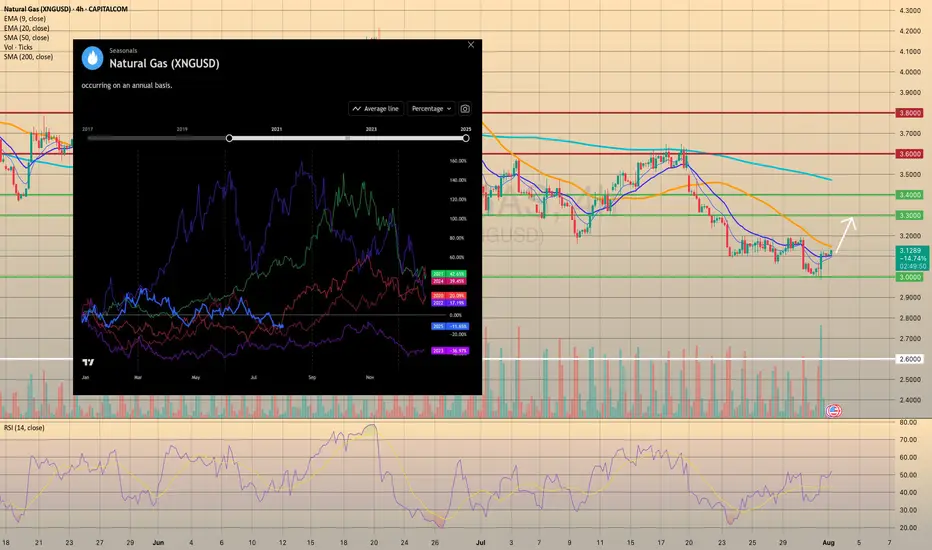
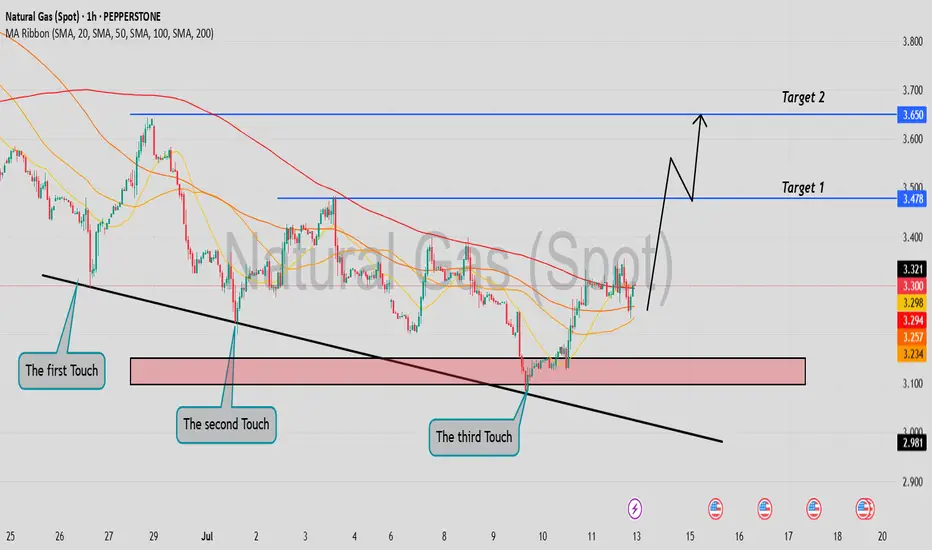
Yesterday the natural gas storage report came out higher than expected. U.S. natural gas inventories increased by 48 billion cubic feet last week to 3,123 Bcf, increasing the surplus over the five-year average to 195 Bcf from 171 Bcf the week before, the EIA reports. The storage increase was bigger than the 24 Bcf average for the week, and above the 36 Bcf estimate. However, the price rised on 2.35% afterwards, supported by increased volume, which indicates the strength of the level. The upward movement towards the 3.3000 level is highly expected.
Additionally, seasonals suggest us that current prices may become the lowest till the end of the year. Historically, since August the natural gas prices increase in anticipation of a new heating season and higher energy demand (pic2).
Natural Gas
Natural Gas Bullish Reversal...Are the Lows in?U.S. natural gas inventories increased by 48 billion cubic feet last week to 3,123 Bcf, increasing the surplus over the five-year average.
Consensus / forecast was 37Billion Cubic feet.
Despite a much higher build than expected Nat gas saw positive price action.
This appears to simply be a dead cat bounce before we go lower.
A death cross on the daily chart has occurred. This signal often results in a small bounce before going lower.

Sell NATGAS into OCT/NOVNatalie has fromed a H&S and has broke through all of the supporting EMAs leading to most of the indicators turning bearish.
My approach for the forseeable is seeling bounces until the winter season approaches.
Of course Natalie is extremely susceptible to trend changes due to economical data and has to be monitored closely. Currenlty I'm a bear.
Only selling once it breaks and retests, where I will once again reasses based on economics such as storage, production, imports and demand.
Target around $2.5 where interestingly a gap (red rectangle) sits from Nov - 24.
Elliot Wave (although not a great fan) kind of aligns as well as the 0.786 fib level which began forming at the beginning of 2024.
Storage | Volatility | Price Outlook
U.S. natural gas markets are stabilizing as volatility trends back toward seasonal norms.
📉 Volatility has dropped from 81% in Q4 2024 to 69% in mid-2025
🏪 Storage is currently at 3,075 Bcf,
🔻 4.7% lower YoY
🔺 5.9% higher than the 5-year average
🚢 LNG exports remain strong—up 22% YoY and 74% above the 5-year average
🔌 Domestic demand is seasonally weaker but steady
➡️ Despite being below last year’s levels, storage surplus vs. the 5-year average acts as a soft ceiling on price.
➡️ Historical analogs suggest a fair value range between $2.50–$3.20/MMBtu in the short term.
📊 Current price action around $3.00–$3.40 looks slightly overheated unless a fresh catalyst emerges (heatwave, export spike, etc.).
🧭 Watching for:
Injection trends over the next few weeks
Cooling demand in power sector
Resistance around $3.40
Support near $2.80

XNGUSD CONTINUES ITS DOWNWARD TREND. FOR HOW LONG?XNGUSD CONTINUES ITS DOWNWARD TREND. FOR HOW LONG?
Recent bearish impulse started at the beginning of this week may come to an end soon. Yesterday the U.S. Natural Gas Storage report came out. Numbers appeared to be lower than expected and lower than previous. (23b vs 28b vs 46b). This is bullish signal for the market participants. Minutes after the report came out, market reacted bullish, however, soon price went sideways.
Right now gas prices continue to decline. Still, the opportunity for short-sellers here is quite limited. Not so far below there is a level of 3.0000, form where I expect the price to rebound, supposedly to a 3.3000.
NATURAL GAS REACHED THE KEY SUPPORT LEVEL. WHERE TO GO NEXT?NATURAL GAS REACHED THE KEY SUPPORT LEVEL. WHERE TO GO NEXT?
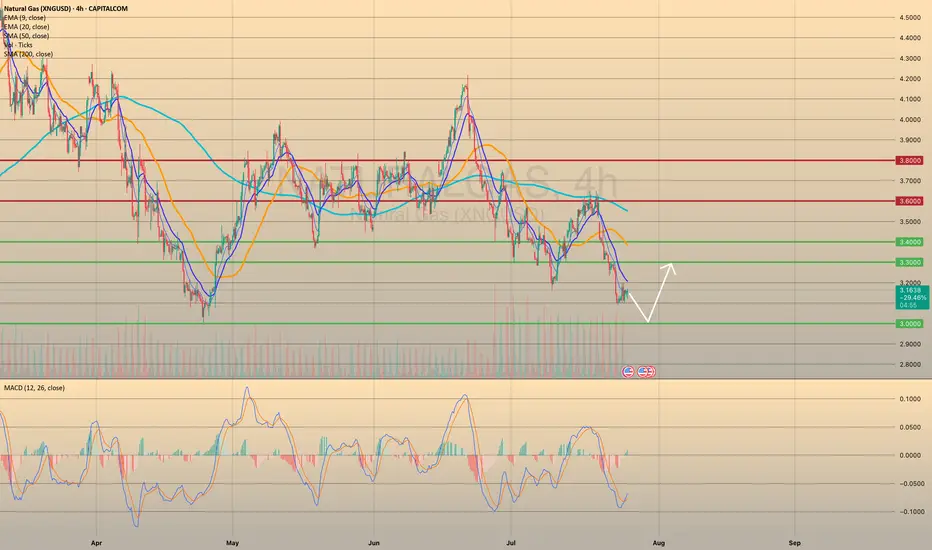
XNGUSD has come to a crucial support level of 3.0000. Although the sentiment here stays as quite bearish (seasonally, August is not the perfect month for natgas buyers), we expect the price to rebound from the level of 3.0000 towards 3.3000 first. Afterwards, the continuation of bearish trend is expected with final target of 2.6000 before cold season beginning.
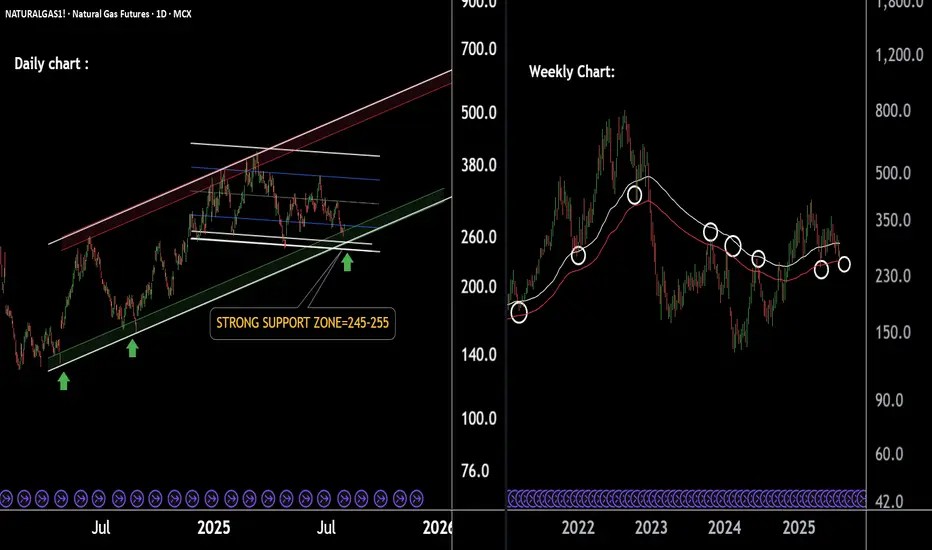
Natural Gas Cooling Near Support Zone – Bounce Ahead!Natural Gas Technical Overview (2-Chart Analysis):
Chart 1 – Parallel Channel Formation:
Natural Gas is moving within a well-defined parallel channel.
The lower support boundary of this channel is observed near 250, indicating a potential bounce zone.
Chart 2 – EMA-Based Support Structure:
Price is currently sustaining above key EMAs, reflecting short-term strength.
The last EMA support lies around 252, acting as an additional support confluence.
If this level is sustain then we may see higher prices in Natural gas futures.
Thank you !!
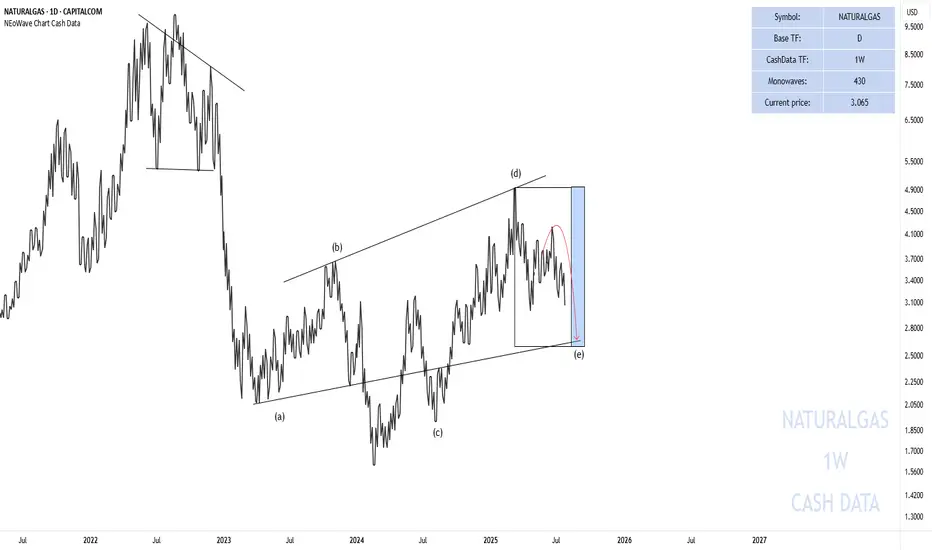
End of the Wave-(e) Natural Gas
In the previous analysis I said that:
Currently, wave-(e) is forming and I do not expect a strong upward movement until August 12-September 12 and this wave can take time until the time range I specified for it.
In the picture you can see that the price has started to decline again exactly from where we specified and has fallen by 27% so far. The price is not necessarily going to fall to 2.66 but time must pass and the price must enter the specified time range.
Good luck
NEoWave Chart
Natural Gas | Oil | Dollar | Silver | Gold Price Forecast.Natural Gas | Oil | Dollar | Silver | Gold Price Forecast.
NYMEX:NG1! AMEX:UNG NYMEX:CL1! COMEX:GC1!

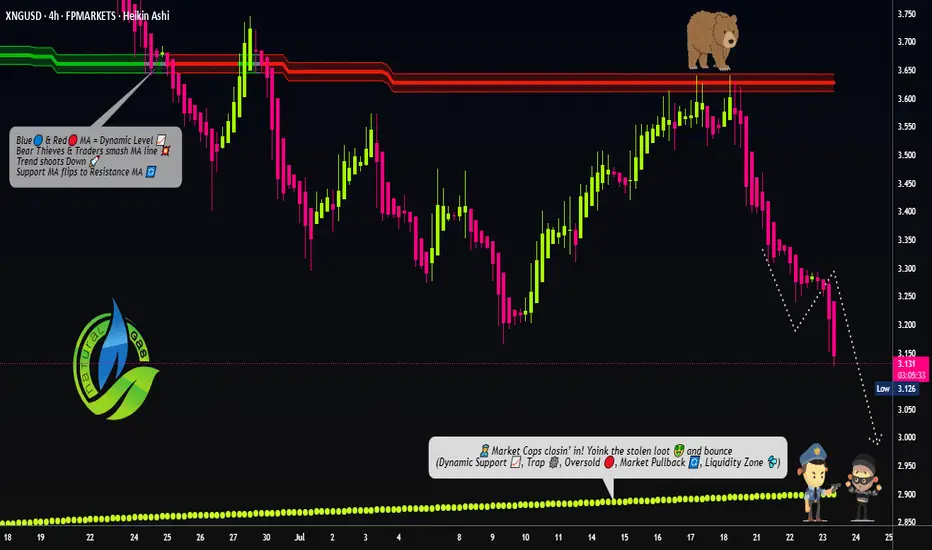
"NATURAL GAS PRICE THEFT IN PROGRESS – JOIN THE HEIST!"🔥 XNG/USD HEIST – BEARISH LOOT AWAITS! SWIPE & ESCAPE BEFORE THE COPS ARRIVE! 🔥
🌍 Greetings, Fellow Market Robbers! (Hola! Oi! Bonjour! Hallo! Marhaba!) 🚔💸
🚨 Mission Briefing:
Based on 🔥Thief Trading Intelligence™🔥, we’ve identified a prime robbery opportunity in the XNG/USD (Natural Gas) Energy Market. Our Bearish Heist Plan is locked & loaded—long entries are a trap, and the real loot lies in the downside escape.
🎯 Heist Strategy:
Entry (Swipe the Loot!) 🏦
"The vault is cracked! Bears are distracted—time to steal!"
Sell Limit Orders preferred (15m-30m pullback entries).
DCA/Layering Strategy for maximum loot efficiency.
Stop Loss (Escape Route) 🚨
SL at nearest swing high (4H basis) – 3.480 (Day/Swing Trade)
Adjust based on risk tolerance, lot size, & number of orders.
Target (Police Evasion Zone) 🎯 2.900 (or earlier if cops close in!)
🔪 Scalpers’ Quick Heist:
Short-side scalp ONLY!
Big money? Go direct. Small stack? Join the swing robbers.
Trailing SL = Your Getaway Car! 🚗💨
⚡ Why This Heist? (Bearish Forces at Play)
Fundamentals: Oversupply, weak demand, storage glut.
Technicals: Overbought, trend exhaustion, reversal signals.
Sentiment: Bulls are overconfident—perfect trap setup!
📰 Breaking News Alert (Stay Sharp!)
High-impact news = Volatility spikes!
Avoid new trades during releases.
Trailing SL = Your Shield. (Lock profits before the cops raid!)
💥 BOOST THIS HEIST!
👉 Hit LIKE & FOLLOW to fuel our next robbery! More loot = More strategies! 🚀💰
⚠️ WARNING (Legal Escape Plan):
Not financial advice!
Your risk, your loot.
Markets change—adapt or get caught!
🤑 NEXT HEIST COMING SOON… STAY TUNED, ROBBERS! 🐱👤🔥
XNGUSD Technical Update – What the Chart Is Telling Us NowIn this video, I break down the current XNGUSD (Natural Gas) chart using pure price action analysis on the daily timeframe.
This update builds on my previous post, where I shared a comprehensive outlook supported by fundamentals, including supply/demand imbalances, geopolitical risks, and long-term LNG export growth.
In this video, I focus purely on the technical picture—highlighting key levels, market structure, recent consolidation, and where I see potential opportunities unfolding next.
📈 If you're trading or investing in Natural Gas, this is a must-watch update to stay in tune with the current market dynamics.
Remember: This is not financial advice. Always do your own research and manage risk appropriately.

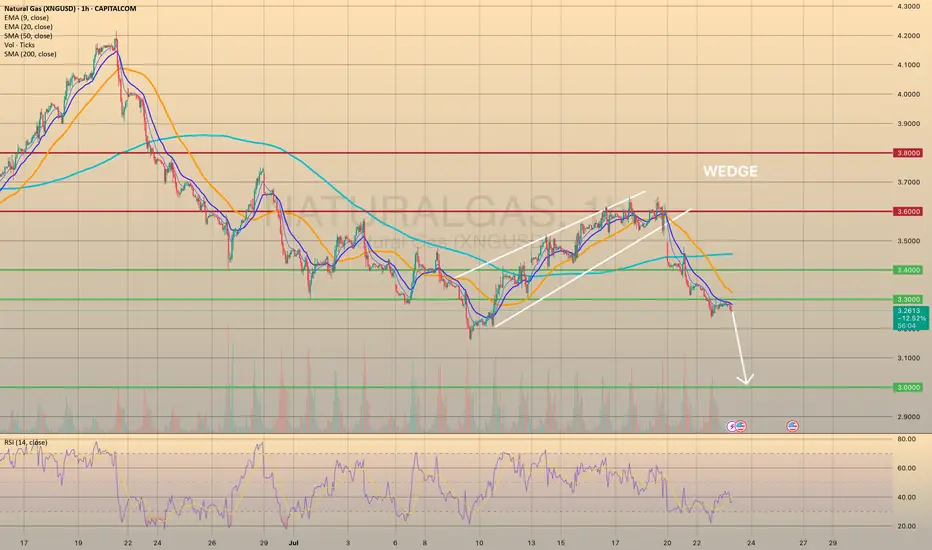
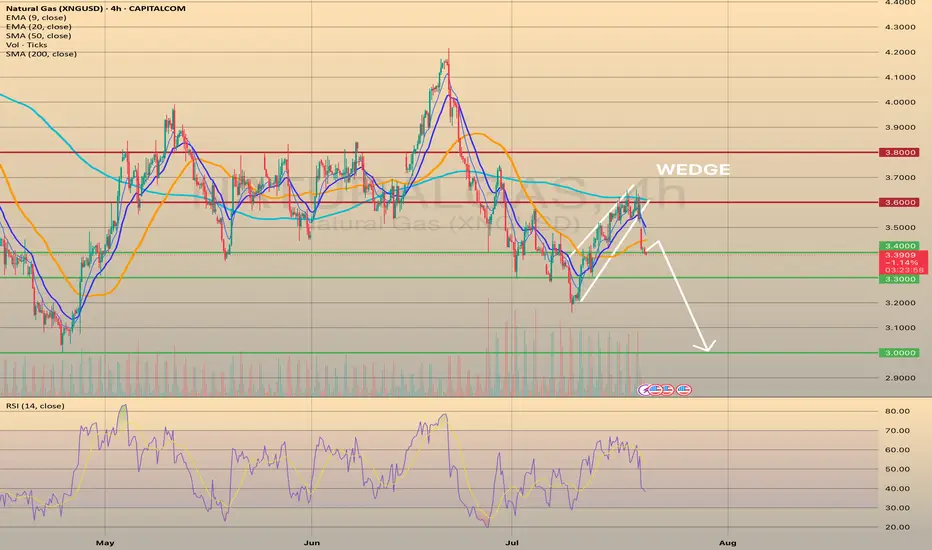
XNGUSD PULLED BACK FROM 3.3000 RESISTANCE LEVEL. WHERE TO GO NEXXNGUSD PULLED BACK FROM 3.3000 RESISTANCE LEVEL. WHERE TO GO NEXT?
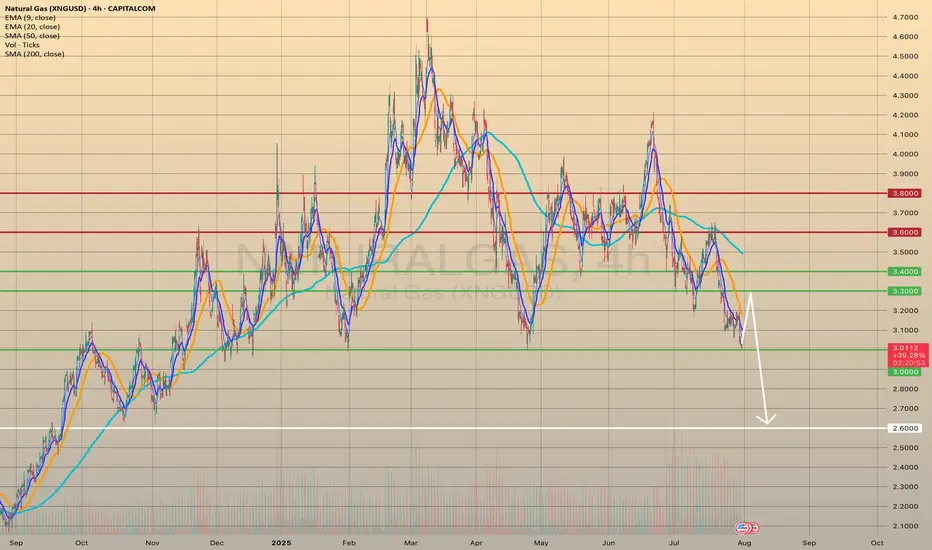
This Monday natural gas prices have successfully broken down bearish wedge formation. As we may observe, the price went down through all major support levels, establishing a new short-term bearish trend. Recently the price broke through the 3.3000 and successfully retested it. It is crucial, due to this level is the last mid-term major support before the 3.000.
Additionally, the weather in the vast area U.S. is supposed to be milder at the end of July - beginning of August, which would curb nat-gas demand from electricity providers for air conditioning usage. To sum up, the decline towards 3.000 level is expected.
Natural Gas Price Drops by 7%Natural Gas Price Drops by 7%
As the XNG/USD chart shows today, natural gas is trading around $3.333/MMBtu, although yesterday morning the price was approximately 7% higher.
According to Reuters, the decline in gas prices is driven by:
→ Record-high production levels. LSEG reported that average gas output in the Lower 48 rose to 107.2 billion cubic feet per day so far in July, surpassing the previous monthly record of 106.4 billion cubic feet per day set in June.
→ Favourable weather forecasts. Although the peak of summer heat is still anticipated, forecasts indicate that temperatures over the next two weeks may be lower than previously expected.
As a result, today’s XNG/USD chart appears bearish.
Technical Analysis of the XNG/USD Chart
The chart indicates that since mid-May, natural gas prices have been fluctuating within a descending channel (marked in red), with July’s peak (E) highlighting the upper boundary of the pattern.
A key resistance area is now represented by a bearish gap, formed between:
→ the former support level at $3.525;
→ the $3.470 level – which, as the arrow suggests, is already showing signs of acting as resistance.
Under these conditions, it is reasonable to assume that the price may continue forming a downward market structure A-B-C-D-E, consisting of lower highs and lows, potentially moving towards the channel’s median – which approximately corresponds to July’s low (around the $3.200 level).
This article represents the opinion of the Companies operating under the FXOpen brand only. It is not to be construed as an offer, solicitation, or recommendation with respect to products and services provided by the Companies operating under the FXOpen brand, nor is it to be considered financial advice.

Natural Gas Crisis: Profits were made!Nat Gas plunged to a 1-week low Monday on the outlook for cooler US temperatures.
A report came out that Nat gas has heat peak demand which is scaring investors.
Nat GAs equities got demolished which could indicate that this breakdown is real.
We got rejected off the daily 50 MA & Knifed through the 200 Daily MA.
Some clear technical breakdowns are now in affect.
We banked on EQT put options that ran over 400%. This trade was called out free on our channel. You tube Short.

U.S. NATURAL GAS - BEARISH WEDGE WORKED OUT. WHAT'S NEXT?U.S. NATURAL GAS - BEARISH WEDGE WORKED OUT. WHAT'S NEXT?
Today, the market opened 2.66% below its closing price on Friday. The current price has already fallen on 4.8% since the closing on Friday, and it is now above the 3.400 support level. I expect further decline, however, with a possible rebound from the current level and pullback towards the SMA50, with a final target of 3.000.
Natural Gas | Oil | Dollar | Silver | Gold Price Forecast.Natural Gas | Oil | Dollar | Silver | Gold Price Forecast.
NYMEX:NG1! AMEX:UNG NYMEX:CL1! COMEX:GC1!

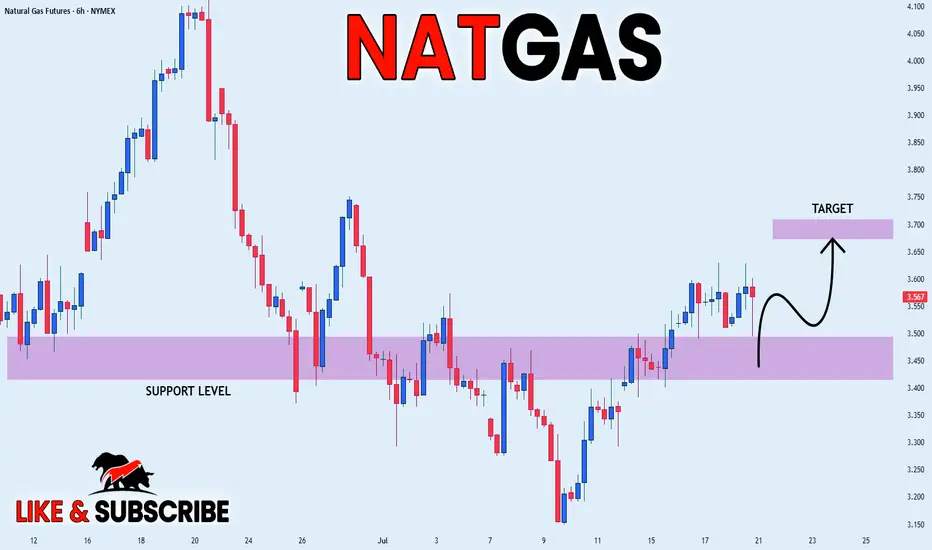
NATGAS REBOUND AHEAD|LONG|
✅NATGAS is going up now
And the price made a bullish
Rebound from the horizontal
Support level around 3.50$
So we are bullish biased and
We will be expecting a
Further bullish move up
LONG🚀
✅Like and subscribe to never miss a new idea!✅
Disclosure: I am part of Trade Nation's Influencer program and receive a monthly fee for using their TradingView charts in my analysis.
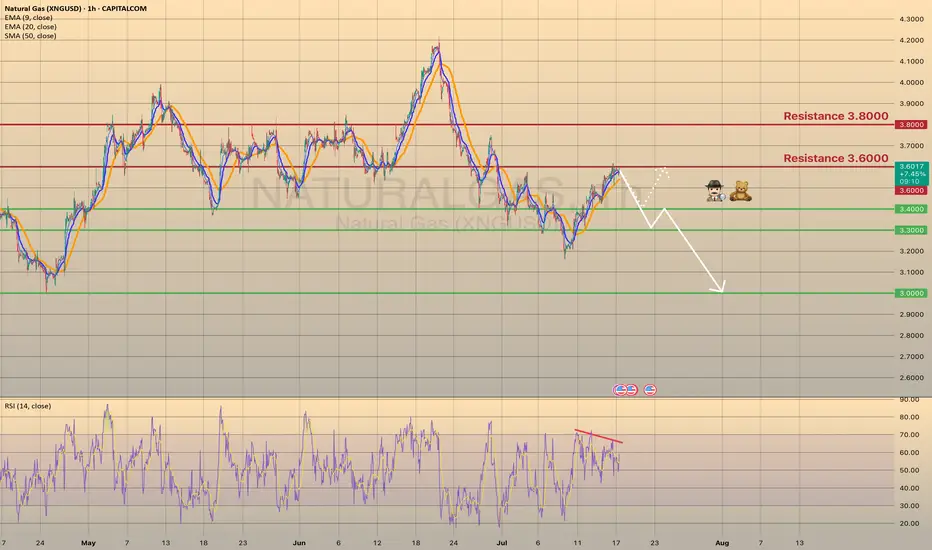
U.S. NATURAL GAS - BEARISH DIVERGENCE DETECTED
U.S. NATURAL GAS - BEARISH DIVERGENCE DETECTED🕵🏻♂️
The Natural gas has been trading bullish for 7 days in a row since last Wednesday, reaching the 3.6000 resistance level. Primarily this happened due to a warm weather in the U.S. states, that supports the demand on gas. Despite warmer-than-normal summer weather, analysts expect energy firms to inject more gas into storage than usual in coming weeks. Record-high output in June, likely to be surpassed in July, and reduced gas flows to LNG export plants since April's peak, support this trend.
Technically chart shows us a bearish divergence on 1-h timeframe. I suppose the price to slowly decline towards major support level of 3.0000 with minor rebounds. The 2nd option is the rebound from 3.4000 support level with a first target of 3.6000.
NATURAL GAS - STILL IN THE GAME TRADING IDEA UPDATE -
NATURAL GAS - STILL IN THE GAME🔥
The XNGUSD goes quite well, as predicted. It held the trendline and moving upwards slowly, but surely. Short-term support here is the EMA20 on 4h timeframe. The asset is just below 3.600 resistance level and sma200. Since the July 10, the asset seems to be moving within the ascending channel (pic 2). I expect that the price will break the 3.6000 resistance level, will go towards upper channel border and then, after quick retest, move towards 3.8000. Not a trading advice! Trade cautiously!

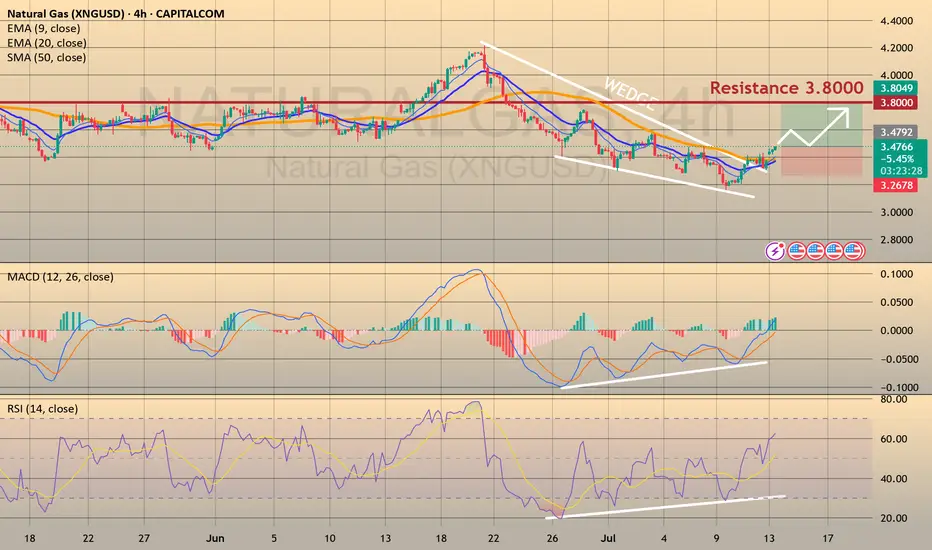
NATURAL GAS - REBOUND FROM THE MAJOR TRENDLINE AND ANOTHER LONG CAPITALCOM:NATURALGAS
Last week on Wednesday and Thursday we observed the false breakout of the major trendline. Eventually, Thursday ended up bullish, gaining 4.8% day-to-day. On Friday the asset has been trading majorly sideways, retesting the major trendline (pic 1). Technically, looks like the divergence on RSI, MACD and Momentum works out as well as the bullish wedge (pic 2). Fundamentally, we still have warm temperature weather forecasts in the U.S. and bullish Thursday's EIA report. Additionally, today the market opened with a bullish gap and continues to grow, which is a good signal for the buyers.
Considering major levels here, I decided to open long positions:
🔼 a market buy order at 3.4556 with
❌a stop loss at 3.2995 and
🤑a take profit at 3.7927
At 3.6000 would be reasonable to reduce long position on a half. Thank you for the attention!
Gold | Oil | Dollar | Silver | Natural Gas July 2025 Forecast.Gold | Oil | Dollar | Silver | Natural Gas July 2025 Forecast.
NYMEX:NG1! COMEX:GC1! COMEX:SI1! NYMEX:CL1!

Natural Gas is in the Buying DirectionHello Traders
In This Chart NATGAS HOURLY Forex Forecast By FOREX PLANET
today NATGAS analysis 👆
🟢This Chart includes_ (NATGAS market update)
🟢What is The Next Opportunity on NATGAS Market
🟢how to Enter to the Valid Entry With Assurance Profit
This CHART is For Trader's that Want to Improve Their Technical Analysis Skills and Their Trading By Understanding How To Analyze The Market Using Multiple Timeframes and Understanding The Bigger Picture on the Charts
Natural Gas - The Epic Reversal? Natural gas had an astonishing move to the upside. Closing up over 5% today.
This volatility can make all tarders head spin if youre not used to it.
Why did Nat gas pop today?
Partly from being oversold and into really good technical support, Natural gas inventories were released today at 10:30am.
The inventories showed a smaller build than the market expected which implies stronger demand. 56B consensus vs 53B actual.
This could potentially be the start to a new bullish trend.
Names like EQT & AR hit some major support today. Some call options on these names have been accumulated.

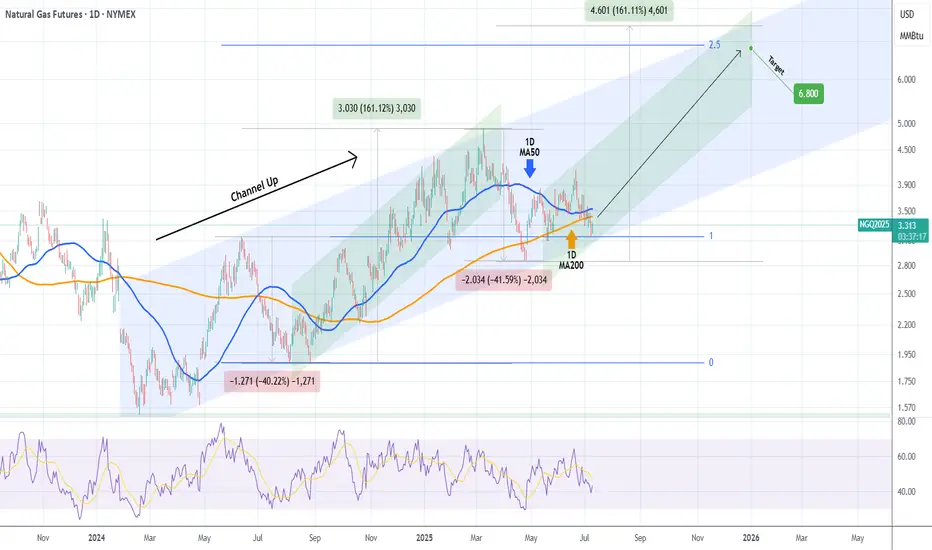
NATURAL GAS Best buy opportunity of the Channel Up.Natural Gas (NG1!) touched yesterday the bottom (Higher Lows trend-line) of the 1.5-year Channel Up, marginally below the 1D MA200 (orange trend-line) and is reacting so far today with a bullish tone.
If this evolves in a full-scale rebound, then technically it will be the pattern's new Bullish Leg. The previous one rose by +161.12% and a repeat of that will take this Leg back to the top of the Channel Up.
Our Target is marginally below that mark, on the 2.5 Fibonacci extension level at 6.800.
-------------------------------------------------------------------------------
** Please LIKE 👍, FOLLOW ✅, SHARE 🙌 and COMMENT ✍ if you enjoy this idea! Also share your ideas and charts in the comments section below! This is best way to keep it relevant, support us, keep the content here free and allow the idea to reach as many people as possible. **
-------------------------------------------------------------------------------
💸💸💸💸💸💸
👇 👇 👇 👇 👇 👇