Natural Gas - Before Ouching Territory, Let's Rally to $3.8One thing appears to be rather obvious: crude's rally has fizzled out:
Oil - Bulls Will Be Totally Annihilated
And that's bad news for bulls. If crude's rally has fizzled, can natural gas counter rally?
Well, natty hasn't done much all year. One of the reasons is probably that the world, which is controlled by the Communist Party, wants to SaVe ThE WoRlD FrOm CliMatE cHaNge by destroying the plastic industry, which natural gas supplied.
Next, they want to get rid of furnaces, which natural gas supplies, and have everyone live on heat pumps (an air conditioner with a blow side that can get hot instead of just cold), which rely on electricity and not natural gas.
At least electricity generation itself still mostly relies on natural gas, and that's never going to be replaced by solar and wind because the technology doesn't meet the requirements of modern consumption.
At the end of July, I called that Natty would not go up until it goes down more, because it seemed to me at the time that the charts just don't have institutional support to go uppy past $10 this year.
NatGas - No Moon Until Doom
\
Right now, if you want to go long on anything, because it doesn't matter if it's DoCToR CoPpEr or equities or gold, you have to be either low risk or hedged, because of the imminent threat of the collapse of the Chinese Communist Party.
Xi Jinping has the game theory problem of being the head of the most wicked and heinous regime in all of human history, the Party that dared to commit organ harvesting and genocide against Falun Dafa's 100 million practitioners.
Although that persecution was launched by former, and now-dead Chairman Jiang Zemin, and although Xi has been killing the Jianglings for years in his Anti-corruption Campaign, the problem is Xi is still the head of the Party, and you always kill a dragon by severing its head.
And its tail was already severed recently when former Premier Li Keqiang was killed by "an heart attack" at the ripe age of 68, which is very young for a Party prince to die.
If Xi dumps the CCP Gorbachev-USSR style in the middle of the night, especially if it happens on a Friday or a Saturday, everything is going to be gap down gap down gap down gap down and never come back because of the time difference between Beijing and Manhattan.
And if Xi really is too stupid to do that much, there's still a raging pandemic besieging Zhongnanhai, and the Emperor's bedroom has never been immune to plague.
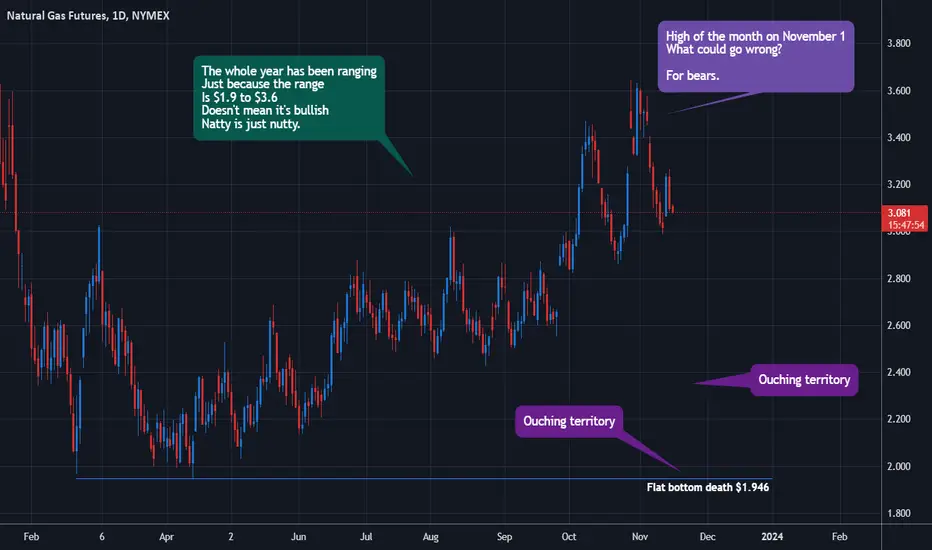
So over the last few months, what's happened with natural gas is, it's up apparently a lot. Like, from $2.7 to $3.6 sort of a lot and looked almost rampy on the monthly bars until it corrected this November:
The weekly, though, shows the pain that the rallies keep getting sold off:
And this is because the rallies weren't really rallies. What would happen is one month would settle and the next month's contract, which is trading in contango, would roll in and give the appearance of uppy and smash up levered futures traders.
But the ETFs show that natty has done absolutely nothing all year.
UNG, which is an unlevered fund:
Is down 56% this year, hasn't rallied one bit, and looks poised to break necks around $4, because what doesn't go up is going to go down. It's been flat for too long.
2x leverage BOIL (long) had a 20:1 reverse split 6 months ago, never rallied, and looks pretty puketacular right now:
And 2x leverage KOLD (short):
Has spent 6 months in a 35% range killing options buyers in what looks like a "bear flag" that's just taken way too long to do the thing bear flags are supposed to do.
And so we can only surmise that the once-fabled $1.8 to $1.6 range on Natty is incoming.
Perhaps we'll see this magic before the end of the year.
If you want to short natty, I have some reservations that this $3.6 monthly high is going to remain the monthly high, because it was set on the first day of the month.
And so there is a potential trade opportunity, roughly now, to take out like $3.8 and net a 25% bagger.
Or just wait until $3.7 and go short on a size that you aren't going to get liquidated on until $5 and be willing to put up with $4 for a day or two.
But most importantly, natty couldn't possibly have topped at $10, and simultaneously couldn't possibly have bottomed at $1.9 with the way 2023 is playing out.
The most sadistic MMs on any asset are the Natty overlords and they're about to get started, I believe.
Natural Gas
Natural Gas Price Forecast | DXY Oil XAGUS Gold00:00 Natural Gas stock Bulls NatGas Support & Resistance Guide
06:02 AMEX:UNG Stock Forecast
07:57 USO Oil Stock Forecast
10:11 DXY US dollar Stock Forecast
11:07 Gold XAUUSD Stock Forecast
12:31 Silver XAGUSD
#naturalgas #natgas #xagusd #dxy #xauusd #naturalgastechnicalanalysis #technicalanalysis #tradingstrategy #daytrading #naturalgasanalysis #naturalgastrading #natgasanalysis #uso #crudeoil

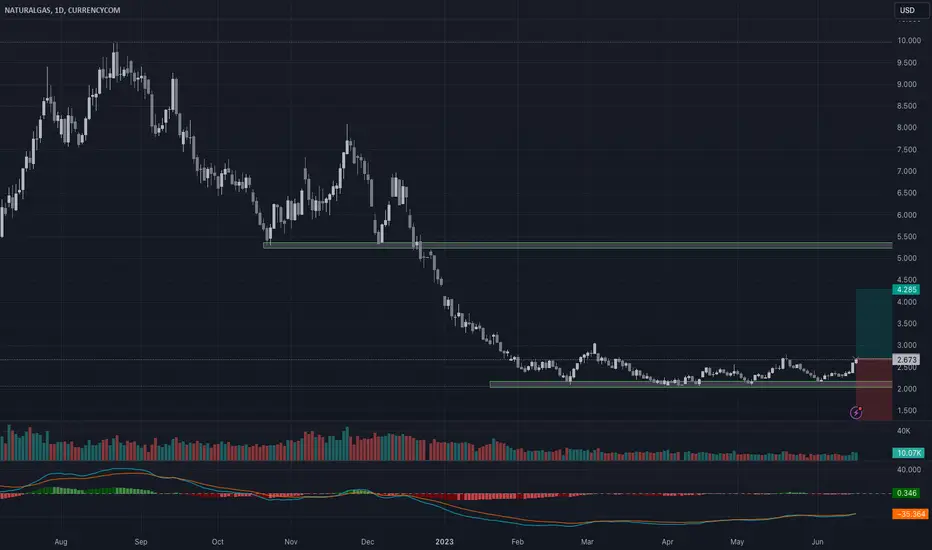
Natural Gas / XNG Porjection Natural Gas prices traded near the July 2020 low and also the same low placed in March 2016. But the Point of interest is that the price rebounds from that level, so it's a good time to initiate long positions but partially till 1.50. Its long-term setup holds it .it could be the best trade of 2024 good luck.

Elliott Waves: Natural Gas case study
Overview:
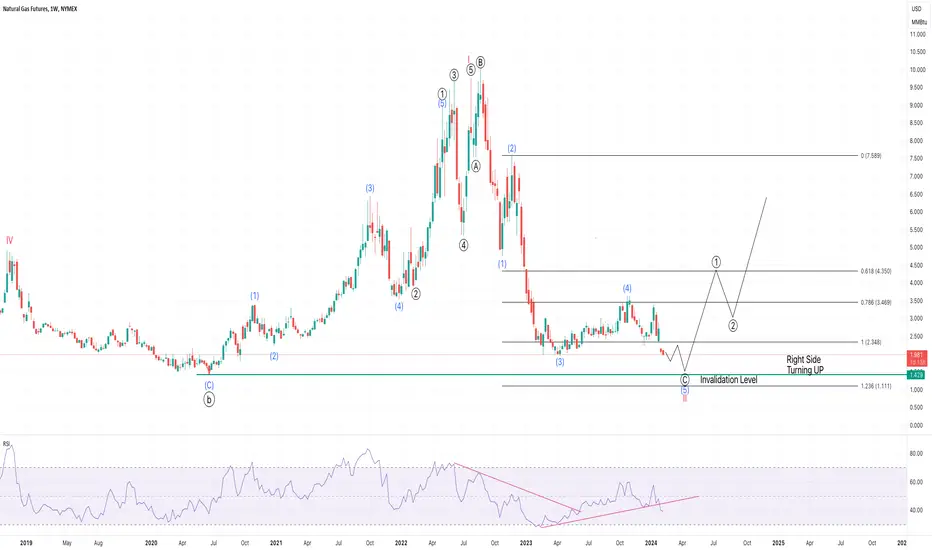
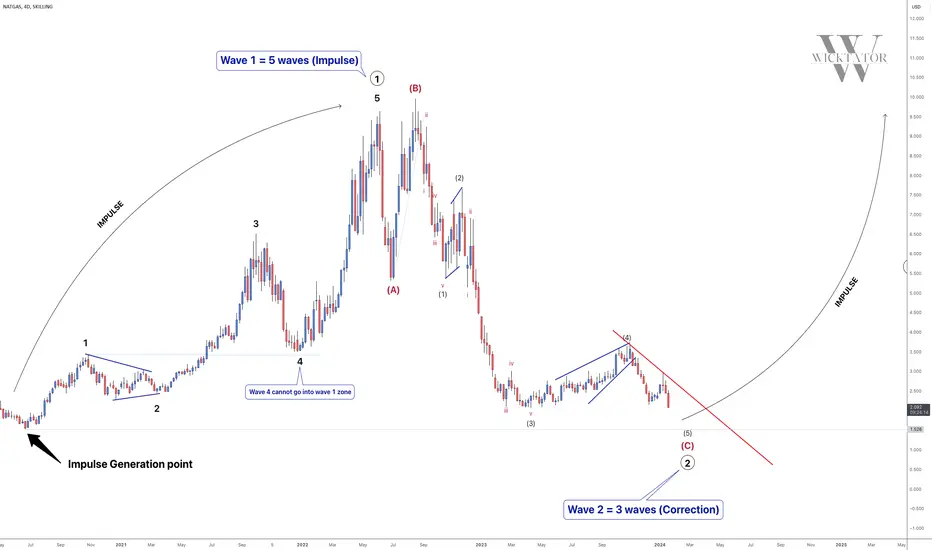
Since the significant bottom in June 2020, Natural Gas embarked on a compelling journey, forming a fresh impulse that concluded around the highs of August 2022 as Wave I in the Cycle Degree. The subsequent phase witnessed a corrective move, labeled as Wave II on the weekly timeframe, comprising three subdivisions: ((A)), ((B)), and ((C)). The current focus is on the ongoing Wave ((C)) on the Daily timeframe, expected to unfold in five subdivisions: (1), (2), (3), (4), and (5). Within this framework, Wave (1) to (4) are complete, and attention now turns to the unfolding of Wave (5) on the Four-Hourly timeframe.
Current Structure:
On the Four-Hourly timeframe, Natural Gas is in the process of forming Wave (5), consisting of Wave 1, 2, and the ongoing development of Wave 3. The details of Wave 3 are further observed on the Hourly timeframe as finished wave ((i)) & ((ii)) and now possibly we are unfolding Wave ((iii)) of 3 of (5) of ((C)) of II.
Elliott Wave Principles:
Corrective Structure:
Wave II is corrective, manifesting as a complex correction with three subdivisions, labeled ((A)), ((B)), and ((C)).
Impulse Formation:
The primary upward movement from June 2020 to August 2022 represents an impulse, characterized by a sequence of five waves.
Subdivision Details:
Each wave and subdivision unfolds according to Elliott Wave principles, maintaining the structural integrity of the overall pattern.
Learning Points:
Analyzing Market Cycles:
Elliott Wave Analysis serves as a valuable tool for understanding the cyclical nature of markets, providing insights into the psychology of both buyers and sellers.
Trend Anticipation:
Corrective waves within the Elliott Wave framework offer a strategic opportunity to foresee potential trends—whether they signify a resumption or reversal of the existing trend.
Elliott Wave Analysis is a tool to decipher market cycles, offering insights into the psychological dynamics of buyers and sellers.
Corrective waves provide an opportunity to anticipate trend resumption or reversal.
The principle of non-overlapping waves helps identify the structure of the market move.
Validation and Risk Management:
The integrity of this Elliott Wave structure is contingent on Wave II not surpassing the low of Wave I, identified at $1.440. A breach of this level would invalidate the current wave count.
I am not Sebi registered analyst.
My studies are for educational purpose only.
Please Consult your financial advisor before trading or investing.
I am not responsible for any kinds of your profits and your losses.
Most investors treat trading as a hobby because they have a full-time job doing something else.
However, If you treat trading like a business, it will pay you like a business.
If you treat like a hobby, hobbies don't pay, they cost you...!
Hope this post is helpful to community
Thanks
RK💕
Disclaimer and Risk Warning.
The analysis and discussion provided on in.tradingview.com is intended for educational purposes only and should not be relied upon for trading decisions. RK_Charts is not an investment adviser and the information provided here should not be taken as professional investment advice. Before buying or selling any investments, securities, or precious metals, it is recommended that you conduct your own due diligence. RK_Charts does not share in your profits and will not take responsibility for any losses you may incur. So Please Consult your financial advisor before trading or investing.

NG -Natural Gas , Don't Buy Now !!!
Technical Analysis:
- NG is still finishing a wave ((II)) in Blue in RED . We expect after a bounce in a wave ((1)) in Black
- H1 right side is down
- H4 right side is turning down
Technical Information:
- You must wait for the wave((II)) in Red to be completed in order to buy as( Position Trader))
Natural Gas bounce time or new lows?Nat gas has broken critical support.
Losing the $2 whole number is a big psychological breakdown.
Since Nat gas is in a clear down trend making new 52 week lows, you must be mindful about being overleveraged in this asset.

DXY USO XAGUSD Gold Natural Gas Price Forecast - BIG MOVE soon.#naturalgas #natgas #xagusd #dxy #xauusd #naturalgastechnicalanalysis #technicalanalysis #tradingstrategy #daytrading #naturalgasanalysis #naturalgastrading #natgasanalysis #uso #crudeoil
00:00 Natural Gas stock Bulls NatGas Support & Resistance Guide
03:05 AMEX:UNG Stock Forecast
04:10 USO Oil Stock Forecast
05:38 DXY US dollar Stock Forecast
07:49 Gold XAUUSD Stock Forecast
09:11 Silver XAGUSD

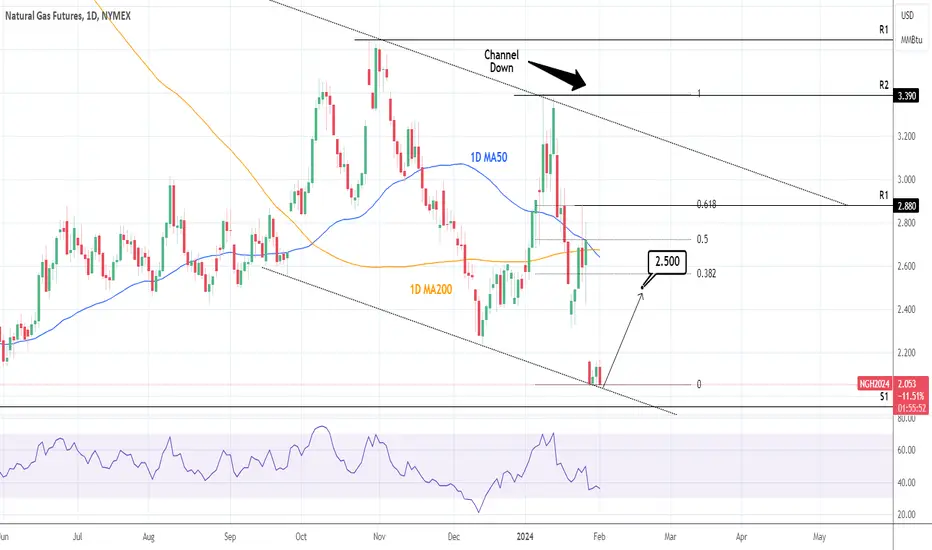
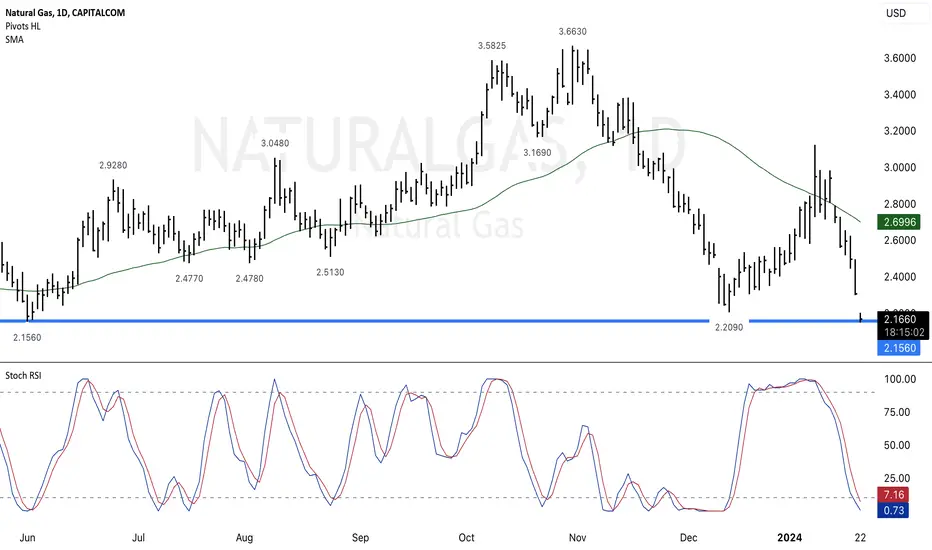
NATURAL GAS: Buy opportunity near oversold levels.Natural Gas is almost oversold on its 1D technical outlook (RSI = 33.738, MACD = -0.139, ADX = 32.983) right at the bottom of the three month Channel Down. Last time the 1D RSI dipped under 30.000 (oversold level), the LL was formed, the Channel Down bottomed and posted a strong December-January rally. Due to the long term bearish trend on NG, we don't expect such a rally this time but the price is low enough to justify a short term buy to test the 1D MA50 (TP = 2.500).
## If you like our free content follow our profile to get more daily ideas. ##
## Comments and likes are greatly appreciated. ##
Natural Gas(NG1!) Has Started to Bounce Now Technical Analysis:
- NG is doing a bounce in wave ((1)) in black. We expect that this bounce will continue
- H1 right side is turning down
- H4 right side is turning up
Technical Information:
- If you didn't buy yet, you must wait for the wave((2)) in black to be completed in order to buy
- And if you want to buy now, you need to put stop-loss around 2.43 but it's a risk trading now to buy

Natural GAs bulls defending the lowsNat gas closed positively today in a weak market.
The importance of this close is it was a close above yesterdays high. Showing some potential near term momentum .
If Nat Gas can closes above the resistance trendline we could see a retrace to $2.50.
Looking for a weekly bottoming tail on Nat gas to confirm a local bottom.

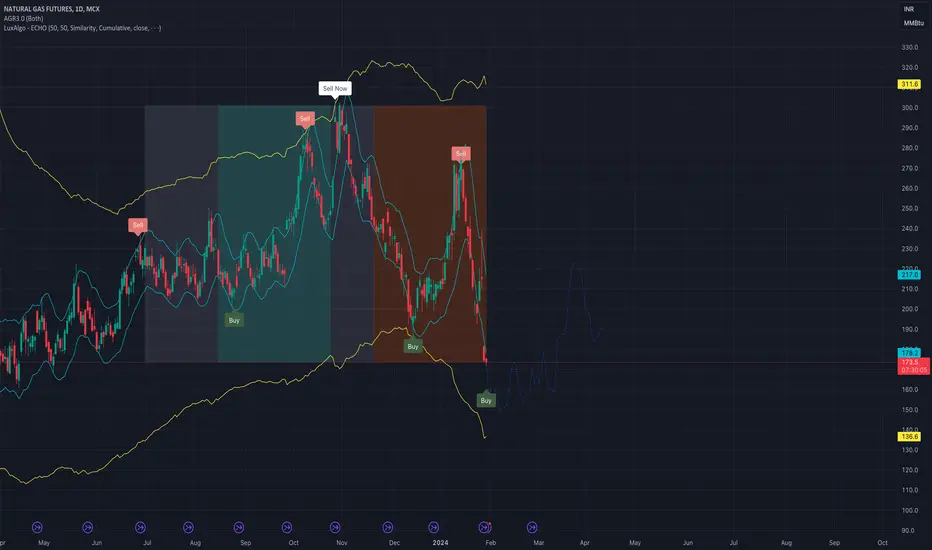
Natural Gas moving towards its swing low
It seems Natural Gas is moving towards its current swing low. It can still go further down and touch 150 in near future before confirming the low and move upward. I think we can still go short on it for Feb.
NATGAS LONG TERM TRADE analysHello Traders
In This Chart NATGAS HOURLY Forex Forecast By FOREX PLANET
today NATGAS analysis 👆
🟢This Chart includes_ (NATGAS market update)
🟢What is The Next Opportunity on NATGAS Market
🟢how to Enter to the Valid Entry With Assurance Profit
This CHART is For Trader's that Want to Improve Their Technical Analysis Skills and Their Trading By Understanding How To Analyze The Market Using Multiple Timeframes and Understanding The Bigger Picture on the Charts

Natural Gas DXY Oil Gold Silver Price Forecast00:00 Natural Gas stock Bulls NatGas Support & Resistance Guide
04:14 AMEX:UNG Stock Forecast
05:45 USO Oil Stock Forecast
07:25 DXY US dollar Stock Forecast
08:09 Gold XAUUSD Stock Forecast
08:53 Silver XAGUSD

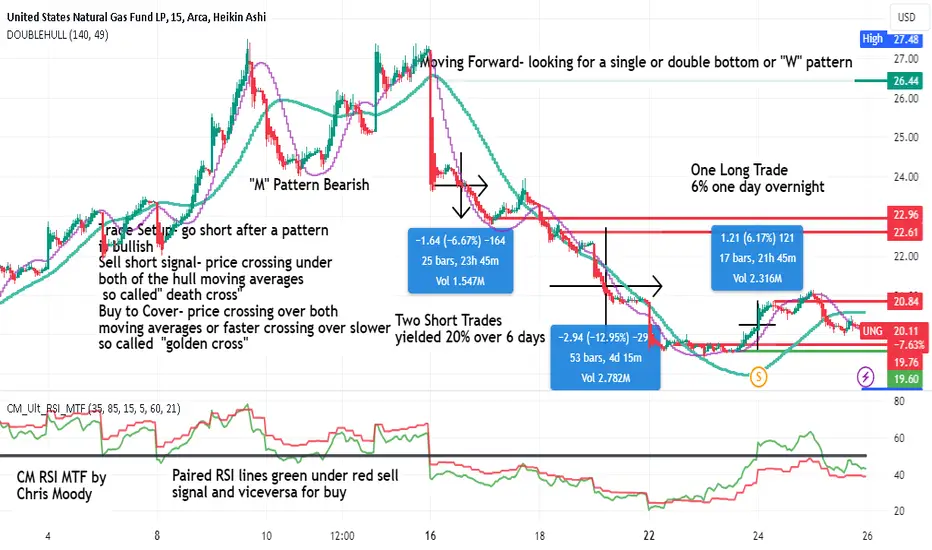
UNG ( Natural Gase Futures ETF) Swing trade Short then LONGUNG is shown here on the 15 minute chart with text box comments showing the three trades
over 8-9 trading days yielding 25% overall first two trades short then a one day long trade at
what may be an early reversal. A pair of hull moving averages 49/140 ( multiples of 7) are used
to generate buy and sell signals in golden and death cross fashion. A dual TF RSI indicator is
used to support those signals. As swing trades with typical stop losses these were quite
profitable with low risk. As an alternative if a trader has options charting available the same
strategy/ method can be applied for significantly higher profit with less capital in each trade.
Bullish Outlook: UNG Prices Surge Amidst Anticipation of Record In the wake of widespread winter weather last week, the volatile natural gas futures front month, specifically the expiring February contracts for UNG, are witnessing a robust uptick.
Traders are eagerly anticipating a potentially record-breaking storage withdrawal, adding fuel to the bullish sentiment.
The market's sharp rebound in early trading on Thursday reflects the optimism surrounding the impending storage pull, setting the stage for a significant uptrend in UNG prices.
Investors are closely monitoring the situation, poised for potential gains in the midst of evolving market dynamics.
Natural Gas DXY, Oil Gold Silver Price Forecast - Natural Gas Natgas Stock 4h uptrend confirmed
#naturalgas #natgas #xagusd #dxy #xauusd #naturalgastechnicalanalysis #technicalanalysis #tradingstrategy #daytrading #naturalgasanalysis #naturalgastrading #natgasanalysis #uso #crudeoil
00:00 Natural Gas stock Bulls NatGas Support & Resistance Guide
05:05 AMEX:UNG Stock Forecast
05:58 USO Oil Stock Forecast
07:14 DXY US dollar Stock Forecast
09:09 Gold XAUUSD Stock Forecast
09:56 Silver XAGUSD

Natural Gas Bulls are alive / Oil looks ready to go!Nat gas saw a beautiful bullish reversal candle today.
this likely will yield more upside in the short term.
Even with this reversal, I believe Nat gas still goes lower after we complete this bounce.
Oil stocks showing strength as oil appears to be putting in a bottoming formation.
If oil breaks out, this will be a natural headwind for the market and tailwind for inflation.

NATURAL GAS - Only Way Is Up!From a technical standpoint, Natural Gas is currently at levels where there's very very limited downside and major potential for upside.
Many times when we've seen prices come to these lows, price shot up hundreds of %. It's unlikely that we'll hit 0 and therefore balance of probability suggests that going Long on Natural Gas would be a good bet!
Trade Idea:
- For a safe entry, enter on break of the red trendline
- For a risk entry, look for buying opportunities anywhere between the region of 1.6 and 1.8
- stops below lows after the red trendline breaks
- Targets: 3.5, 6, 10
Goodluck and as always, trade safe!
Natural Gas Double Bottom Oversold Stoch RSIDouble Bottom Oversold Stoch RSI. The technical analysis indicates a Double Bottom pattern along with an Oversold condition in the Stochastic RSI. This combination suggests a potential reversal or a bullish momentum in the market. The Double Bottom pattern is characterized by two consecutive troughs at approximately the same price level, indicating a possible trend reversal from a downtrend to an uptrend. Additionally, the Oversold condition in the Stochastic RSI suggests that the asset may have been oversold and could be due for a price increase. Traders may interpret this as a signal to consider buying or taking a bullish stance in their trading strategy.
Natural Gas Futures Bullishly Diverging at a Bullish Bat PCZNatural Gas Futures aggressively gapped down into support during the first hour of this week's trading and looks to be ready to form some MACD Bullish Divergence leading into the rest of the week. I think there is a good chance that Natural Gas at least undoes this decline and rises back up to $2.5 this week, but overall if this ends up being a major bottom I'd expect it to pump well into the mid to upper 3 dollar range.

Natural gas demolishing the bulls!We have been consistent with our calls on this commodity.
We warned you of lower price action to come and it has come!
new downside levels have been calculated that Nat gas breaks the $2 level.
We should see an intraday bounce tomorrow for a nice day trade move.

Kinder Morgan: Slanted Bullish Inverted Head and ShouldersKinder Morgan is heading into earnings and currently sits above the 200-week SMA and the POC as it forms what appears to be a Bullish Inverted Head and Shoulders pattern. If these levels hold into earnings, I think KMI will have a chance at breaking out of the pattern and making its way towards the 0.618 Fibonacci retracement up at around $31.23 especially if natural gas prices continue to rise.

Red Sea Crisis: How it will trigger the market?The recent development of the Red Sea crisis does not suggest that it is going to resolve anytime soon.
Which markets have already started moving? And how far will they rise this time?
We are going to recap the supply chain crisis during the pandemic and also delve into the current supply chain disruption caused by the Middle East conflict, which has led to the Red Sea crisis.
My name is Kon How, and my role in this channel, as always, is to study behavioral science in finance, discover correlations between different markets, and uncover potential opportunities.
Henry Hub Natural Gas Futures and Options:
Minimum fluctuation: 0.001 per MMBtu = $10.00
Code: NG
Disclaimer:
• What presented here is not a recommendation, please consult your licensed broker.
• Our mission is to create lateral thinking skills for every investor and trader, knowing when to take a calculated risk with market uncertainty and a bolder risk when opportunity arises.
CME Real-time Market Data help identify trading set-ups in real-time and express my market views. If you have futures in your trading portfolio, you can check out on CME Group data plans available that suit your trading needs tradingview.sweetlogin.com
