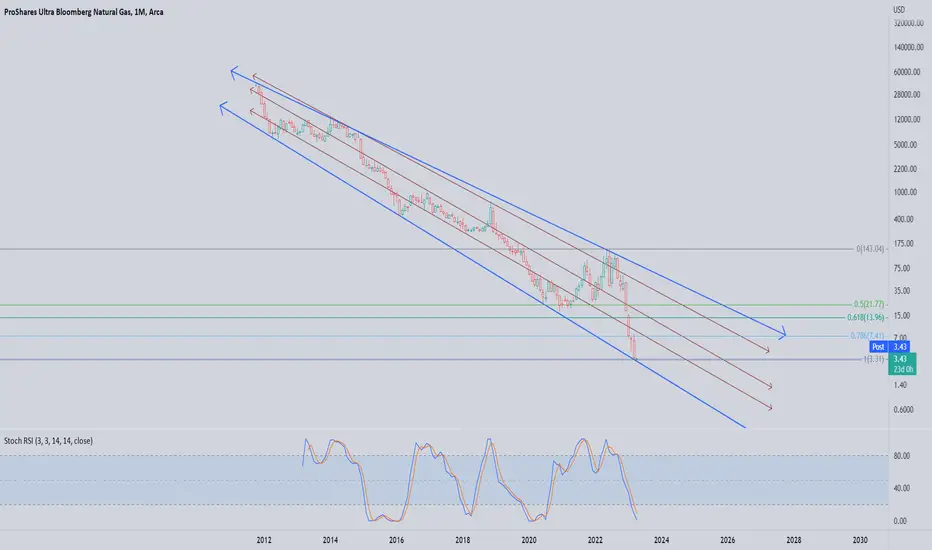
BOIL hitting a major line of resistance For the 4th time since 2012 BOIL has hit the bottom of this descending channel. The fib extension landed perfectly on the 1 (3.31) and the stoch RSI (monthly) is showing oversold. A short-term move up to the first and/or second brown line has been the historical bounce, eventually making it to the third brown line before falling again. So lets see if it reacts the same way or if it finally busts below this blue trendline.
Natural Gas
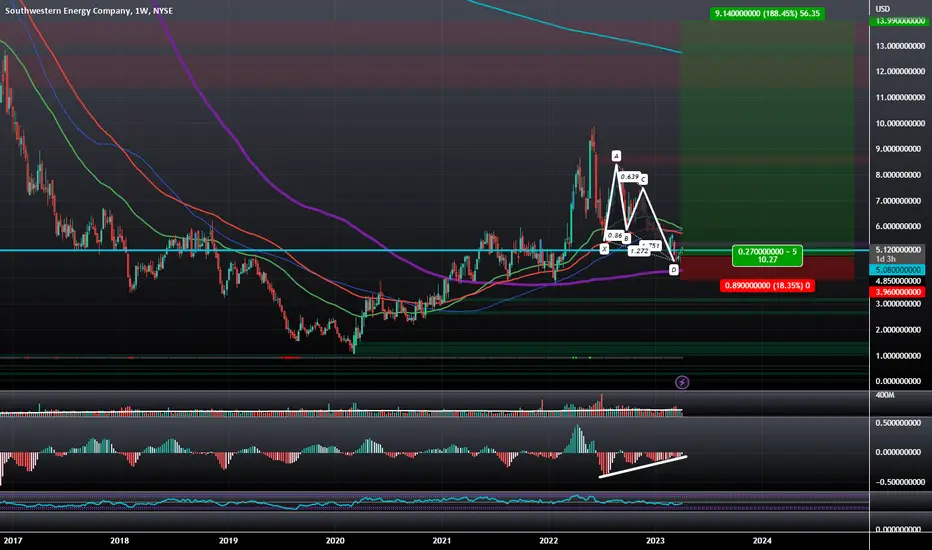
$SWN: Bullish Spring and Backtest with Bullish DivergenceSouthwestern Energy Company is potentially Backtesting a Spring at a Harmonic 1.618/1.272 Harmonic Confluence Zone while showing Extreme Levels of Bullish Divergence on the Weekly Timeframe; If SWN performs and pivots off of this level then we could see it go up all the way to the 800 Week EMA which would give us a Potential Upside of nearly 200%
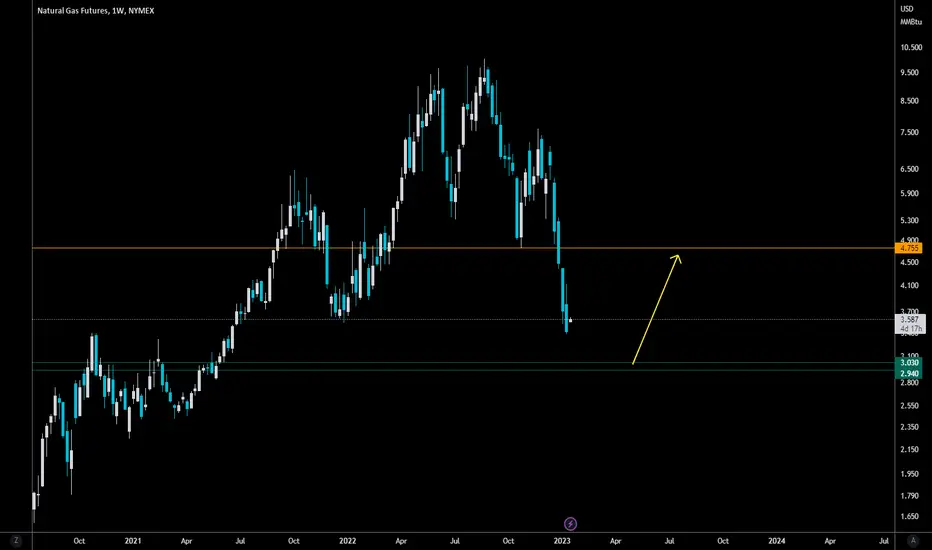
Natty GangBuy green. Sell orange. Natural gas isnt going anywhere just like nuclear. use all the energy we need it all
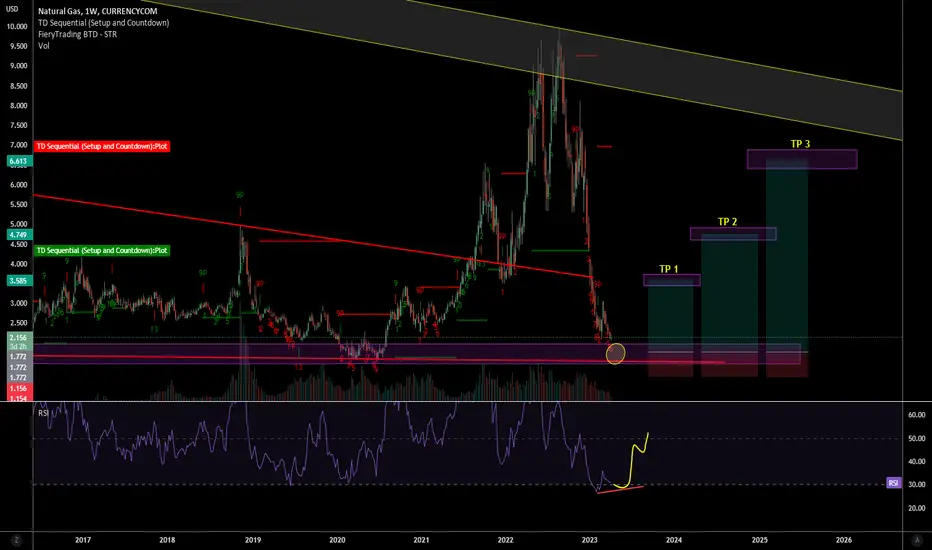
NATURAL GAS 1W - long opportunityNatural gas price has already dropped 79% from the Nov 22' high and it usually drops around 80% if we look at the previous large price drops.
If we don't break below 1.60 - 1.80 level and confirmations for the long entry occurs i will consider going long.
ENTRY: 1.65 - 1.90
TP1: 3.44 - 3.70
TP2: 4.63 - 4.93
TP3: 6.40 - 6.85
SL: 1.150
This is not a financial advice! Trade with caution.
Natural Gas (NATGASUSD): How to Buy With Confirmation 💨
Multiple time frame analysis on Natural Gas.
Detailed trading plan.
Potential scenarios.
❤️Please, support this video with like and comment!❤️

How to play The GAS range to futhure ?Hello i want to you show you my plan for next days. For me go to long possition is the buy zone 1,8. All under 2,7 is for me Short.
I am not shure if we will go more up now than drop or we will go now to 1,8 and then long possition. It depends if we will push trought the chanel.
Lets see what will come.

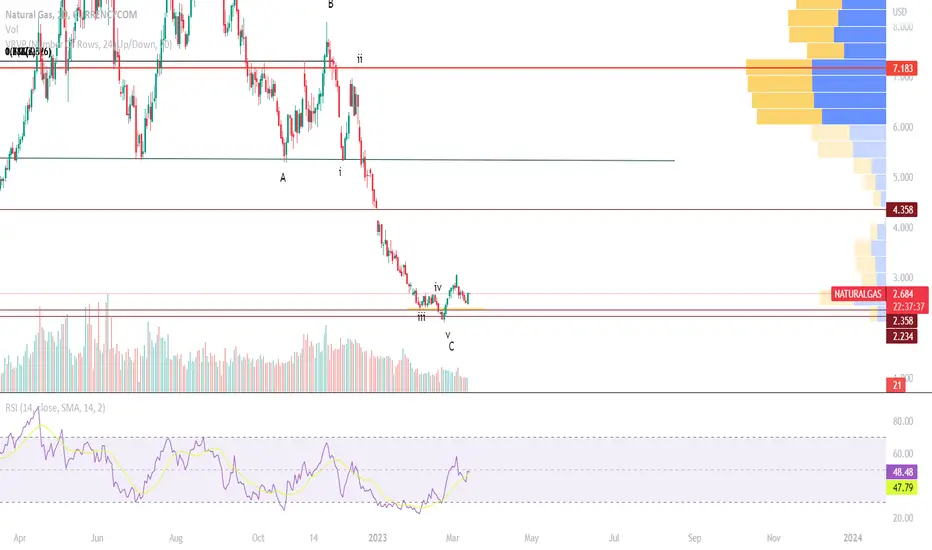
NATURAL GAS-Did we bottom?During previous posts, linked in description, we tracked the bearish patterns unfolding in a macro ABC to the downside in Natural Gas.
Now, targets of wave C are reached and the structure seems complete. Bulls where shaken a bit out, and price reacted impulsively from 2.115, and then retraced to the Golden fibo zone, where today's daily candle was printed. Natgas may be now reversing to the upside.
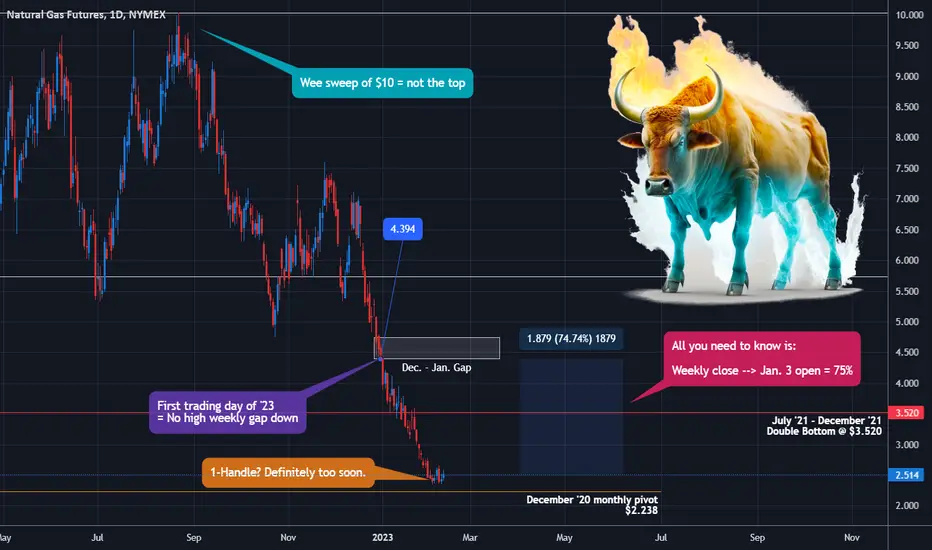
Natural Gas? More Like Natural Go. 4-Handle Coming.Over the course of 48 trading days between the Dec. 13 high and the Feb. 3 low, natural gas has lost 69 percent of its value.
Let's put that into perspective. Just imagine if, over the next 2 months:
Gold went from $1,874 to $590
WTI crude went from $79.72 to $24.17
Bitcoin futures went from $21,775 to $6,750
The SPX went from 4099.75 to 1,270
That's the kind of thing that just happened to natural gas, and naturally, it makes people wonder if they can get long, but they're also scared to get long.
And it's fair to be scared. NG's MMs are the biggest maniacs in any commodity or equity and a fall from $2.50 to $1.25 isn't "just a dollar" anymore, it's 50%, which kind of matters when you're levered long on 2-3x ETFs or just trying to trade big lot COMEX.
Regardless, I believe the time is right to go long. I don't believe the time is right to go long for $18. But I do believe that the time is right to bag the better part of an impending - and sharp - 50-75% move.
Eyes on China
I have to urge readers that you simply must be cautious with any long position at present, for the Wuhan Pneumonia situation in Mainland China is extremely dangerous.
Whatever you choose to believe when it comes to the Chinese Communist Party, I won't give you a hard time. If you want to believe the establishment narrative that Xi Jinping's hysterical Zero COVID weld-people-in-apartment-buildings social credit scheme actually made the virus not kill anyone to the degree that the Mainland, despite being the world's (formerly) most populous country and ground zero of the epidemic has suffered tens or hundreds of times less deaths and cases than the west , okay, you do you.
But when you see Zero-COVID fall, the Party says there were suddenly tens of thousands of new deaths and millions of new cases, and then since Jan. 10, the John Hopkins University tracker has reported ***0.00*** new cases, every single red alarm bell in your whole body should be ringing.
In our lifetimes, we will see the Chinese Communist Party fall. It will probably take Xi Jinping down with it, but it might not. And ultimately all the crimes against humanity the Party has committed, especially the 23-year persecution of Falun Gong and the unprecedented live organ harvesting of its practitioners (and Uyghur Muslims) will become the only thing in the world that matters.
Markets will actually gap down those days and won't come back. Wall Street won't be risk-on, at all, anymore. And thus, the algos won't be market making anymore.
The Call
Last year, I had two extremely successful calls on Natural Gas:
Published in October: Natural Gas / NG - Act II: A Number That Starts With "2"
I don't think anyone believed that at the time.
And in September, I had called when the market had finally turned from bear to bull: Natural Gas / NG - It's Officially a Bear. Now, Hold My Beer
Now, it's nice to have had some success, but please remember:
1. Broken clocks are still right twice a day
2. Past performance is not indicative of future performance
Now, for where we're currently at, there are some key factors:
Natural gas went down in a straight line for 33 trading sessions (thanks, Freemasons!)
The first trading day of the year was a gap dump
A brief sweep of the $10 psyop figure was _not_ the medium or long-term top.
2020 already had months of 1-handle
NG hasn't taken the December '20 monthly pivot at $2.2 and has started to show signs of reversal
We're getting close to summer, which is going to be HOT again because the planet's climate is trashed (just not from that CO2 propaganda nonsense. Earth is just an old man on life support, for real.)
Natural gas is this thing that produces most of the world's electricity, in a world that's using ever more electricity all the time
And so what I would ultimately like to point out is the ONLY thing you need to know as a trader:
A bounce from Friday's session close back to the gap set on the first trading day of the year amounts to a 75% gain.
Now let's say that the MMs aren't going to squeeze shorts that badly or reward bulls, even temporarily. Either way, the algorithm is for sure going to rebalance this extreme of a drop, and even if it were to rebalance 50%, you're still looking at a 35% gain.
I believe that for certain NG is about to bounce. It's just that either:
a) The bottom isn't yet in
b) The bottom is in after a 90% retrace to the $2.35 bottoms (this should occur when Nasdaq goes ham as Wall Street "Big Shorts" tech to retail and Cathie Woods)
Nasdaq NQ QQQ - Reality Will Be a Tough Pill for Permabears
$3.6 - $3.8 is the conservative upside target
$4.2 - $5.0 is the maniac upside target
Either way, I don't believe it's going to V-Bottom and run $18 and feed inflationary pressures, since equities need to go up before they go down, and CPI printing big gains will really get in the way of the narrative being woven by Citadel's PR firms.
I think this spike should come fast and strong and the retrace won't be that bad, but will be consolidate-y.
July of 2023 and straight through the middle of 2024, if humanity makes it functionally that long, is going to be very inflationary and very chaotic.
The status quo, the old normalcy, is long gone, and never coming back. Mankind is walking towards both the end, and its future.
Be careful. You choose your path with your heart and your conduct.
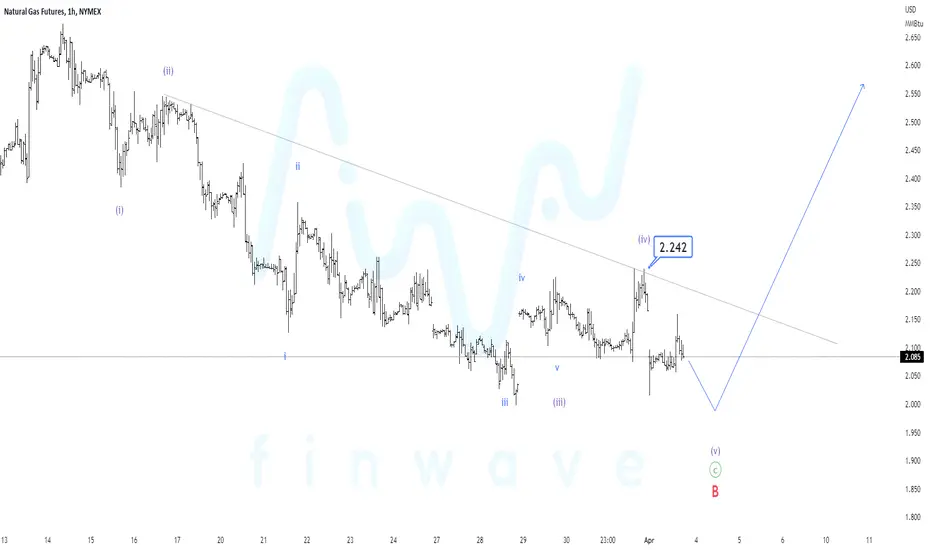
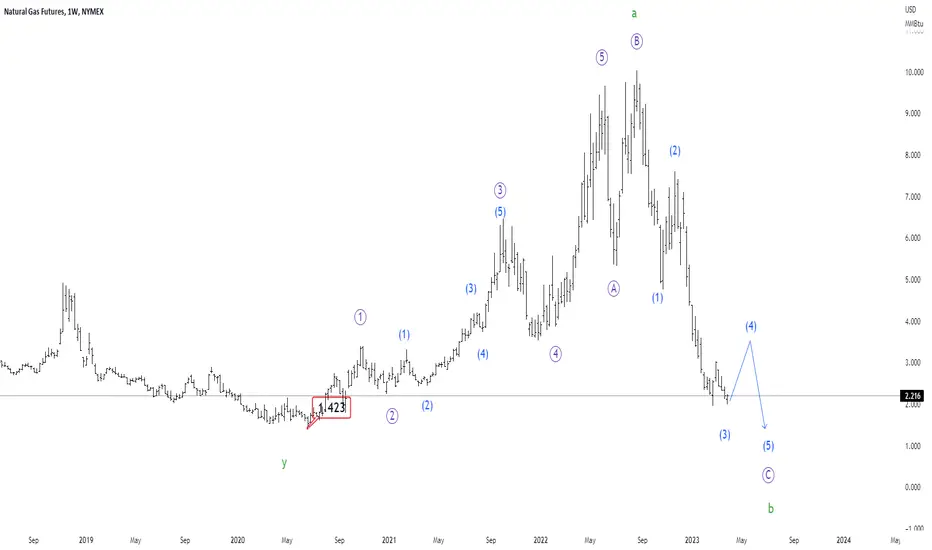
Natural Gas - Details. Financial WaveOur priority scenario in NG is a pullback of the price in wave 4 to $3.5. A slight decline before the rise is possible, but not below $1.423. Resistance at Friday's high of 2.24 should (ideally) remain unchanged until wave B is considered complete.
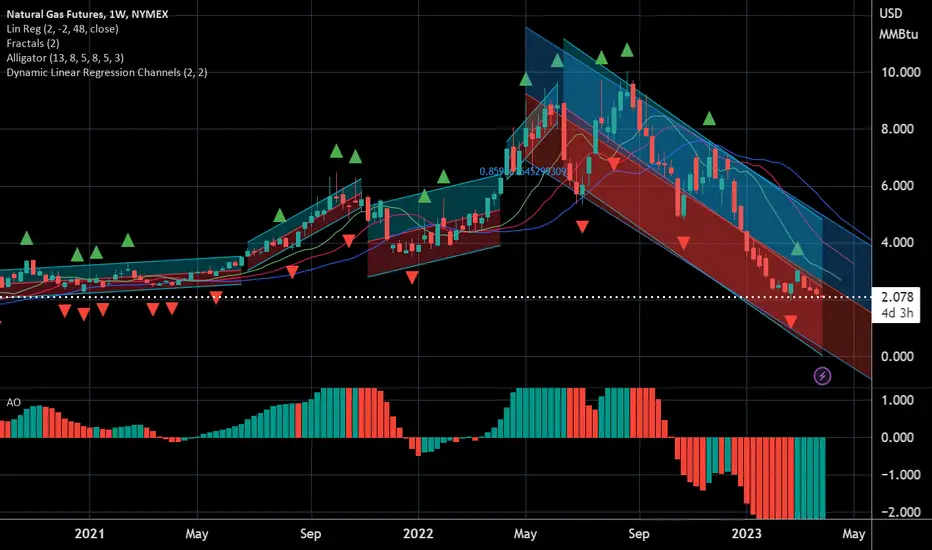
Natural Gas and the Dangers of Swing Trading Leveraged ETFsThinking that the war in Ukraine would cause the price of natural gas to surge higher over the winter, many traders got stuck on the wrong side of a trade. Natural gas futures have plunged more than 90% over the winter.
In this video, I explain that regression analysis was warning that a significant price decline was imminent in late 2022, and I explain that it is now suggesting that a bounce in natural gas prices may soon occur. This video also explains the pitfalls that many novice traders experience when trying to swing trading leveraged ETFs that employ derivatives and which undergo volatility drag over time.
Here is the link to the risk-reward / win-ratio spreadsheet that is referenced in the video.
docs.google.com
Shared with permission from @HeWhoMustNotBeNamed
Note for stats nerds: The log-linear regression channel indicator does not give negative numbers for the Pearson correlation coefficient (r). The indicator gives the absolute value of the Pearson correlation coefficient |r|. So if the correlation is strongly negative or strongly positive, it will appear near 1 in both cases.
Important Disclaimer
Nothing in this post should be considered financial advice. Trading and investing always involve risks and one should carefully review all such risks before making a trade or investment decision. Do not buy or sell any security based on anything in this post. Please consult with a financial advisor before making any financial decisions. This post is for educational purposes only.

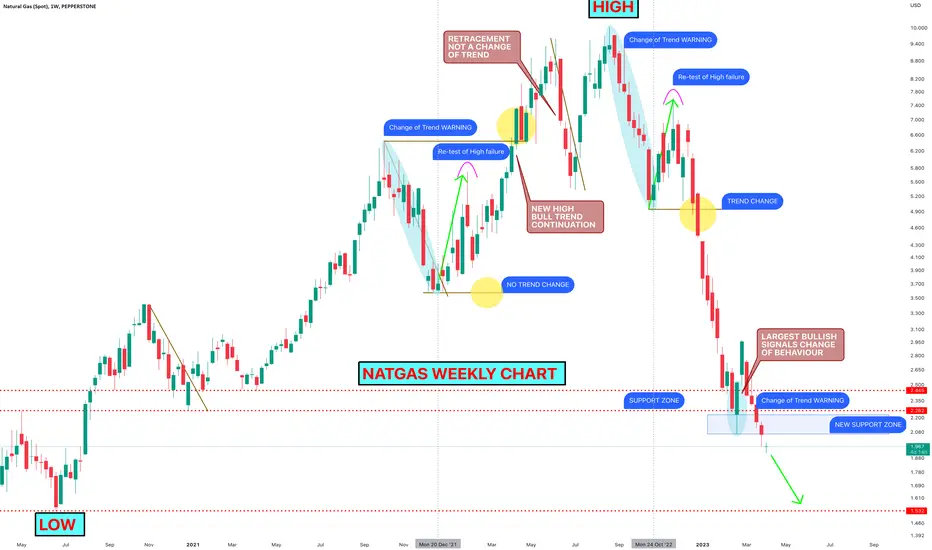
Down She GoesUnless NATGAS can claim back the support zone very shortly, this looks to be heading further down...
Natural Gas Full Bear Control | Potential Equilibrium - NG UNG full bear control, need to see a hourly trend change to the bull for anything to happen.
- potential Equilibrium shape up on daily time frame if bulls can hold above $2
- daily 12 EMA resistance

Natural Gas - Weekly. Financial WaveOur priority scenario in NG is a pullback of the price in wave 4 to 3.5 $ after which, most likely, NG will go to the final descending wave 5 and the price can come to 1.5 $, but not below 1.423 $
NATGAS will spark soon....Daily Chart suggest shifting price.
NG is not for the faint of heart due to its extreme volatility so practice safety still -- but with right timing and setup, it can be rewarding.
This is the second attempt (reversal) on the daily, and the probability of a short squeeze is high.
Spotted at 2.056
SL at 1.9.
GOODLUCK NATTIES.

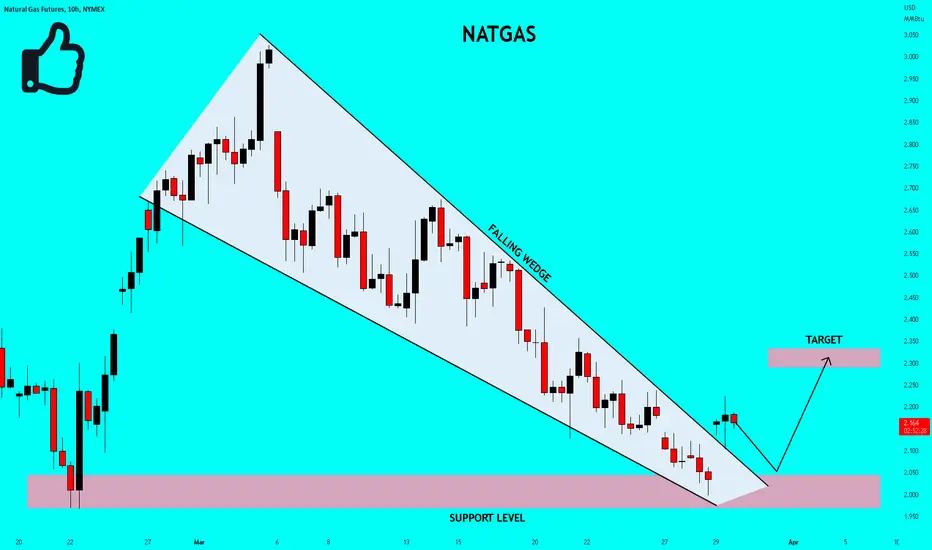
✅NATGAS BROKE THE WEDGE|LONG🚀
✅NATGAS was trading in a
Downtrend in a falling wedge
Pattern but after the retest
Of the horizontal support
At around 2.0$ which is also
A strong round number we saw
A rebound and a breakout out
Of the falling wedge so we are
Now locally bullish biased
And I think that the target
Of 2.3$ will be retested
LONG🚀
✅Like and subscribe to never miss a new idea!✅
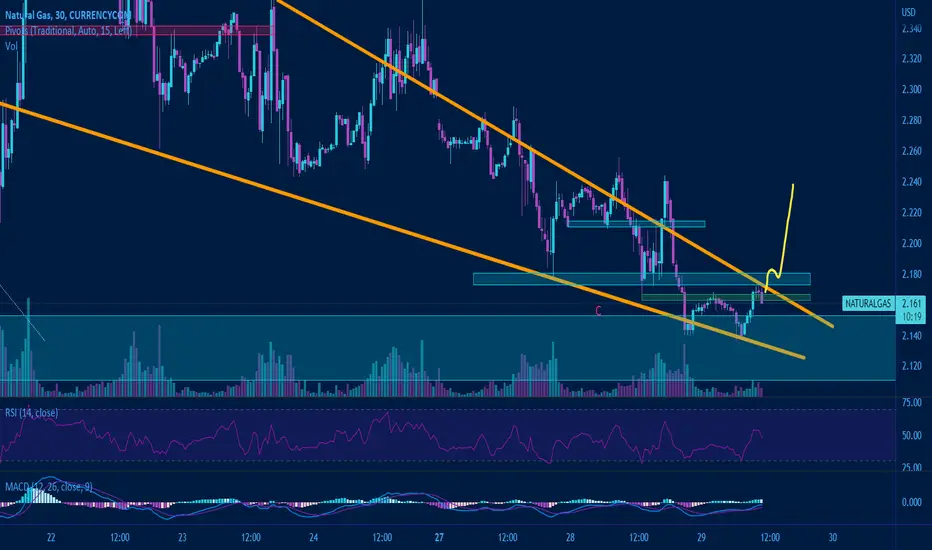
natgas - long with target 3,2End of descending wedge, with horizontal support and double bottom on the 30 min, now quick retest and breakout. Time to be a bull!
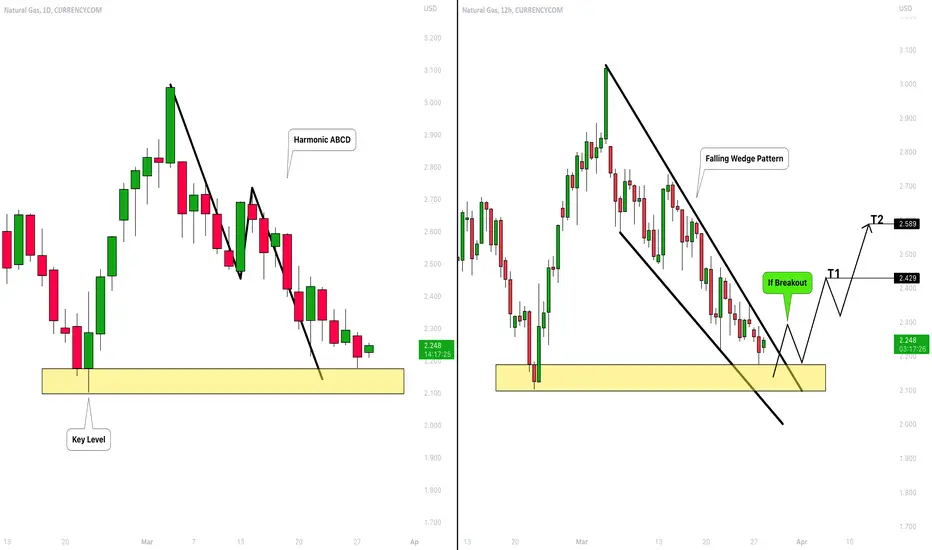
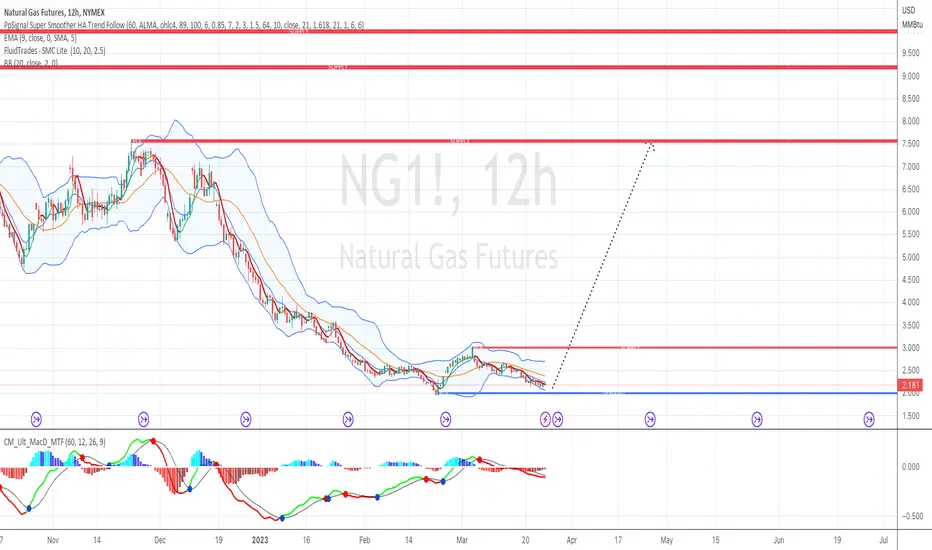
Natural Gas (NATGASUSD): How to Buy With Confirmation 💨
Hey traders,
I spotted a classic harmonic ABCD pattern on Natural Gas.
The completion point of the pattern matches perfectly with a horizontal key level.
Analyzing intraday time frames, I also spotted a falling wedge pattern on 12H.
To buy with a confirmation, wait for a bullish breakout of the resistance of the wedge.
Its violation may initiate a bullish movement.
Goals will be 2.43 / 2.58
❤️Please, support my work with like, thank you!❤️
Mar 27,23-NG-Price ain't going up!SO - from my last post, thinking price would rally even 500 points failed to occur. Sucks but that's the world we live in currently. Even with the contract rolling over there is no chance of a rally. The IEA says inventories are 22% above the 5 year average - this combined with winter being over in the U.S. means no demand for NG.
So, I am sitting on the sidelines, waiting. Price may go well below 2 this week, maybe 1.7.....maybe even 1.5 - who knows.
Anyway, I'll be looking at other trades - maybe oil, and the S & P 500 to make some money.
Take care and stay safe.
Heiko
Natural GasI have shared my idea about natural gas. The market step by step becomes range during some months and then be ready to become bullish.

Natural Gas $UNG $BOIL NG - Future Price Outlook- UNG NG NATGAS 6h 12 EMA is my short term guide
- weekly bear flag potentially confirming
- 52 week low support bulls need to defend
- 1h equilibrium pattern will break Monday

NATURAL GAS - Potential Upward MovementNATURAL GAS refilling at demand zone and about to rebound. Exit at 2nd supply zone
BOIL UPDATE LONGTERMOn the daily chart, BOIL price has never been lower and the relative volume has never
been higher in the past five years. Being mindful, this is leveraged it falls faster than an
the unleveraged counterpart of the same commodity ( UNG INL) However moves in the
opposite directions are also amplified. Horizontal red lines are drawn in consideration
of pivots on the 4H. Price was nearly $600 in 2019. Can you think of a fundamental
reason why price cannot rise from the present price to something closer to that
of 2019. To go from $4 to $600 is 150X in otherwords 15000%. Is there anything
wrong with my math or the chart?

NATURAL GAS Confirmed our long-term view, now turning sideways.Those who follow us for long, know that we tend to utilize long-term patterns, especially cyclical pattern that give a high probability of return as they filter out the day-to-day noise from the news. Natural Gas (NG1!) is no exception and our multi-year Cycles analysis last January proves that:
As the price continued to free-fall, we now find it useful to better explain the situation to you, to turn back to the 1D time-frame and compare the 2022/23 Cycle to 2014/15. As you see the correlation is fairly high. Both started on a 1D Death Cross, with the 1D RSI deeply overbought. As the price never broke above the 1D MA50 (blue trend-line) since December 20 2022, it appears that we are in a similar level as February 2015 when after a test of the first Support Zone (green), the price rebounded, got rejected on the 1D MA50 and then turned sideways to break it.
It stayed neutral for basically 6 months before starting a new multi-month round of heavy selling. The signal to sell it again was when the price was at its closest to the 1D MA200 (orange trend-line). The downside potential is significant and goes lower than the previous Low of 1.450, which is our long-term target.
-------------------------------------------------------------------------------
** Please LIKE 👍, FOLLOW ✅, SHARE 🙌 and COMMENT ✍ if you enjoy this idea! Also share your ideas and charts in the comments section below! **
-------------------------------------------------------------------------------
💸💸💸💸💸💸
👇 👇 👇 👇 👇 👇
