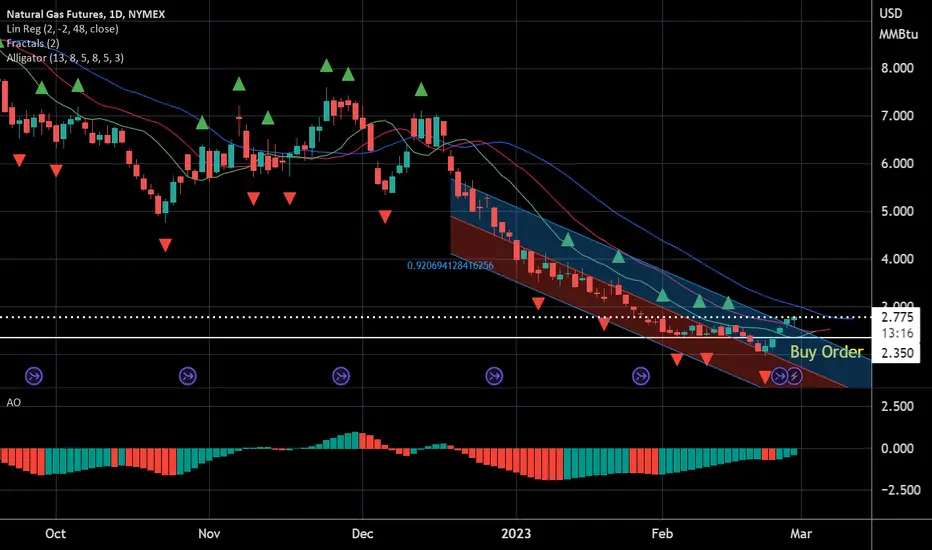
Mar 5,23-NG-is this the pullback?Last week NG went up a hell of a lot...are we ready for a pullback now? We shall see how this week plays out. Should be crazy with the Fed raising rates again on Wed.
If this week closes below 2.6, maybe NG will fall back to 2 next week.
If price action falls anywhere close to 2 THIS week, I will put in a buy order for price to return to the 3 zone.
Heiko
Natural Gas
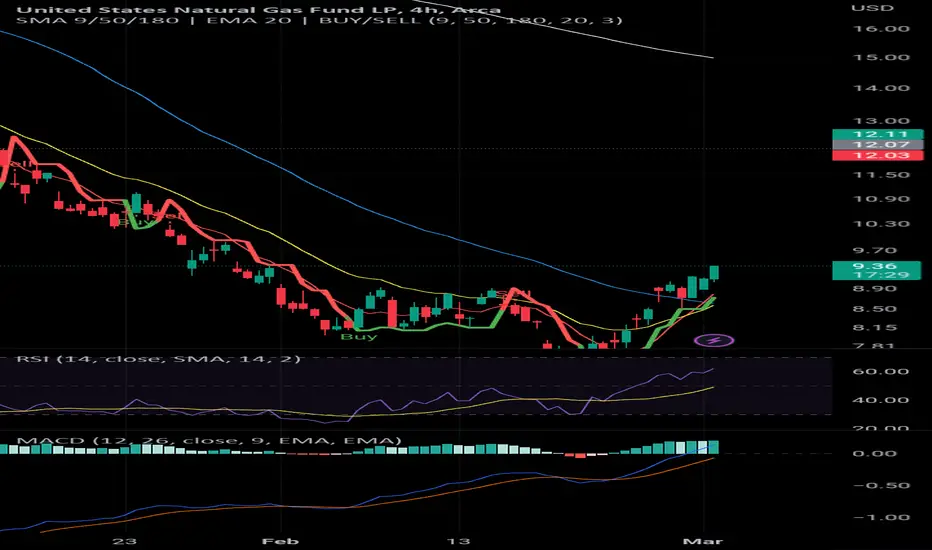
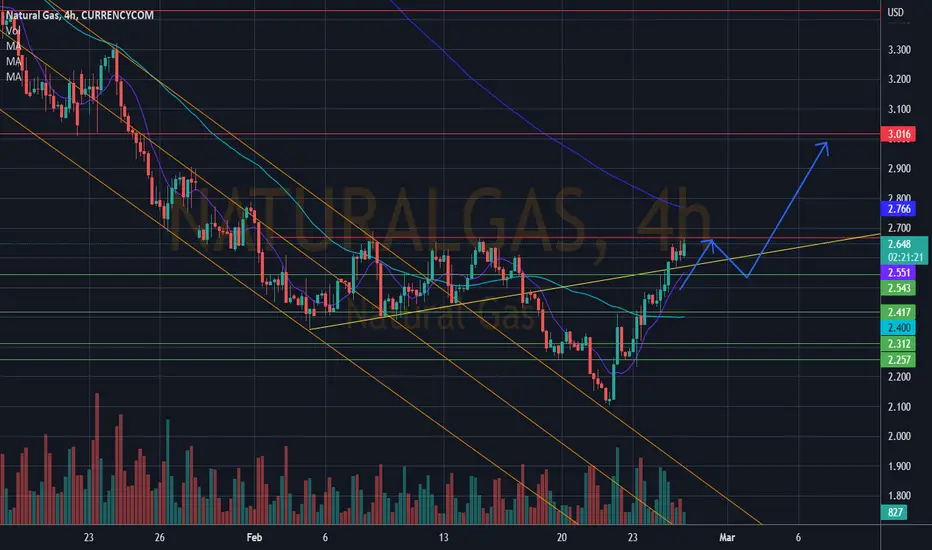
Natural Gas $NG $UNG $BOIL Tips for Riding your Profit- 4H 12EMALast weeks NG video i mentioned that this is likely a climax bottom and we are heading higher with potential inverse H&S pattern, it ended up playing out in the hourly time frame and bulls were a lot stronger than i expected.
- Looking at the 4h time frame 12 EMA as full bull control support if we don't lose it then we wont be getting 4h and daily consolidation yet.
- im still holding my $BOIL position (it 2x leverage of UNG) its a small position so i'm letting it ride at least 20~30% of course ill still be watching how we consolidate on 4h and daily time frame will tell me a lot if the bull move will continue.

NATURAL GAS BULLISH RSI DIVERGENCE IN DAILY TF !!!Hello to everyone,
As we can see there is a Bullish divergence in RSI & PRICE on daily timeframe . This is indicating that price has not much momentum to go downside. We can expect a trend reversal in natural gas but only RSI divergence does not confirms the trend reversal. We need positive price pattern or any bullish candle formation to go upside at the bottom of chart. If any bullish candle or bullish scenario forms than only we can go for the long position.
The green candle indicating price momentum towards upside and green candle has good volume also ,which is showing strength in buyers./b]
Traders, if you liked this idea or if you have your own opinion about it, write in the comments. I will be glad.

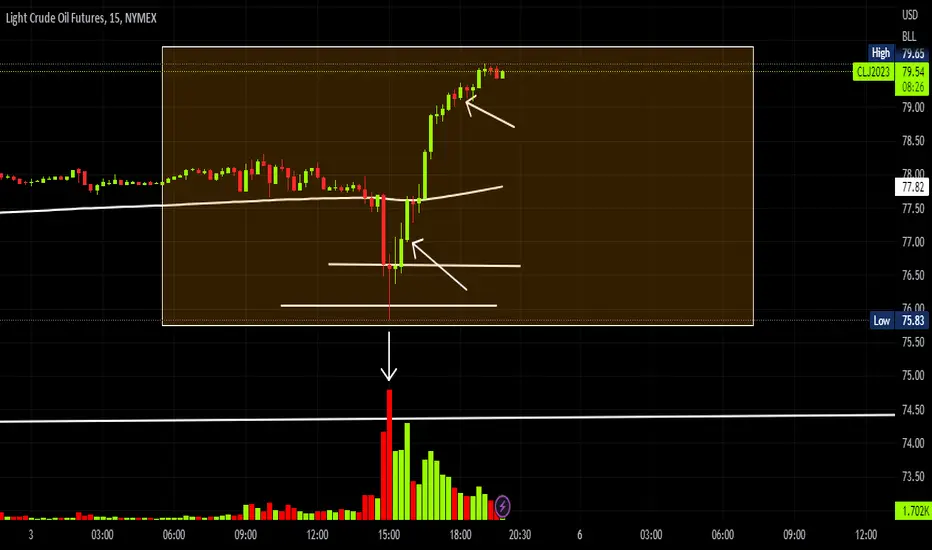
Recap of my trade for todayGood afternoon and good evening traders !
Today we had a great 2 trades on CRUDE OIL, 1st one is the one I published 5h ago when I said to sell, you can see on the chart I drew 2 support lines the price pulled back on, you might wonder how I got those 2 lines it's due to a specific tool I can't share with you.
Well after reaching the lower line we closed and kept waiting for what will happen, then it turned out that the price decided to go long and we got in at the 2nd arrow and closed at the green candle next to the arrow on the right after having the squeeze configuration.
I didn't share the 2nd trade since I have clients I work with privately and it won't be fair to pay for something and I give it for free
For more questions don't hesitate to ask I'll be answering with pleasure
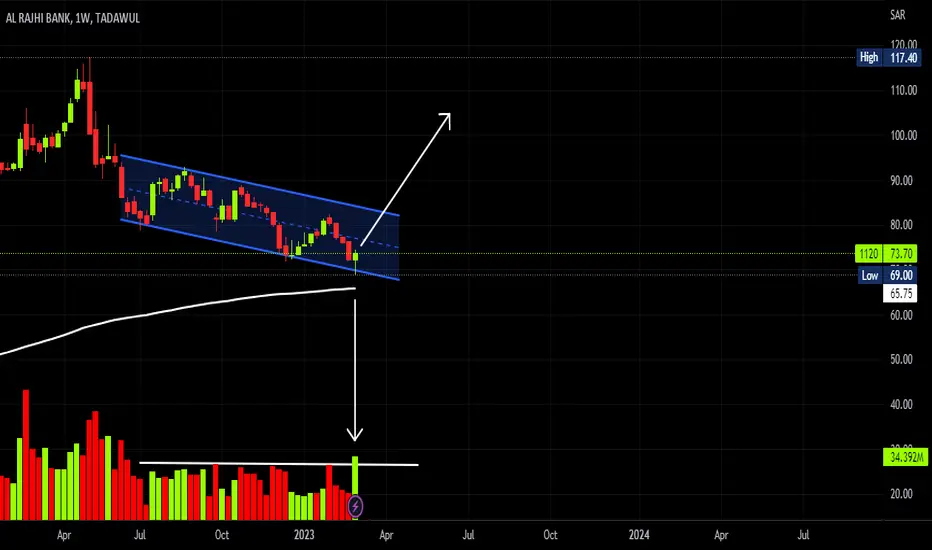
TIME TO BUY AL RAJHI BANK !Dear investors, this is time to buy AL RAJHI BANK stocks. As you can see on the chart the price kept consolidating in a specefic channel the past eight months, I have been waiting for this exact moment to announce you this for the past three months, here we are today. After the consolidation and the small range of volumes, this week we got a high volumed springbox at the end of the down trend, plus it pulled near the 209 EMA. What are you still waiting for ? BUY AL RAJHI BANK stocks !
In case you have any question don't hesitate to ask I'll answer with pleasure
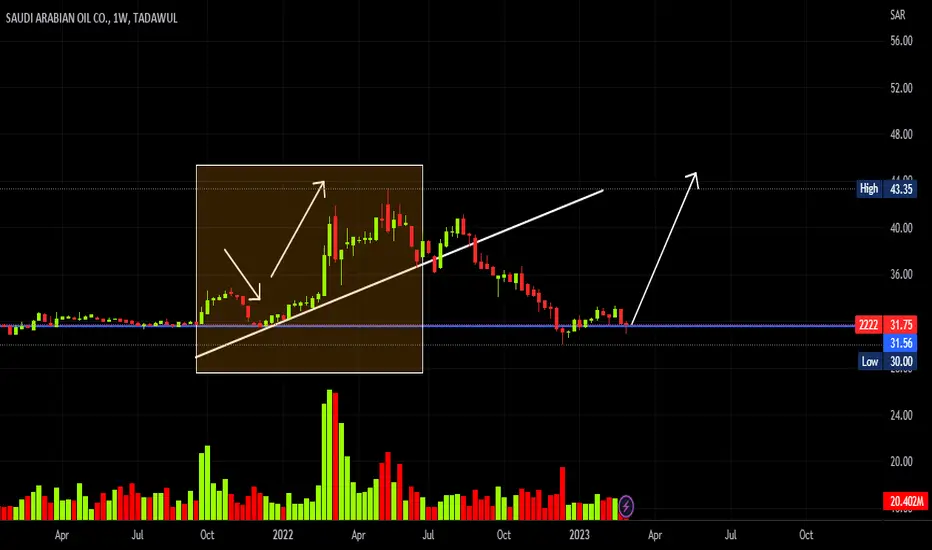
TIME TO BUY ARAMCO !Dear investors, As you can see on the weekly chart, the price last week pulled back on an interesting support it tride to break multiple times and it ended by going up as you can see on the part I drew a box on, after breaking the 1st suport it came back to re test on the main interesting support to continue its way up.
In case you got any question don't hesitate to ask and I'll be answering with pleasure !
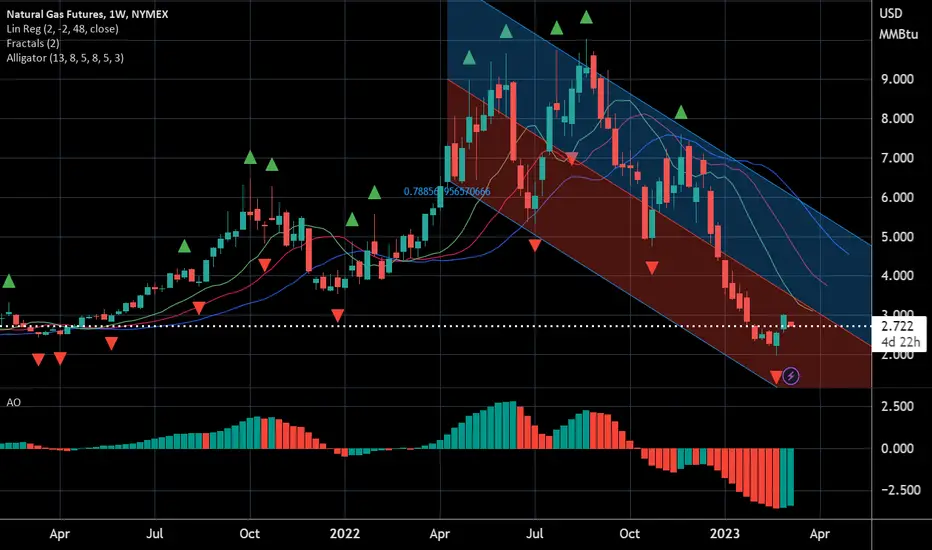
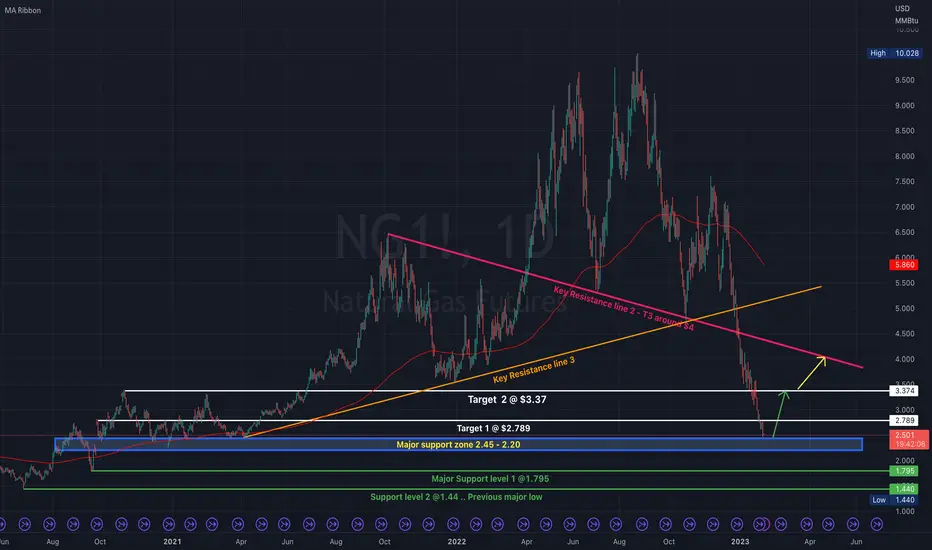
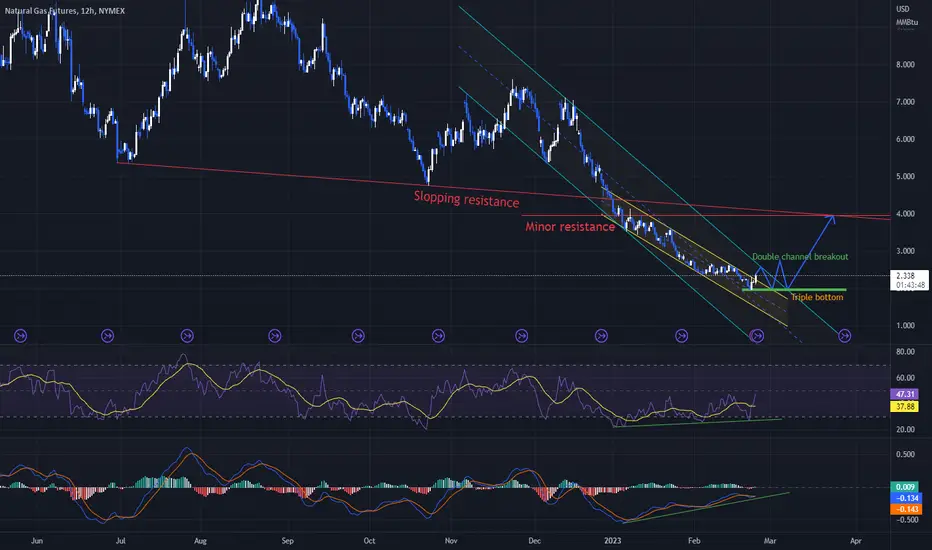
NG1! in oversold zone. Technical bounce target 2.789 , 3.37, 4.0Natural Gas has dropped more than 43% since start of 2023, it's heavily oversold and hitting a major support zone (2.45 - 2.20 levels) , highlighted in blue box. In my previous post, I had a target of 2.33 as per Fib measured levels. I strongly believe we have seen bottom in NG short term, might go lower some more to test the support zone and build a base.
Short term I'm expecting NG to technically bounce to target 2.789, 3.37 levels (white lines).. Best case might test the $4 levels, where the down sloping pink line meets.
For any reason, if 2.20 support levels get broke, we might see lower target $1.795 and 1.44.. I believe we might see these downside targets only after a technical bounce 2.789, 3.37 levels.
Let me know your thoughts in comments section
Natural Gas: Epic Short Squeeze about to happen? Nat Gas got another daily positive close. This chart is looking ultra bullish and we may get to witness one of the greatest short squeezes.

Did You Get In On Time?Week started off great, movement to the upside as predicted. Moving toward the 200 day moving average is another positive note here.
SELL CL1!A bonus trade for you for today, on the chart you can see that the price was consolidating then cut through the channel and now it kept going down. Get in and set SL and TP at your own risk
I'm sorry I can't publish the only after giving my private clients signals after the market moves. Still you can make some profits.

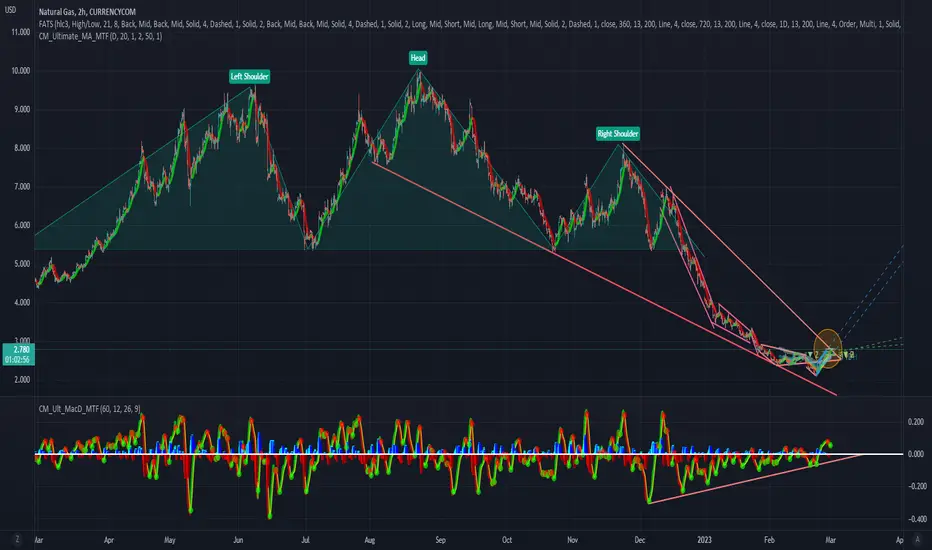
Pivotal day as NG challenges 4 month downtrendNatural Gas is challenging 2.80 level which offers an area of resistance from 4 month downtrend started on Nov 23rd 2022.
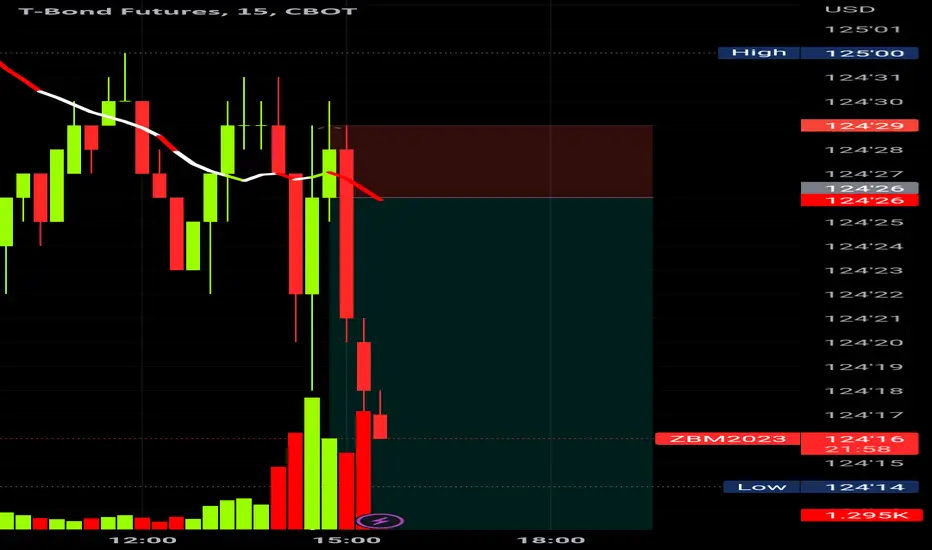
Recap of my trade for todayGood afternon and good evening for european traders, for my trade today on ZB we closed in loss and it's one of normal things in trading and which a lot of people don't show and share, we didn't trade any other market for some reasons.
I'm sharing this just to let beginner traders that trading isn't always winning, somedays you make losses you recover in other days.
Today we got in after pulling wack on the resistance line and added a contract on the place I placed the 2nd arrow, The big green candle came out after the news release turned up the market to continue bullish and closed after few hours.
See you tomorrow in another forecast !
If you got any question don't hesitate to ask.

Feb 28,22 - Closing Order with 400pt ProfitNice little profit maker there...I'm not sure whats going to happen on Thursday with the storage report, hence I'm taking my profit and running.
Also, this is the 5th day in a row of gains for NG so I'm going to wait for a pullback and get back in. I'm assuming price will drop some as people take profits from this last little bull run.
I'll post by Friday again.
Heiko
Time to short KOLDKOLD always loses value over time. Getting the timing right however, is somewhat of an art. You will want to invest when natural gas is over sold and you figure bounces coming then short KOLD.

SELL ZB1!Good morning traders, today I didn't publish at the morning since there wasn't a clear shot to take, Isaw on the ZB a point to get in and I got in earlier and didn't share it since I can't publish it at the same moment I give it to my clients, you still can get it and touch some profits.
SL and TP set them at your own risk
Natural Gas gaining momentumThe rally continues, what's next for Natural Gas?
Massive long term reversal signals on watch.

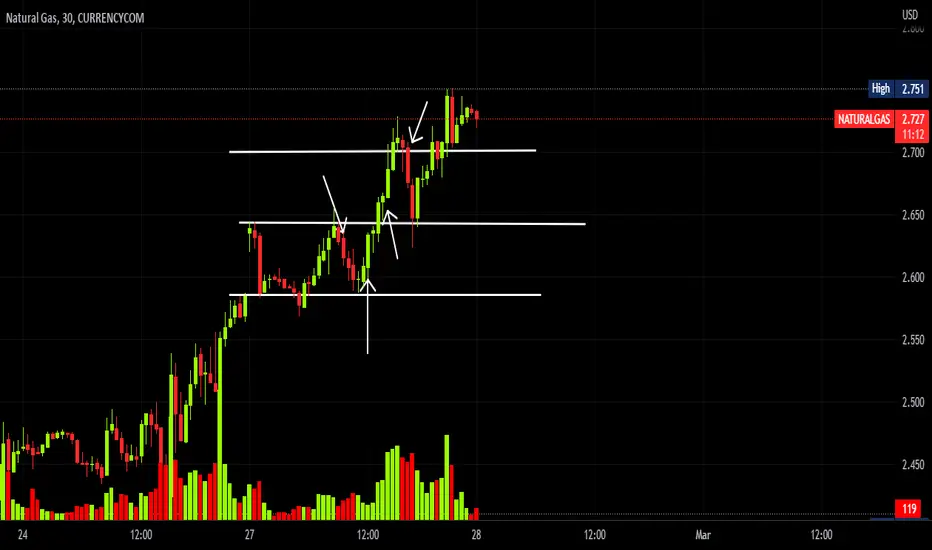
Recap of my trade for todaygood evening and good afternoon american traders, at the morning I posted to sell natural gas and after few candles it turned out to be bullish, I took that whole up trend and I didn't post it since people I give signals to privately didn't like it to be shared, I kept it for us and we touched some good profits for today on NATURALGAS and CRUDE OIL, for the one I posted abou ZB we closed with some minor losses.
Well, on the chart you can notice I drawn some supps and resists, those came from a tool I can't share with the public since it's one of the most important things I follow on my strategy. The 1st arrow on the left signifies the point we got in as sellers after pulling back on the resistance line and getting the confirmation with the red candle, the 2nd one was the point we reversed our position to catch the up trend after having the squeeze configuration and the pullback on the support line. The 3rd arrow signifies the moment we added the 2nd contract and the last one is where we closed after having the squeeze again and the pulling back on the resistance line.
You can notice that I don't use TP since you get small profits while you can make big ones.
In case you got any question don't hestate to ask and I'll be answering with pleasure
Breakout idea on NG!The long awaited breakout may be here. Everyone and there mom has been chomping at the bit for months for this opportunity... Is that a sign that we should not get excited or ape into a long? Its up to you to decide.
I personally have been accumulating $Tell (NG stock) for 2 weeks now and just recently added more on Tuesday.
What do you think NG will do next and what are your trading plans?
Feb 27,22-NG-Was 2 the bottom?Not sure if 2 was the bottom or not, but there was a support/resistance line around 2.3 so I put a Buy Order in on Fri at 2.350 to see if I can catch 500 points.
So far so good but I might cash out shortly. We shall see.
Question is....WAS 2 the bottom? Or will price just reverse this week and head back down to 2? Regardless, keep an eye on your trades - anything can happen and the recession is still coming(even though it's already here but most people don't want to admit it - AND - their realization hasn't shown yet in the markets).
Trade safe, stay safe.
Heiko

NatGas Cup and Handle in the making?On my first public analysis, I suggested that NatGas would reach its 2.66 resistance before any profit taking that could bring it back to its 2.42 support zone. Now that the first target is reached, and considering the strenght/speed at which it got there, I am leaning to the idea that we'll have a cup and handle and not another reverse H&S forming. Therefore, 2.54 is the new support I check. The 2.66 resistance could even be turned as a resistance without a pullback. If it hold, then 3.01 becomes possible short term. Remember that NatGas is usually bullish from March to May. Considering recent behavior of the price, and despite our overall warm winter, we are now getting ready for summer months.
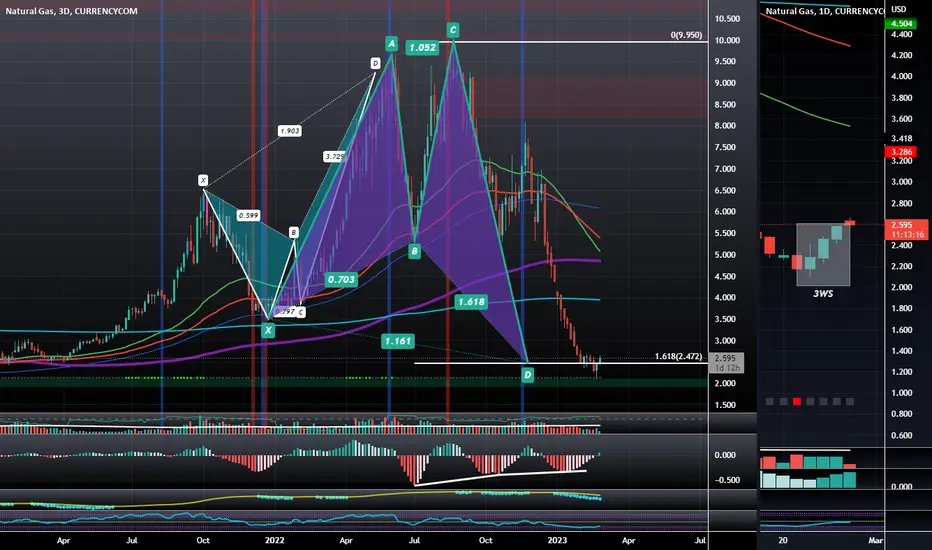
NATURALGAS: 3 White Soldiers at Bullish Shark PCZAt the start of the year Natural Gas had a potential Bullish Shark setup at the minimum .886 PCZ and it ultimately failed to pivot from there but now we are significantly lower at the 1.13/1.618 Confluence zone of this Shark and are showing Bullish Divergence on the MACD as well as a 3 White Soldiers pattern on the daily. The bullish Target for Natural Gas remains to be $4.5 but it could go as high as $9.00. As for stops i'd put it below the second candle of the 3 White Soldiers Pattern which should be below the PCZ.
SELL NATURALGASGood morning traders, today were riding short on NATURALGAS since it touched the resistance line on the top, for me and the persons I work with privately we got in the candle I put an arrow on after getting the confirmation of the pullback, now after crossing the vwap which plays a strong support/resistance in the system I follow we added another contract and said why not to share it with you so you too can make some profits
I don't use TP and SL, set them at your own risk
In case you got any questions don't hesitate to ask.
Fundamental and Technical Analysis | FebuaryTable of Content:
1. Eurozone Inflation Data
2. US Economics Growth
3. NVDA
4. Commodities
5. Technical Analysis
1. Eurozone Inflation Data
The Eurozone's inflation for the month of January has exceeded the previously estimated figures, as reported by MarketWatch on February 23. It has been emphasized by policymakers that the economy is undergoing a disinflation process, and a soft landing has been achieved. However, the recent surge in inflation within the European Union implies a substantial escalation in interest rates.
2. US Economic Growth
The US economy experienced a less robust economic expansion than previously estimated in the fourth quarter, as evidenced by a downward revision in consumer spending. This adjustment has resulted in weaker economic growth (Bloomberg).
The total amount of outstanding credit card debt in the United States has reached $986 billion, with an average interest rate of 20%. This marks the highest level of credit card debt since the 1980s and translates into an interest payment of $200 billion per year. These figures do not include other forms of debt such as mortgages, student loans, and car loans, which are likely to exacerbate the situation. At the same time, the US government is paying over $200 billion in interest payments
The Personal Consumption Expenditures Price Index has risen from 5.3% to 5.4%, however, this data alone is insufficient to support the notion of disinflation. The Gross Domestic Product (GDP) has been revised downwards from 2.9% to 2.7% (a decrease of 0.2%) from the preceding quarter. According to Bloomberg, the US economy experienced a weaker expansion than originally projected.
Revised fourth-quarter inflation figures have been adjusted upward.
Additionally, JP Morgan's Jamie Dimon stated that "The Federal Reserve has lost a little bit of control of inflation". He has been warning about the economy for a while and I believe that he knows something is cracking as we speak.
3. NVDA
The stock price of $NVDA experienced double-digit growth. The stock price has risen by 100% since the beginning of the year. Revenues and profits have both decreased by 21% and 52% respectively on a year-over-year basis, and every segment of the business has exhibited a decline over the same period. The CEO placed significant emphasis on the importance of Artificial Intelligence, yet he sold stocks worth over $100 million prior to the market's significant downturn and may presently be engaged in additional sales.
4. Commodities
The statement suggests an anticipated appreciation in the value of the US dollar, which is reflected in the downward movements of gold, silver, platinum, copper, and various grains such as corn, rice, and soybean. Conversely, energy commodities are experiencing an upward trend, with natural gas exhibiting a significant increase.
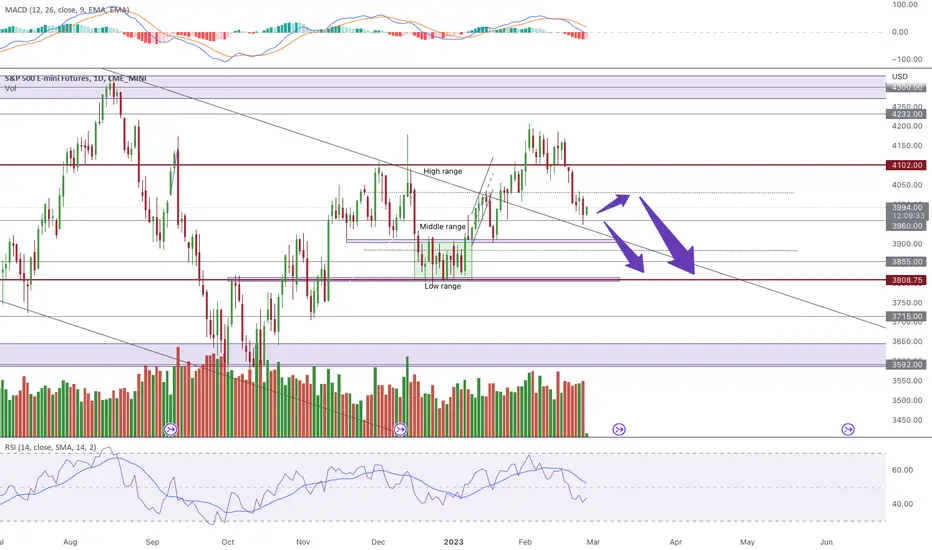
5. Technical Analysis
The 21-day weighted ratio of equity-only put-to-call options is suggestive of a preponderance of puts in the market and indicates a significant degree of buying pressure. This metric has demonstrated a high degree of efficacy in identifying market highs and lows by suggesting a move in the opposite direction to the put/call ratio. Notably, during the present bear market, the ratio has achieved a 100% success rate. Furthermore, the current volume of call options is the highest on record, and retail investors are contributing $1.1 billion daily to the market.
-Momentum indicators: RSI and MACD moving downwards and volume remain below average (bearish)
As previously stated, " I will take the opportunity of a rise in equity markets to short BTC at higher levels". I have now filled all my short position on BTC in a confident manner. Below is my BTC outlook
Conclusion:
The recent market rally, spurred by technical indicators, high-quantity puts, and government emphasis on disinflation, has led to a surge in retail investment. As a result, prices for some assets have skyrocketed, and the quantity of long positions in the market has reached alarming levels. This suggests an overabundance of buying and a lack of liquidity that could cause the market to dip and potentially result in retail closures, as inflation has proven to be more persistent than anticipated by governments. I remain committed to my long-term investment plan, I am acknowledging the growing fissures in some economies that could lead to a catastrophic downturn. It is essential to remain vigilant and prepare for potential market turbulence in the future.
As previously mentioned, my portfolio consists of short-term bonds, USD, SPX shorts, BTC Shorts, small quantity gold, and just acquired Natural gas contracts.
For personal records but feel free to discuss or argue.