Will Europe's Gas Gambit Reshape the Global Energy Landscape?In a bold move reverberating across global energy markets, Ukraine's decision to halt Russian gas transit on New Year's Day 2025 has ushered in a new era of energy geopolitics. This watershed moment not only challenges decades-old supply patterns but also tests Europe's resilience and strategic foresight in securing its energy future. The immediate market response, with gas prices surging to levels unseen since late 2023, underscores the significance of this pivotal shift.
Against this backdrop of uncertainty, Norway's Troll field has emerged as a beacon of hope, setting unprecedented production records and demonstrating Europe's capacity for strategic adaptation. With production reaching 42.5 billion standard cubic meters in 2024, this achievement showcases how technological innovation and operational excellence can help reshape traditional energy dependencies. Meanwhile, BMI's forecast of a 40% price increase for 2025 signals the complex interplay between supply disruptions, growing demand, and market expectations.
The transformation of Europe's energy landscape extends beyond mere supply chain reorganization. While countries like Slovakia, Austria, and Moldova face immediate challenges in securing alternative gas sources, the broader European response highlights a remarkable shift in energy security strategy. With storage facilities maintaining robust levels and infrastructure upgrades underway, Europe's energy transition demonstrates how geopolitical challenges can catalyze innovation and strategic resilience in the global energy sector.
Natural Gas

Nat Gas: Trading the WeatherNYMEX: Micro Henry Hub Natural Gas Futures ( CME_MINI:MNQ1! )
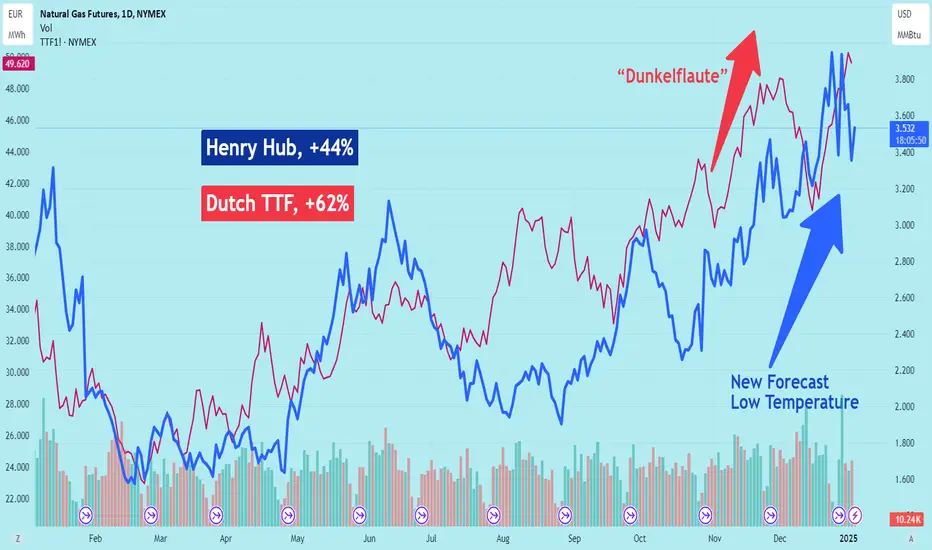
On December 31, 2024, the lead contract of NYMEX Henry Hub Natural Gas futures closed at $3.6330 per MMBtu. This marked a strong gain of 44.5% year-over-year, making it the best performing active futures contract for the year.
Nat Gas is one of the most actively traded commodities. According to CME Group:
• Henry Hub booked record trading volume in 2024. Average daily volumes for futures and options were 566,000 and 242,000 contracts, respectively.
• As of last Friday, Open Interests were 1,511,978 for futures and 775,176 for options.
The Basic
Natural gas is a leading energy source for global economy. While clean energy generates a lot of buzz these days, natural gas still carries the biggest load in power generation. The U.S. Energy Information Administration (EIA) estimates U.S. electricity production at 4.18 trillion kilowatt-hours in 2023.
• About 43.1% of the electricity was generated by natural gas.
• Nuclear power contributed to 18.6%, while coal had a 16.2% share.
• Combined, Renewables accounted for a 21.4% share, including 10.2% from Wind, 5.7% from Hydro, and 3.9% from Solar.
The price of a commodity is determined by its supply and demand. In the case of electricity, it is hard to store while its demand is highly unpredictable. New storage technology is limited by capacity and high cost. With Nat Gas being the biggest energy source, unforeseen changes in power demand could send shock waves into the market.
Weather factors, in particular temperature, have the biggest impact in power demand.
• In the summer months, the biggest power usage is for air conditioning cooling. Cooling Degree Day (CDD) is the number of days in a month where the average daily temperature is above 68 degrees Fahrenheit.
• In the winter months, the biggest power usage is for heating home and offices. Heating Degree Day (HDD) is the number of days in a month where the average daily temperature is below 68 degrees Fahrenheit.
Energy traders deploy CDD/HDD analysis and weather forecast models to predict temperature trends, electricity demand and the subsequent natural gas use.
The Weather Shocks
On December 29, 2024, the Weather Co. and Atmospheric G2 released a weather forecast for January showing colder than average temperature in the East, specifically from Florida to Maine as well as certain parts of the Great Lakes.
In a separate report, AccuWeather meteorologists said that the colder air could trigger a winter storm with substantial snow and ice for a significant portion of the month’s first half. They added that the drop will begin in the middle and latter part of next week.
When the futures market opened the next day, the price of Henry Hub futures surged 20%, hitting a new 52-week high of $4.20.
Earlier in the winter, Germany experienced the so-called “Dunkelflaute” with no wind and a clouded sky. This is the worst scenario for wind and solar power. As Germany is heavily reliant on renewable energy, when the weather fails to cooperate, its power supply drops by half, sending electricity prices sky high.
The huge supply gap prompted energy companies to turn on gas-fueled backup power plants, pushing the Dutch TTF ( NYMEX:TTF1! ) natural gas contracts to a record high.
At the time of this writing, severe winter storms are sweeping across the Central Plains in the U.S., bringing heavy snow, sleet, and frozen rain from Kansas to Missouri, Illinois, Indiana, Kentucky, Ohio and Washington, D.C. Apart from the winter hazards, I expect higher power consumption to keep people warm from the below-average temperatures.
Trading with Micro Henry Hub Futures
Micro Henry Hub natural gas futures (MNG) offer smaller-sized versions of CME Group’s liquid benchmark Henry Hub futures (NG) contracts. The Micro futures have a contract size of 1,000 MMBtu, which is 1/10th of the standard contract. The Micro contracts allow traders to control a large contract value with a small amount of capital.
With Friday settlement price of $3.354, each February contract (MNGG5) has a notional value of $3,354. Buying or selling one contract requires an initial margin of $366.
Since its Monday high, Henry Hub prices have plunged 20%. Subsequent updated weather forecasts now predicted warmer trends for the Eastern US, which could curb heating demand for Nat Gas. Losses accelerated last Friday after the EIA reported that Nat Gas inventories for the week of December 27th fell -116 bcf, a smaller draw than expectations of -128 bcf.
In my opinion, the draw was lower due to the reduced economic activity around the Christmas holiday. For the same token, we could see a smaller draw during the New Year. However, I consider this data seasonal outliners, rather than a longer-term trend.
Global warming doesn’t necessarily mean warmer winters. Higher global temperature brings moisture from the ocean, with wetter atmosphere generating more extreme weather events. I expect winter temperature patterns to shift to much colder-than-normal, with cool anomalies poised to stick around key population centers deep into the winter.
As we have seen in the past, unpredictable weather events could send large shocks to natural gas prices. With Micro Henry Hub contracts, traders could potentially realize sizable gains with a small capital requirement.
Hypothetically, if the February prices move up 10% to $3.689 with lower temperature forecasts, the $0.3354 price gain would translate into $335.4 for a long futures position, given the contract size at 1,000 MMBtu. Using the initial margin of $366 as a cost base, the trade would produce a theoretical return of 99.6% (=335.4/366).
The long futures position would lose money if Nat Gas prices continued to trend lower.
Happy Trading.
Disclaimers
*Trade ideas cited above are for illustration only, as an integral part of a case study to demonstrate the fundamental concepts in risk management under the market scenarios being discussed. They shall not be construed as investment recommendations or advice. Nor are they used to promote any specific products, or services.
CME Real-time Market Data help identify trading set-ups and express my market views. If you have futures in your trading portfolio, you can check out on CME Group data plans available that suit your trading needs tradingview.sweetlogin.com
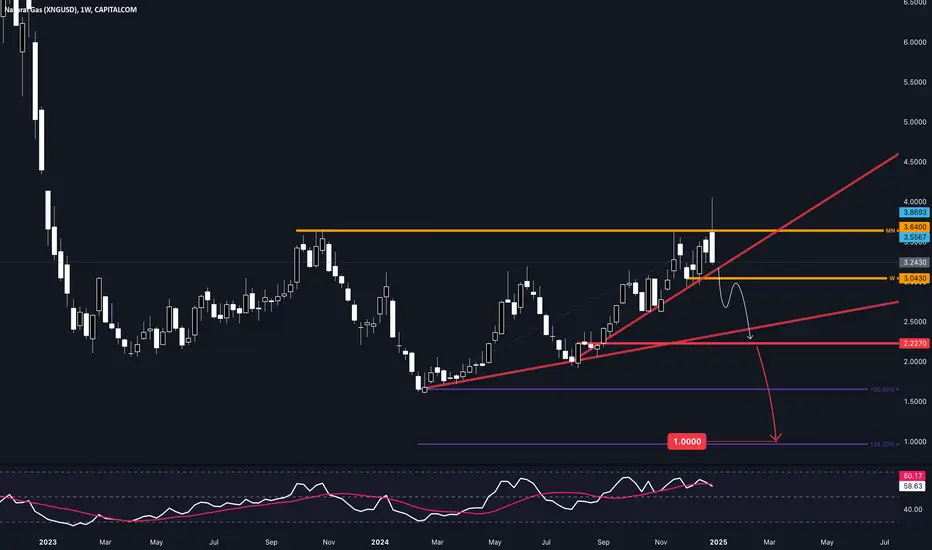
NATGAS // Can you imagine $1?This weekly candle looks bearish. It's even more bearish if we take into account that it was printed on the monthly impulse base.
It means that the monthly trend is still short, and if the weekly gets aligned, the price may target the last clean weekly breakout (red), where the countertrend line also breaks, and where the $1 for natural becomes a nice target.
Do you see it coming?
———
Orange lines represent impulse bases on major timeframes, signaling the direction and validity of the prevailing trend by acting as key levels where significant momentum originated.
Level colors:
Daily - blue
Weekly - purple
Monthly - magenta
H4 - aqua
Long trigger - green
Short trigger - red
———
Stay grounded, stay present. 🏄🏼♂️
<<please boost 🚀 if you enjoy💚
Natgas to take the top again.Natgas has filled FVG. let it consolidate for 8-10 hours. Look for buys to take the top once more.
4.5 is the next target

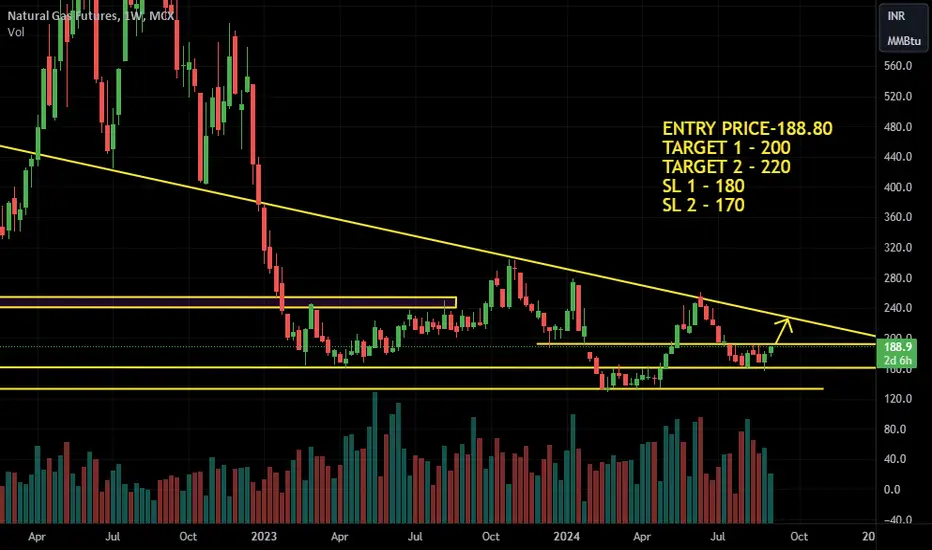
NATURAL GAS FUTURE may catch Fire...MCX:NATURALGAS1! trade at 188.80. After breakout you can watch for 200 & 220 target with SL of 180 & 170
Cold Weather Sparks Natural Gas Rally – $5+ in Sight!🔥 Natural Gas Breaks Out – Bulls Charge as Cold Weather Fuels Demand! 🔥
Natural Gas Futures are soaring, backed by January’s colder-than-expected weather forecasts driving heating demand. The breakout above the critical $3.614 level signals powerful bullish momentum, with prices now trading around $3.8610 .
🚀 Why This Rally is Just Getting Started:
$3.614: A Key Level Overcome
Previously a strong resistance, this level had historically acted as support. Its decisive break confirms a shift in market dynamics and solidifies the bullish trend.
Gap to Be Filled at $4.1681
A price gap at $4.1681 suggests a strong upward magnet, as markets often seek to close such gaps. This aligns perfectly with the next major resistance target.
🌟 Trade :
Current Price: $3.8610
Take Profit 1: $4.1681 – The gap-fill level and next major resistance zone.
Take Profit 2: $5.3064 – A long-term target if cold weather continues to drive demand.
Stop Loss: $3.4300 – Protect your capital below this level, as it marks the lower boundary of this bullish momentum.
Natural gas is heating up, and the market is poised for an extended rally. The breakout above a historically significant level, combined with the gap at $4.1681, underscores strong bullish potential. With January’s cold weather expected to persist, this rally could have plenty of room to run.
The bulls are in control – ride the wave to new highs! 🐂🔥

Bullish on Natural Gas - January 280 Call OptionSummary: I'm bullish on the Natural Gas January 280 call option. Here's my trade idea:
Current Price: Closed at ₹24.76 on December 27, 2024.
Entry:
Best Buying Price: Aim to enter below ₹18.80 for optimal risk-reward.
Target:
Price Target: Looking towards ₹37-₹40.
Rationale:
The current market conditions suggest potential for an upward movement in natural gas prices, supported by seasonal demand increases and possible geopolitical tensions affecting supply.
Technical analysis indicates a potential breakout if the price sustains above key support levels.
Risk Management:
Set a stop-loss just below ₹16 to minimize potential losses if the market moves against the position.
Position size should be managed to ensure the trade aligns with your risk tolerance.
Time Frame:
This trade is for the January expiry, giving us a tight window to capitalize on the expected price increase.
Disclaimer: This is not financial advice but a personal trading idea. Always do your own research and consider your financial situation before trading.
Let's see if we can catch that wave up to ₹37-₹40!

Natural Gas | Oil | Dollar | Silver | Gold Price ForecastNatural Gas | Oil | Dollar | Silver | Gold Price Forecast

Natural Gas | Oil | Dollar | Silver | Gold Price ForecastNatural Gas | Oil | Dollar | Silver | Gold Price Forecast

"NATURAL GAS" Commodities Market Bullish Heist PlanHello!! My Dear Robbers / Money Makers & Losers, 🤑 💰
This is our master plan to Heist "NATURAL GAS" Commodities Market based on Thief Trading style Technical Analysis.. kindly please follow the plan I have mentioned in the chart focus on Long entry. Our target is Red Zone that is High risk Dangerous level, market is overbought / Consolidation / Trend Reversal / Trap at the level Bearish Robbers / Traders gain the strength. Be safe and be careful and Be rich.
Entry 📈 : Can be taken Anywhere, What I suggest you to Place Buy Limit Orders in 15mins Timeframe Recent / Nearest Low Point take entry should be in pullback.
Stop Loss 🛑 : Recent Swing Low using 2H timeframe
Target 🎯 : 3500.0
Attention for Scalpers : Focus to scalp only on Long side, If you've got a lot of money you can get out right away otherwise you can join with a swing trade robbers and continue the heist plan, Use Trailing SL to protect our money 💰.
Warning : Fundamental Analysis news 📰 🗞️ comes against our robbery plan. our plan will be ruined smash the Stop Loss 🚫🚏. Don't Enter the market at the news update.
Loot and escape on the target 🎯 Swing Traders Plz Book the partial sum of money and wait for next breakout of dynamic level / Order block, Once it is cleared we can continue our heist plan to next new target.
💖Support, Like and follow our Robbery plan we can easily make money & take money 💰💵 Follow, Like & Share with your friends and Lovers. Make our Robbery Team Very Strong Join Ur hands with US. Loot Everything in this market everyday make money easily with Thief Trading Style.
Stay tuned with me and see you again with another Heist Plan..... 🫂

Natural Gas | Oil | Dollar | Silver | Gold Price ForecastNatural Gas | Oil | Dollar | Silver | Gold Price Forecast

"NATURAL GAS" Commodities Market Bullish Heist PlanHola! Ola! My Dear Robbers / Money Makers & Losers, 🤑 💰
This is our master plan to Heist "NATURAL GAS" Commodities Market based on Thief Trading style Technical Analysis.. kindly please follow the plan I have mentioned in the chart focus on Long entry. Our target is Red Zone that is High risk Dangerous level, market is overbought / Consolidation / Trend Reversal / Trap at the level Bearish Robbers / Traders gain the strength. Be safe and be careful and Be rich.
Entry 📈 : Can be taken Anywhere, What I suggest you to Place Buy Limit Orders in 15mins Timeframe Recent / Nearest Low Point take entry should be in pullback.
Stop Loss 🛑 : Recent Swing Low using 2H timeframe
Target 🎯 : 3.500
Attention for Scalpers : Focus to scalp only on Long side, If you've got a lot of money you can get out right away otherwise you can join with a swing trade robbers and continue the heist plan, Use Trailing SL to protect our money 💰.
Warning : Fundamental Analysis news 📰 🗞️ comes against our robbery plan. our plan will be ruined smash the Stop Loss 🚫🚏. Don't Enter the market at the news update.
Loot and escape on the target 🎯 Swing Traders Plz Book the partial sum of money and wait for next breakout of dynamic level / Order block, Once it is cleared we can continue our heist plan to next new target.
💖Support our Robbery plan we can easily make money & take money 💰💵 Follow, Like & Share with your friends and Lovers. Make our Robbery Team Very Strong Join Ur hands with US. Loot Everything in this market everyday make money easily with Thief Trading Style.
Stay tuned with me and see you again with another Heist Plan..... 🫂

Turbulent Times Ahead for Natural Gas MarketNatural gas prices began the week with a gap-up, driven by forecasts of colder weather increasing demand, but have since faced strong selling pressure, making traders cautious.
◉ Technical Analysis
● A bullish turnaround seems imminent for Natural Gas prices, highlighted by the appearance of an Inverted Head & Shoulder pattern on the daily chart.
● After breaking out, the price momentarily reached the $3.290 resistance level before retreating and revisiting the breakout point.
● The price is now attempting to breach the resistance zone again, with expectations of exceeding the level soon.
● However, a drop below $2.800 could trigger a further correction.
◉ Overall Outlook
Natural gas prices are poised for a volatile week as traders weigh colder weather expectations against bearish technical signals. Thursday's inventory data will be crucial in determining the next price move.

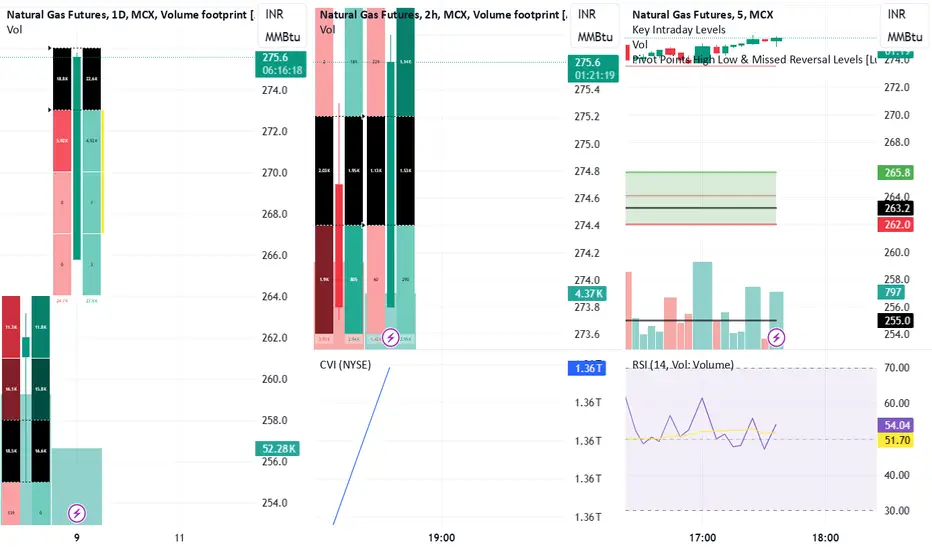
Short Term Trade Idea Natural Gas Buy at ₹ 275/- Target ₹ 295/-. Buyer's are buying and it will move to ₹ 287/- in short term. Don't panic if some reverse happens to ₹ 257/-. If you will wait, again price will rebound like it happened in last week.
Natural Gas | Oil | Dollar | Silver | Gold Price ForecastNatural Gas | Oil | Dollar | Silver | Gold Price Forecast

NATGAS BULLISH BIAS|LONG|
✅NATGAS fell again to retest the support of 3.20$
But it is a strong key level
So I think that there is a high chance
That we will see a bullish rebound and a move up
LONG🚀
✅Like and subscribe to never miss a new idea!✅

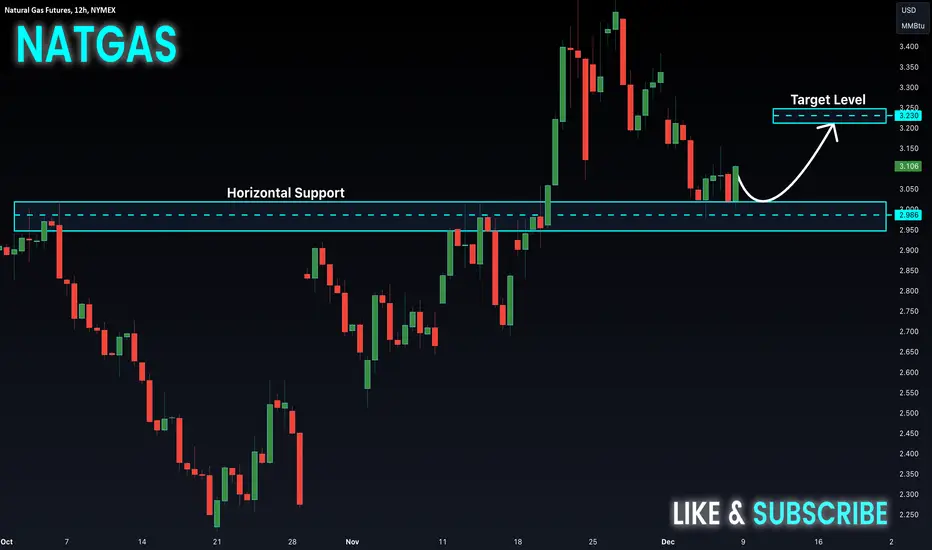
NATGAS Will Grow! Buy!
Hello,Traders!
NATGAS made a retest of
The horizontal support level
Of 3.00$ and we are already
Seeing a local bullish rebound
So we will be expecting a
Further bullish move up
Buy!
Comment and subscribe to help us grow!
Check out other forecasts below too!
Natural Gas Prices Rebound from 2.5-Month LowNatural Gas Prices Rebound from 2.5-Month Low
On 19 November, we analysed the natural gas price chart, noting:
→ the formation of an upward channel (marked in blue);
→ a potential bullish attempt to break the key $3.200 level, which had acted as resistance (highlighted with arrows).
As seen on the XNG/USD chart, the price did rise above $3.200 but failed to hold. After fluctuating in the upper half of the channel, it dropped below $3.200 to the channel's lower boundary, driven by:
→ a bearish report from the Energy Information Administration, showing US gas inventories above the five-year average;
→ a report from financial firm LSEG noting increased average gas production across 48 US states.
This decline pushed natural gas prices to a 2.5-month low around the $2.935 level.
What Could Happen Next?
From a technical perspective on the XNG/USD chart:
→ support from the channel's lower boundary (reinforced by the psychological $3.000 mark) is already evident in an emerging price reversal (indicated by an arrow);
→ on the other hand, the $3.200 level may resume acting as resistance.
It’s likely that natural gas prices will fluctuate between $3.000 and $3.200, with weather forecasts playing a decisive role in shaping consumption expectations for the winter season.
This article represents the opinion of the Companies operating under the FXOpen brand only. It is not to be construed as an offer, solicitation, or recommendation with respect to products and services provided by the Companies operating under the FXOpen brand, nor is it to be considered financial advice.

NaturalGas enters resistance zone. H4 25.11.2024⛽️ NaturalGas enters resistance zone 📉
On gas the price has entered the zone of strong resistance 3.51-3.63 from which I expect a new exit of the price down. Now on the comeback a false break above is possible, but in general the zone for selling is strong. I aim for a bounce down to 3.0 and 3.15, and there will clarify. The main support is near 3.0 and there is the boundary of the ascending channel from which they can bounce up again.
FX:NGAS

NATGAS BULLISH REBOUND AHEAD|LONG|
✅NATGAS will be retesting a support level of 3.128$ soon
From where I am expecting a bullish reaction
With the price going up but we need
To wait for a reversal pattern to form
Before entering the trade, so that we
Get a higher success probability of the trade
LONG🚀
✅Like and subscribe to never miss a new idea!✅
Natural Gas | Oil | Dollar | Silver | Gold Price ForecastNatural Gas | Oil | Dollar | Silver | Gold Price Forecast

NATURAL GAS - 2025 IS THE LAST YEAR IT WILL BE CHEAP !📣 Hello everyone!
I believe that with a high degree of probability, a long-term reversal model "Inverted head and shoulders" is being formed on the price chart of natural gas.
If the above is true, then in 2025 the right shoulder will be formed and this is the last year when natural gas will cost so cheap $$ !
From my point of view, after the "Inverted head and shoulders" model finds its confirmation, or if the high 9.1560$ is broken even earlier, WE CAN CONDITIONALLY SAY THAT THE PRICE OF GAS WILL NEVER DROP <1.5$ AGAIN - IN MY UNDERSTANDING, THIS PROBABILITY IS >90%
Oil will also form a bottom next year and from the end of 2025 - the beginning of 2026, I expect the beginning of a long-term bull market!
That's all for today, I wish you good luck in making independent trading decisions and profit. Please analyze the information received from me, always think only with your head!
Goodbye! ✊

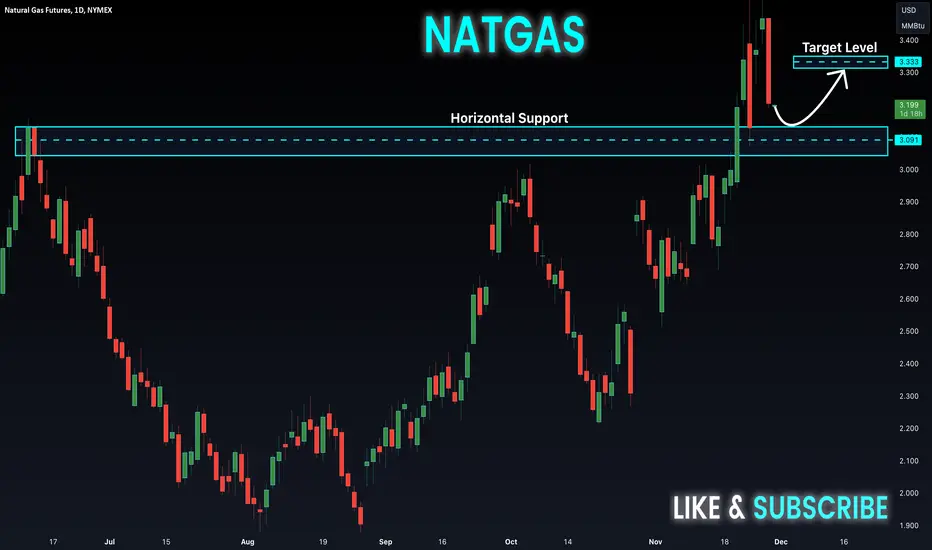
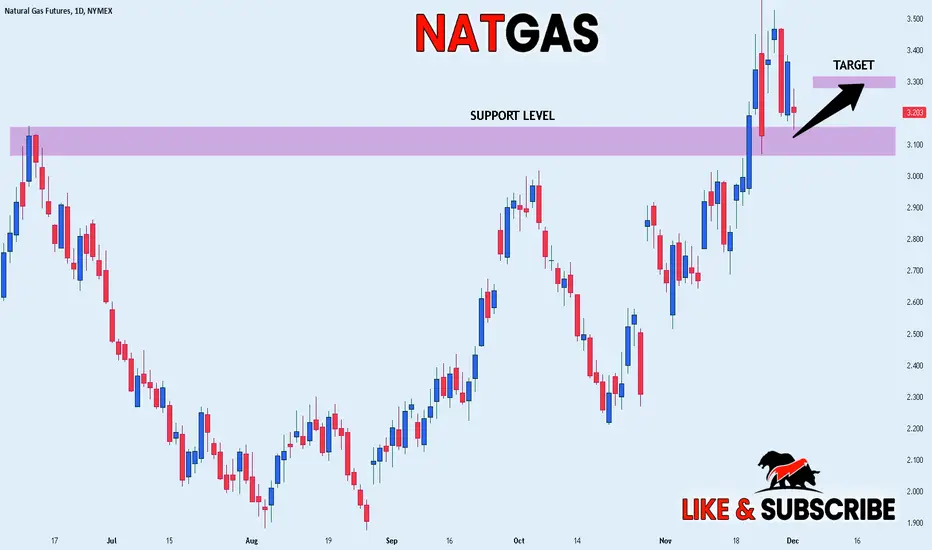
NATGAS Support Ahead! Buy!
Hello,Traders!
NATGAS is going down to
Retest the horizontal support
Of 3.09$ and as we are
Locally bullish biased
We will be expecting a
Local bullish rebound
Buy!
Comment and subscribe to help us grow!
Check out other forecasts below too!