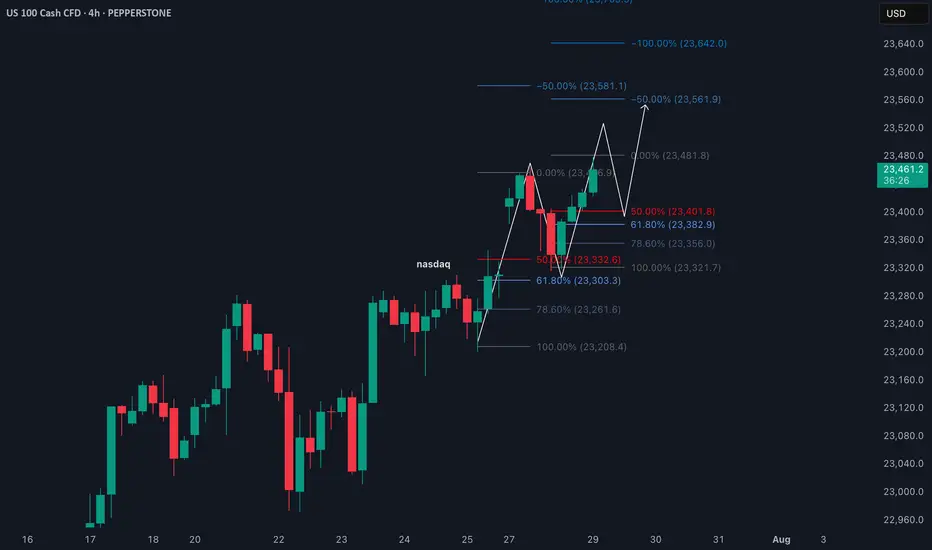
NAS100 Trade Idea: Liquidity Sweep & Bullish Reversal Potential📊 NASDAQ 100 (NAS100) Trade Outlook 📈
The NASDAQ 100 is holding a strong bullish trend on the higher timeframes 🟢. However, we’re currently seeing a notable pullback into a key support zone ⚠️ — price has dipped beneath previous lows, tapping into what appears to be an institutional accumulation range 🏦.
This move is likely targeting the liquidity resting below those lows 💧, where sell stops are positioned. Price is also reacting off a significant bullish order block 🧱 — a confluence area that could produce a strong reversal.
🎯 What to look for next:
Wait for a bullish break in market structure 🔁 to confirm a potential entry. If that occurs, consider a long setup with your stop loss below the swing low 🛑 and a 1:2 risk-to-reward target 🎯.
🚫 This is for educational purposes only and not financial advice.
NASDAQ 100 CFD

Fibonacci Retrace Strategy NAS100 Trade Idea📈 NASDAQ 100 (NAS100) is holding a strong bullish trend 🚀. After a weekend gap-up 🕳️➡️📈, price retraced back into the gap zone—exactly what you'd expect in a healthy trending market.
🔍 I'm applying my Fibonacci Expansion + Retrace Strategy 🔢, watching closely for a pullback into equilibrium ⚖️ within the previous price swing. That’s where I’ll be waiting for a bullish market structure break 🔓📊 to confirm my long bias.
🧠 Patience is key here—let the setup come to you.
📌 As always, this is not financial advice!
$NDX 3rd Bearish EngulfingSlowly but surely we are seeing deteriorating conditions in every major indices.
NASDAQ:NDX closed and formed the 3rd BEARISH engulfing in 2 weeks, RARE!
Light volume so it's not definitive, but alarming.
TVC:DJI keeps weakening.
SP:SPX many RED candles & bearish engulfing as well.
Light volume though.

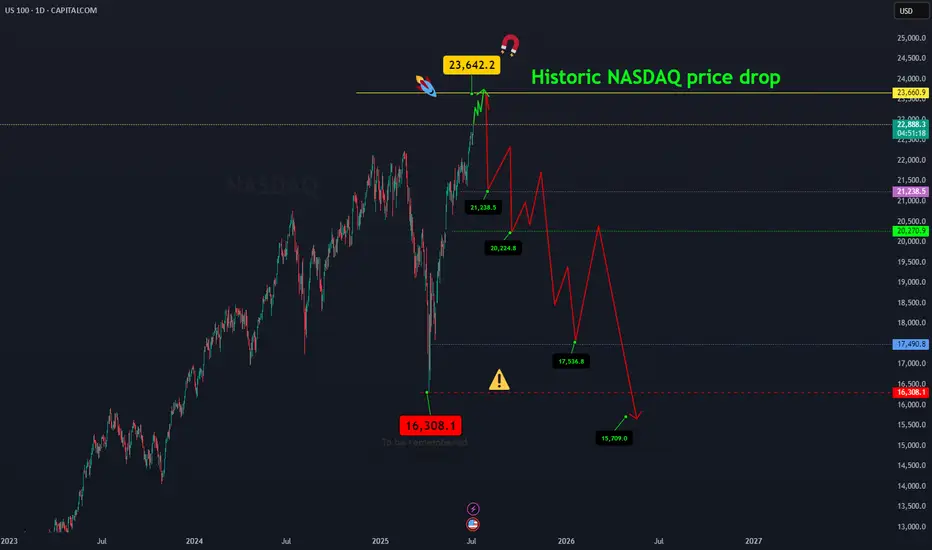
NASDAQ price dropAfter the Nasdaq price reaches around 23642.2, a historic drop will occur and the target is to drop to 16308.
Whatever happens at the highest price, the final destination is towards 16308.
I have identified the price levels in the middle of this expected drop that can cause the price to correct.
IG:NASDAQ
Eyes on 23,442.78 ( us 100 )The Nasdaq has the potential to move upward from the identified price levels of 23,297.64 and 23,259.52, targeting 23,442.78." CMCMARKETS:NDAQ100

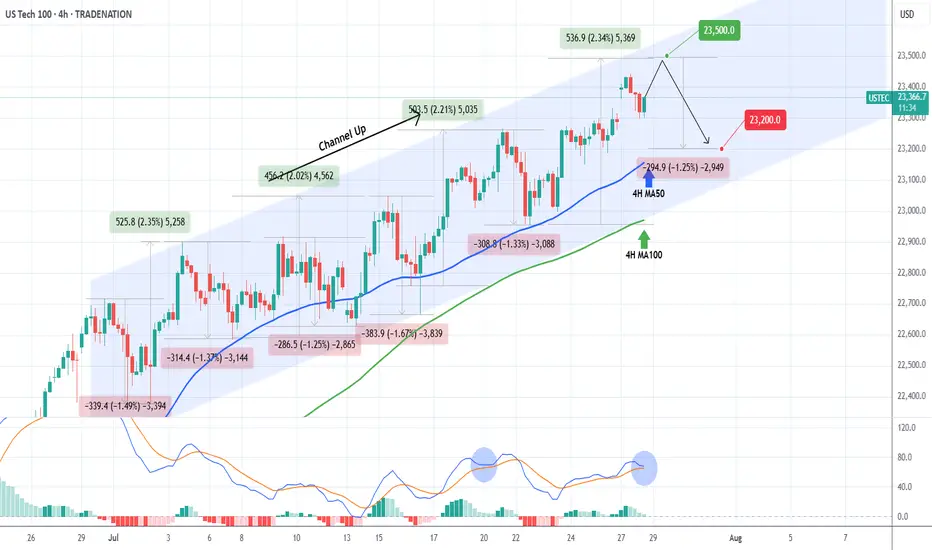
NASDAQ Channel Up to be rejected soon.Nasdaq (NDX) has been trading within a Channel Up since the start of the month. The primary Support level has been the 4H MA50 (blue trend-line), which hasn't closed a 4H candle below it since July 14.
Right now the index is on its latest Bullish Leg, which can technically extend by +2.35% (max such Leg within the Channel Up).
We expect a rejection targeting the 4H MA50 again at 23200, which would represent a -1.25% decline, the weakest such Bearish Leg we had within the Channel Up.
-------------------------------------------------------------------------------
** Please LIKE 👍, FOLLOW ✅, SHARE 🙌 and COMMENT ✍ if you enjoy this idea! Also share your ideas and charts in the comments section below! This is best way to keep it relevant, support us, keep the content here free and allow the idea to reach as many people as possible. **
-------------------------------------------------------------------------------
Disclosure: I am part of Trade Nation's Influencer program and receive a monthly fee for using their TradingView charts in my analysis.
💸💸💸💸💸💸
👇 👇 👇 👇 👇 👇
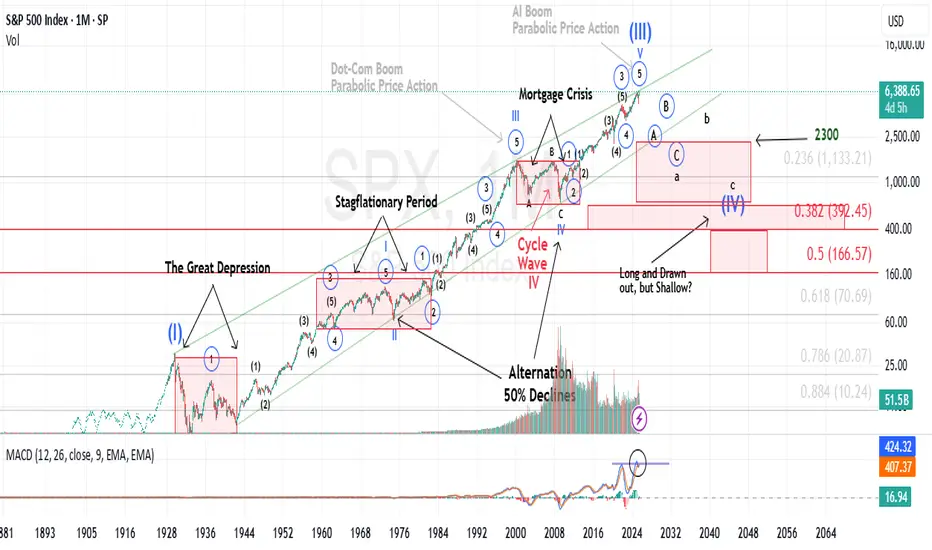
History does not repeat itself, however it tends to rhymeIt’s widely accepted that Mark Twain once said (or wrote) that “history does not repeat itself, however it tends to rhyme”.
Historical Parallels to a Super Cycle Wave (I) Top in U.S. Equities
The road to a major market top is often paved with echoing patterns from the past, and today's landscape bears an uncanny resemblance to pivotal historical events that preceded economic upheaval.
The 1918 Spanish Flu—though less economically damaging in the U.S. than elsewhere, still triggered a 1.5% drop in GDP and a 2.1% decline in consumer spending. The resulting economic weakness, paired with rising inflation, eroded real returns on equities and short-term government bonds for years.
Then came the 1929 stock market crash, the spark that ignited the Great Depression. Driven by a perfect storm of extreme speculation, sky-high valuations, and a regulatory vacuum, the collapse revealed the systemic fragility beneath the euphoria.
Adding fuel to the fire, the Smoot-Hawley Tariff Act of 1930 slammed the brakes on global trade. By sharply raising tariffs on imports, it invited swift retaliatory measures from abroad. The result: a devastating plunge in both U.S. exports and imports, deepening the economic crisis and worsening unemployment. Smoot-Hawley has since become a textbook example of how protectionist policy can magnify economic damage.
Modern Echoes: A Cycle Repeating?
Fast forward to the present and we see unsettling similarities.
The Covid-19 pandemic serves as a modern analog to the 1918 flu, disrupting global supply chains and triggering a steep drop in GDP and consumer spending. Unlike the post-WWI period, however, inflation didn’t precede the crisis, it exploded afterward, fueled by pent-up demand and fiscal stimulus, giving rise to persistent “sticky” inflation....and NOT TRANSITORY.
In a similar inversion of sequence, the Trump-era tariffs—modern-day echoes of Smoot-Hawley, were enacted before any major equity downturn, not after. Still, their long-term impact on global trade and supply chain reliability remains a pressure point for the economy.
Most critically, speculation and valuation excess are again center stage. Just as the roaring ’20s were characterized by euphoric risk-taking, today’s U.S. equity market is trading at record-high P/E ratios, despite rising macroeconomic uncertainty and deteriorating breadth.
These historical and contemporary markers suggest we may be approaching the apex of a Super Cycle Wave (III), a turning point that, like its predecessors, may only be fully recognized in hindsight.
It is my contention, that history is currently rhyming.
Best to all,
Chris
NDX (NASDAQ) CASH500 SHORT - Head and shoulders 30minRisk/reward = 3.2
Entry price = 23 275.7
Stop loss price = 23 303.9
Take profit level 1 (50%) = 23 193
Take profit level 2 (50%) = 23 157
Waiting on confirmation on a number of variables before entering the trade.
NASDAQ (CASH100) SHORT - double top H6Risk/reward = 4.3
Entry price = 23 282
Stop loss price = 23 398
Take profit level 1 (50%) = 22 871
Take profit level 2 (50%) = 22 663
If current H6 goes back into range, I will open short position.
All variables on checklist have been met.
I was out last night so I missed my initial entry. Hoping for a second chance.
Hopefully this short works because the last few higher time frame short setups have failed, although because of exit plan I have made very little losses.

NASDAQ (CASH100) SHORT - Head and shoulders H1Risk/reward = 3.8
Entry price = 23 167.9
Stop loss price = 23 232.8
Take profit level 1 (50%) = 22 943
Take profit level 2 (50%) = 22 878
Still waiting on confirmation on some variables in checklist

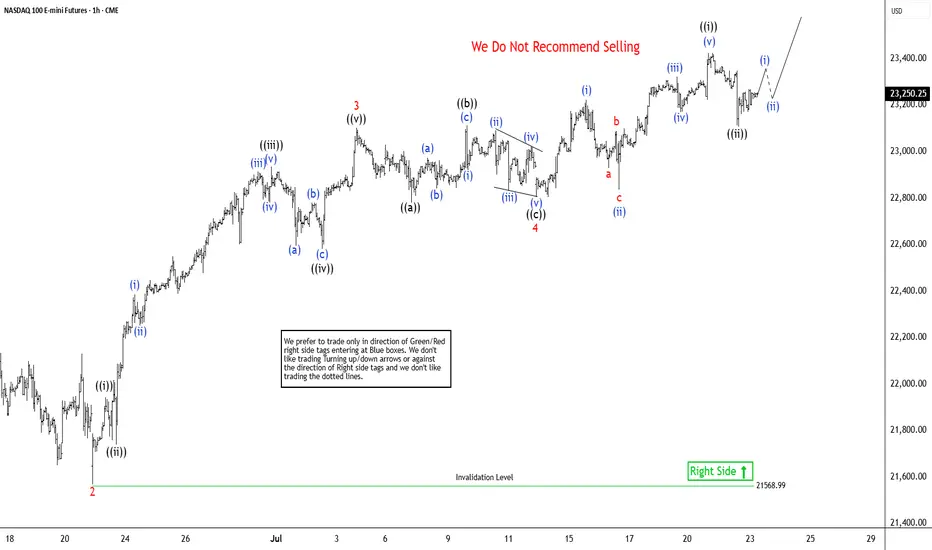
Elliott Wave View: Nasdaq Futures (NQ_F) Poised To Extend HigherThe Nasdaq Futures (NQ_F) favors higher in bullish impulse sequence from April-2025 low. It already broke above December-2024 high & expect short term pullback in 3, 7 or 11 swings to remain supported. Impulse sequence unfolds in 5, 9, 13, 17, 21….. swings count. It ended daily corrective pullback in double correction at 16460 low of 4.07.2025 low. On daily, it should extend into 28864 – 26152 area to finish April cycle before next pullback start. Above there, it favors rally in (3) of ((1)). It placed (1) of ((1)) at 21858.75 high, (2) at 21071.50 low as shallow connector & favoring upside in 5 of (3) against 7.13.2025 low. Every pullback after 4.21.2025 low was shallow & unfolded in 3, 7 or 11 swings calling for more upside as long as it stays above 5.30.2025 low. Within (3), it ended 1 at 22222 high, 2 at 21566.75 low, 3 at 23102.50 high, 4 at 22803 low & favors upsides in 5 of (3). Wave 4 as flat correction ended in 7.13.2025 low of 22803 low.
Below 3 of (3) high, it placed ((a)) at 22779.75 low, ((b)) at 23112 high & ((c)) at 22803 low as flat connector against 6.22.2025 low. Above there, it ended ((i)) at 23424.75 high as diagonal & ((ii)) at 23108 low in 3 swing pullbacks. Above there, it should continue rally in ((iii)) of 5, which will confirm above 23424.75 high to avoid double correction. Within ((i)), it placed (i) at 23222.75 high, (ii) at 22835.5 low, (iii) at 23320.75 high, (iv) at 23169.50 low & (v) at 23424.75 high. Currently, it favors upside in 5 of (3) into 23493.5 – 23934.5 area, above 7.13.2025 low before (4) pullback. Based on swing sequence, it already has enough number of swings in (3) to call the cycle completed. But as long as it stays above price trendline, passing through 2 & 4, it should continue upside into extreme area. We like to buy the next pullback in 3, 7 or 11 swings at extreme area for intraday rally. It favors upside in April-2025 cycle & expected to remain supported in (4) & later in ((2)) pullback as next buying opportunity.
NAS100 Bullish Setup: Clean Structure & Entry Zone Pending📊 NASDAQ 100 (NAS100) remains bullish, showing a clean, well-structured uptrend—higher highs and higher lows 🔼📈.
Price has now pulled back into my optimal entry zone 🎯. At this stage, I’m waiting for a bullish break in market structure before considering an entry 🟢🔓.
Patience is key—let the structure confirm first.
Not financial advice ❌💼

NASDAQ Rebounding on its 1H MA50.Nasdaq (NDX) rebounded today on its 1H MA50 (blue trend-line), third time since Friday's and Thursday's bounce. A Channel Up is emerging and based on the 4H RSI it is a medium-term bullish reversal off the Pivot trend-line, similar to June 20 - 30.
As you can see, that Channel Up targeted the 2.618 Fibonacci extension before breaking below the 1H MA50 to start a lengthy consolidation. Based on that, we are targeting 23650 (Fib 2.618 ext) on the short-term.
-------------------------------------------------------------------------------
** Please LIKE 👍, FOLLOW ✅, SHARE 🙌 and COMMENT ✍ if you enjoy this idea! Also share your ideas and charts in the comments section below! This is best way to keep it relevant, support us, keep the content here free and allow the idea to reach as many people as possible. **
-------------------------------------------------------------------------------
Disclosure: I am part of Trade Nation's Influencer program and receive a monthly fee for using their TradingView charts in my analysis.
💸💸💸💸💸💸
👇 👇 👇 👇 👇 👇

NASDAQ (CASH100) SHORT - Double TOP H4Risk/reward = 11.3
Entry price = 23 190
Stop loss price = 23 270.4
Take profit level 1 (50%) = 22 674
Take profit level 2 (50%) = 22 053
All variables met, and entered the trade.
What is everyone's thoughts on shorting or longing cash100?

NAS100 (CASH100) SHORT - head and shoulders 30minRisk/reward = 3.9
Entry price = 23 137.9
Stop loss price = 23 153.9
Take profit level 1 (50%) = 23 071
Take profit level 2 (50%) = 23 060
Still need to validate a few variables.
Lets goooooo
NAS100 (CASH100) SHORT - Double Top H8Risk/reward = 4.6
Entry price = 23 063
Stop loss price = 23 190
Take profit level 1 (50%) = 22 635
Take profit level 2 (50%) = 22 303
Still waiting for confirmation on some variables.
For example, need H8 candle to close in range and volume to validate, amongst other variables.
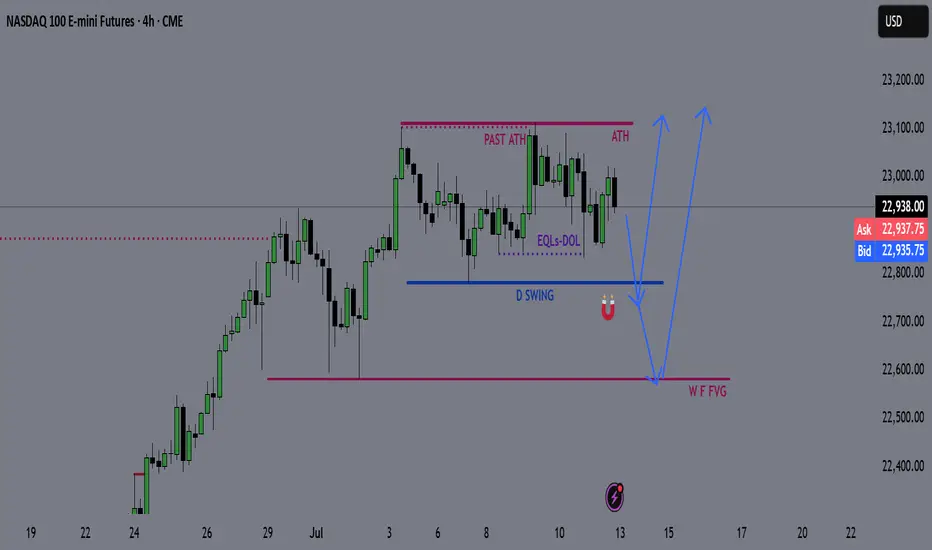
NQ Weekly Recap-Projection 13.07.2025NQ Weekly Recap + Outlook
1️⃣ Recap:
NQ made a new All-Time High, but the breakout ended up being a deviation. Price got rejected and started pulling back.
This signals potential weakness and suggests price may want to explore lower levels.
2️⃣ Bearish Scenario:
📍Target: Daily Swing low (Blue line)
📍Deeper target: Weekly Fair Value Gap (Purple zone)
I’ll look for LTF confirmations around these zones to position for potential longs.
3️⃣ Bullish Catalyst Watch:
There’s increasing speculation that Powell may resign this week.
If that happens, we could see:
✅ Strong bullish momentum
✅ Little to no retracement
✅ Immediate push into new ATHs
Weekly Plan Summary:
🔸 Scenario 1 - Pullback Continuation:
Look for reactive long setups at Daily Swing or W FFVG zone.
🔸 Scenario 2 - Powell Resignation:
Expect a breakout move with momentum — potentially no retrace.
Stay nimble. Trade what the chart confirms, not what the news promises.
NAS100 Forecast 24HAs of Tuesday, July 15, 2025, 2:03:11 AM UTC+4 the forecast for US100 (Nasdaq 100) in the next 24 hours presents a mixed outlook, with underlying bullish sentiment but caution due to ongoing market dynamics and potential for short-term pullbacks.
Factors Contributing to a Bullish Bias:
Underlying Strength and Breakout Behavior: Despite some short-term bearish technical signals, the Nasdaq is described as being in "breakout mode," decisively overriding key levels. This suggests underlying bullish momentum.
AI as a Growth Driver: Artificial intelligence (AI) remains a primary growth driver for the US economy and the technology sector, which heavily influences the Nasdaq 100. Confidence in secular tailwinds like cloud computing and semiconductor demand also persists .
Temporary US Dollar Weakness: The US Dollar Index (DXY) is currently in a retracement phase, pulling back after strength. A weaker dollar can provide a relief rally for risk assets like the Nasdaq, making US tech stocks more attractive to international investors.
Potential for Federal Reserve Rate Cuts: While no rate cuts are expected over the summer, a rate cut is considered likely in September. Historically, phases of moderate interest rate cuts in the absence of a recession have been positive for the US stock market.
"Buy on Dip" Mentality: Some analyses suggest that any short-term declines could be viewed as buying opportunities, indicating an underlying positive sentiment among investors.
Strong Earnings Expectations (for some tech): Despite general market concerns, some technology companies associated with AI innovation are expected to perform well, contributing positively to the index.
Factors Suggesting Caution and Potential for Bearish Movement/Volatility:
Escalating Trade Tensions (Trump's Tariffs): President Trump's continued aggressive protectionist stance and new tariff threats (e.g., against Canada) are a significant risk. These can create uncertainty, weigh on corporate profits, and lead to market volatility. This is frequently cited as the main risk for US indices.
Short-Term Technical Bearishness: Some technical analyses indicate a high chance of bearish candle closures across various timeframes (1H, 4H, Daily, Weekly, Monthly) , and some traders are eyeing selling opportunities from specific resistance zones (e.g., around 22,800-22,869).
Overvalued Growth Stocks: Following a recent rally, US stocks, particularly growth stocks, are trading at a premium to fair value. This can limit upside potential and make the market more susceptible to corrections if tariff negotiations falter or earnings guidance disappoints.
Market Seasonality: As we move into the latter half of July, market seasonality can shift from bullish to a more bearish stance.
Earnings Season and "Sell on the News" : While major financial institutions are kicking off Q2 earnings season, there's a potential for a "sell on the news" response, even if earnings aren't particularly bad, given the strong rally stocks have already staged.
Mixed Global Signals: European markets showing mixed performance and pressure from US futures suggest cautious global risk sentiment, which could cap upside for the Nasdaq.
Unfilled Stock Imbalances: Some technical analysis points to an unfilled stock imbalance around 22,300, which could act as a reaction point if the price pulls back.
Key Levels to Watch (Approximate):
Support: 22,600, 22,300 (unfilled imbalance), 21,611 (resistance-turned-support), 20,673 (Fibonacci extension and prior high).
Resistance: 22,800, 22,869, 23,000-23,100 (potential re-entry targets for rally continuation), 25,000-25,100 (approximate imbalance level to be filled).
In conclusion, for the next 24 hours, the US100 is likely to face a battle between underlying bullish momentum driven by AI and potential Fed policy, and the immediate headwinds of escalating trade tensions and some short-term technical bearishness. Traders should be prepared for volatility and quick shifts in sentiment based on news flow, particularly regarding trade and upcoming earnings reports.
For those interested in further developing their trading skills based on these types of analyses, consider exploring the mentoring program offered by Shunya Trade.
I welcome your feedback on this analysis, as it will inform and enhance my future work.
Regards,
Shunya Trade
⚠️ Disclaimer: This post is educational content and does not constitute investment advice, financial advice, or trading recommendations. The views expressed here are based on technical analysis and are shared solely for informational purposes. The stock market is subject to risks, including capital loss, and readers should exercise due diligence before investing. We do not take responsibility for decisions made based on this content. Consult a certified financial advisor for personalized guidance.
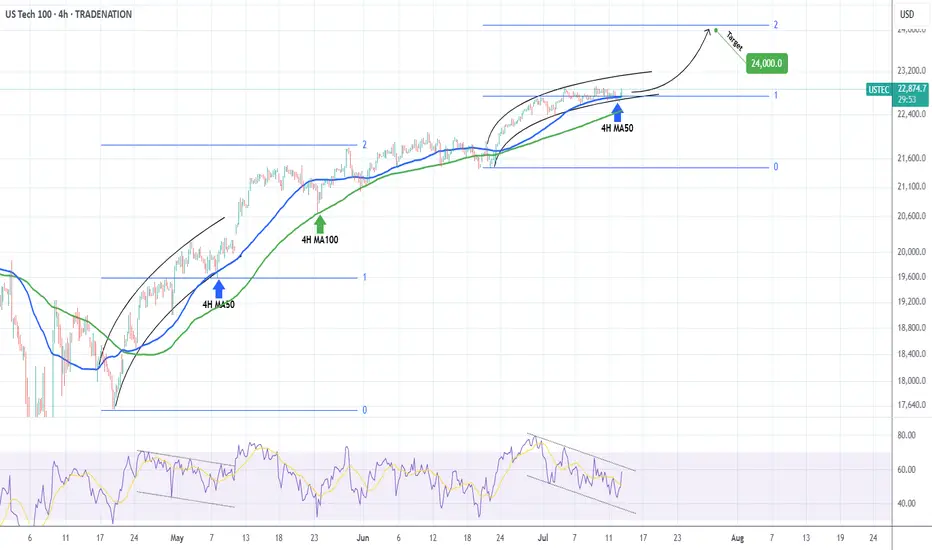
NASDAQ Is looking for a massive break-out to 24000!Nasdaq (NDX) is most likely taking advantage of the 4H MA50 (blue trend-line) as a Support and after hitting it, it appears that the price will look for a way above the Parabola.
This might be similar to what took place after the May 07 test of the 4H MA50. The price broke above that parabolic pattern and peaked on the 2.0 Fibonacci extension. As a result, we are looking for 24000 as a potential Target in the next 2 weeks.
-------------------------------------------------------------------------------
** Please LIKE 👍, FOLLOW ✅, SHARE 🙌 and COMMENT ✍ if you enjoy this idea! Also share your ideas and charts in the comments section below! This is best way to keep it relevant, support us, keep the content here free and allow the idea to reach as many people as possible. **
-------------------------------------------------------------------------------
Disclosure: I am part of Trade Nation's Influencer program and receive a monthly fee for using their TradingView charts in my analysis.
💸💸💸💸💸💸
👇 👇 👇 👇 👇 👇
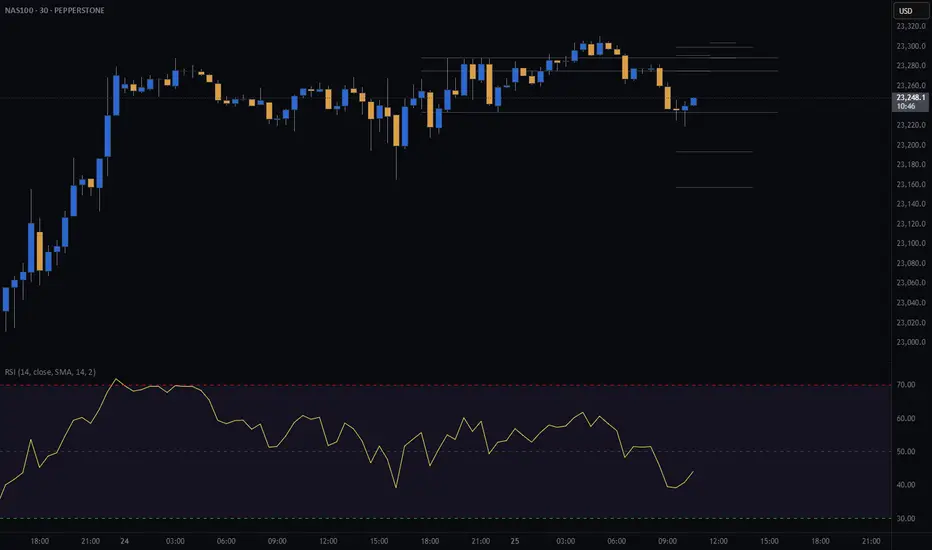
NAS100 Nasdaq Range-Bound: What Traders Should Watch Next US100I'm currently keeping a close eye on the Nasdaq 🧠📊, which is trading within a range-bound structure 📉📈. While we’re seeing some bullish momentum on the NAS100 4-hour chart today ⏱️📈, it’s nothing particularly strong or decisive just yet. I’m waiting for a clear break 🔓 either above or below this current range before considering any trading opportunities 🎯.
In this US100 chart 🖼️, I’ve highlighted key components such as price action, market structure, the prevailing trend, and other important elements of technical analysis 🧩📐.
⚠️ Please remember: this is a market analysis and reflects my personal opinion — not a trade recommendation. Always do your own due diligence 🕵️♂️ before making any trading decisions. This is not financial advice.

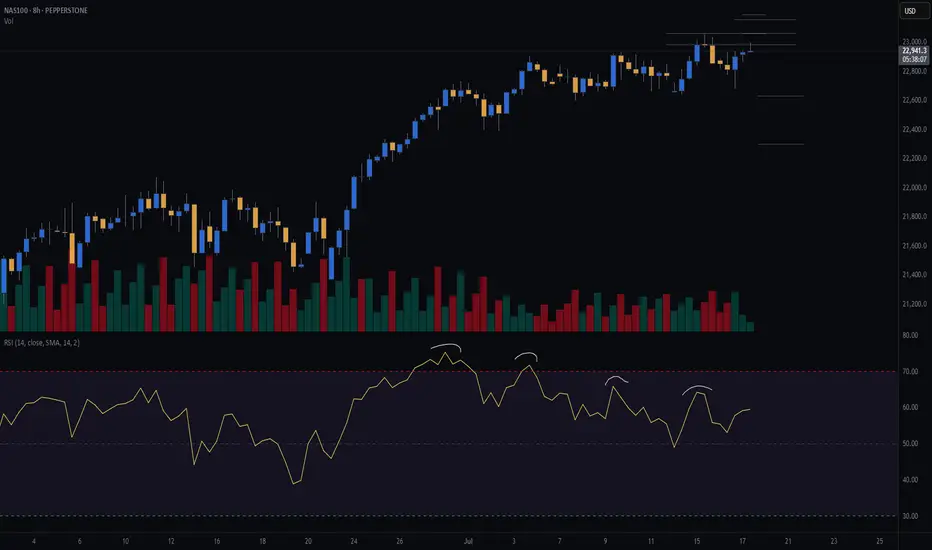
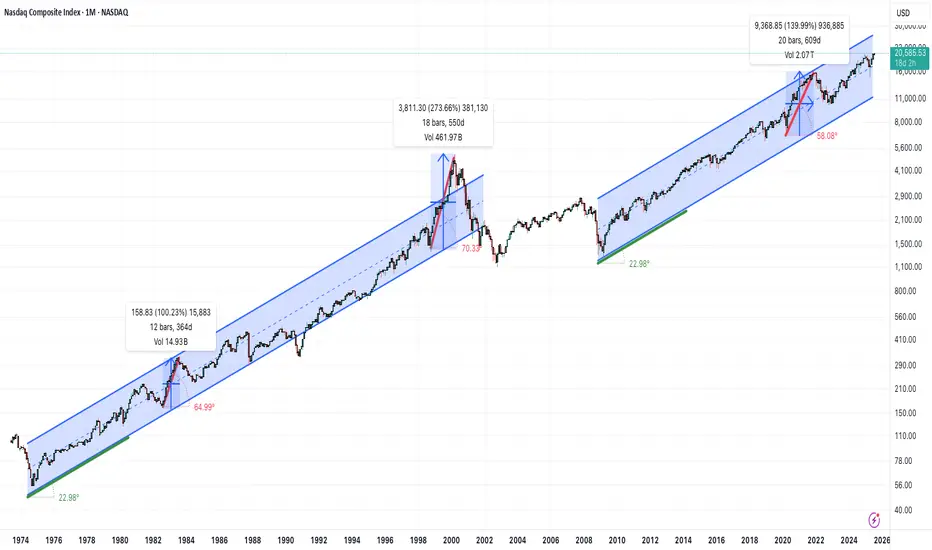
Is the Nasdaq in a bubble?On the monthly timeframe, there are no signs of an over-extended, parabolic condition for the Nasdaq Composite(IXIC).
It's interesting to note that for a 25 year period from 1974 to 1999 the overall trend was roughly a positive 23 degree angled climb. We see that again in the current 16 year trend that started in 2009.
Much steeper parabolic periods can be seen in shorter time frames like the 1998-2000 move, where the angle reached 70 degrees. That didn't end well. It's also worth noting that in 1982 and 2020 we saw similar behavior, though slightly less frothy. Both of those periods were also followed by significant retracements.
Maybe we are at the beginning of one of those multi-month, over-extended runs. But not seeing it today. If we are trading at 45,000 or more in 2026, that's a different story...
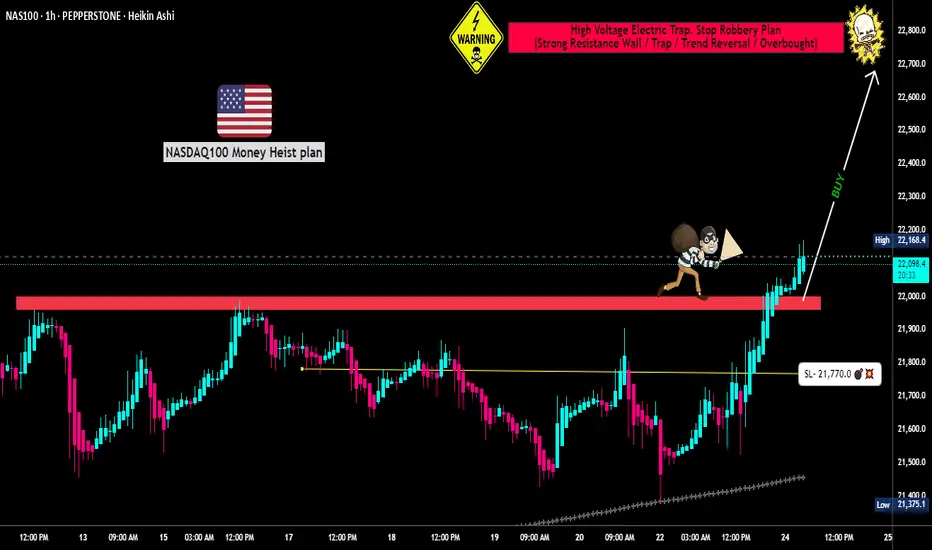
"NASDAQ 100: THE TECH ROBBERY! – Quick Profits Before Reversal?"🔥 "The NDX NASDAQ 100 INDEX Heist: Bullish Loot & Escape Before the Trap!" 🔥
🌟 Hi! Hola! Ola! Bonjour! Hallo! Marhaba! 🌟
Dear Money Makers & Market Robbers, 🤑💰💸✈️
Based on the 🔥Thief Trading Style🔥 (technical + fundamental analysis), here’s our master plan to heist the NDX - NASDAQ 100 INDEX. Follow the strategy on the chart—long entry is the play! Aim to escape near the high-risk RED Zone (overbought, consolidation, potential reversal). The bears are lurking, so take profits and treat yourself—you’ve earned it! 💪🏆🎉
🚀Entry (The Vault is Open!)
"Swipe the bullish loot at any price!"
For precision, place buy limit orders within 15-30min timeframe (recent swing lows/highs).
Set alerts! Don’t miss the heist.
🛑 Stop Loss (Safety Net)
Thief-style SL at nearest swing low (4H timeframe) → 21,770.00 (adjust based on risk/lot size).
🏴☠️ Target 🎯: 22,800.00
Bullish momentum is fueling this heist—ride the wave but exit before the trap!
📰 Fundamental Backing (Why This Heist Works)
Macroeconomic trends, COT data, geopolitics, and sentiment align for bullish moves.
Full analysis? Check 👉🔗🌎
⚠️ Trading Alerts (News & Risk Mgmt)
Avoid new trades during high-impact news (volatility = danger).
Use trailing stops to lock profits and dodge sudden reversals.
💥 Boost This Heist!
Hit 👍 (Boost Button) to strengthen our robbery squad!
More heists = More profits—stay tuned for the next steal! 🚀🤑
See you soon, fellow thieves! 🤝🎉
Nasdaq ready to dropwe can see the formation of a ressistance zone in daily, and as we explore the chart the best trade for todaty is a short.
targets are in green. entry zone in blue.
have fun
all details are explained in the video.
Elektra
