Nasdaq 100: Investors buying the dipAfter the biggest correction since March 2020, investors are buying the dip on the main indices. Nasdaq 100 is the best US index in terms of long-term performance and drawdown. We are in oversold territory in all the main indicators such as the RSI, MACD... We are not safe yet, and a bigger correction may occur. If we lose the support line of this week (13700), we will see another -15%. Care with volume during uncertain times with the Russian-Ukraine crisis and the upcoming interest rates hikes.
Ndxcrash

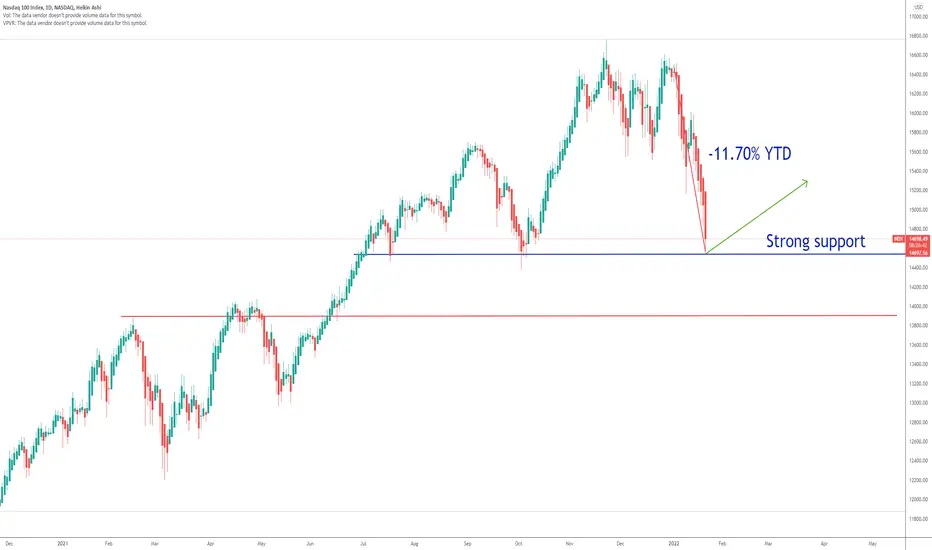
NDX Nasdaq100 -11.70% YTDAfter losing 11.70% from the beginning of the year, the Nasdaq 100 index has found a strong support from which i expect a bounce up.
Looking forward to read your opinion about it.
NDXWe hit my IH&S pattern but could not break up from the rising wedge. Instead we have broken down, I think we are heading to that weekly 50 ema at 13,500
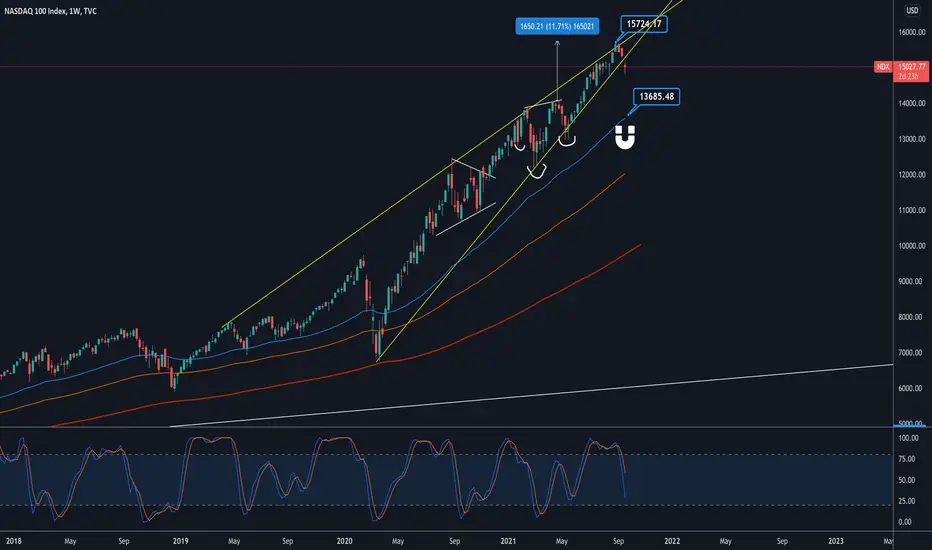
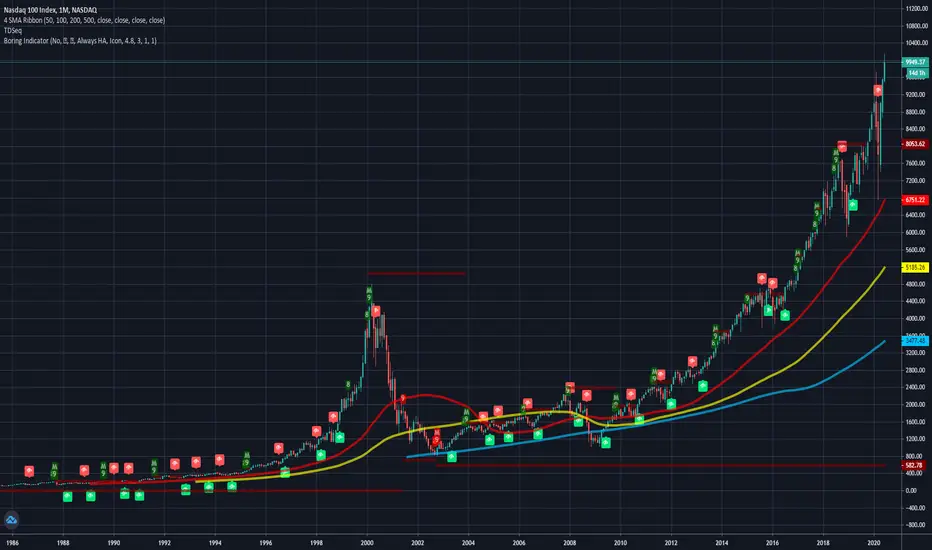
NASDAQ The Golden Age Cycles can be identified by a curved rise, then a large pullback back to the average, dipping below the average, reclaiming the average, then dipping below again, and then reclaiming, then the next cycle begins
Cycle 3 in progress
Jump on the train while its hot "roaring 20s"
Looking for the 11000% increase before the fall occurs
Purgatory possibility is there due to the presence of large Fib circles (price loves to crash vertically along these lines)
Regardless, Cycle 3 has begun! (price lifted off the mean)
The roaring 20's has been done before...

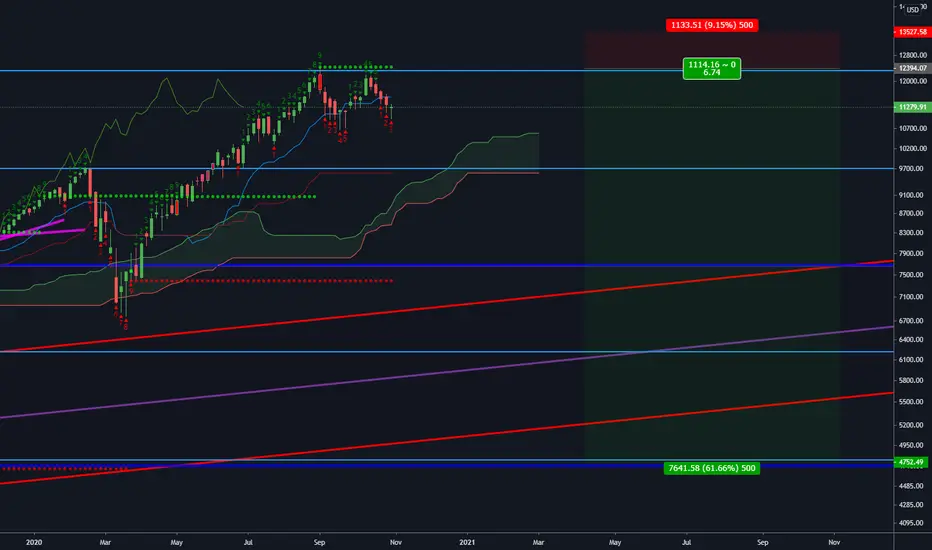
NDX:NAS100 Looking for Shorts if Monday's highs aren't breachedA longer / bigger time frame indicates a huge shorting opportunity, I've missed a couple of shorts but bought all the way up and knew there was upside still ahead, gamma squeeze anyone?
What do you think?
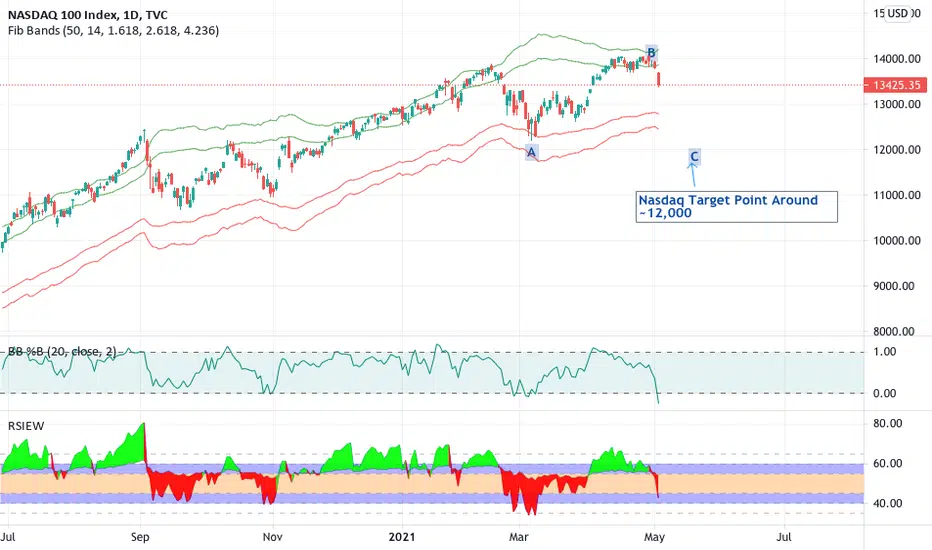
NASDAQ - Elliott Wave Correction Nasdaq en-route to Correction to 'C' wave around ~12K target point.
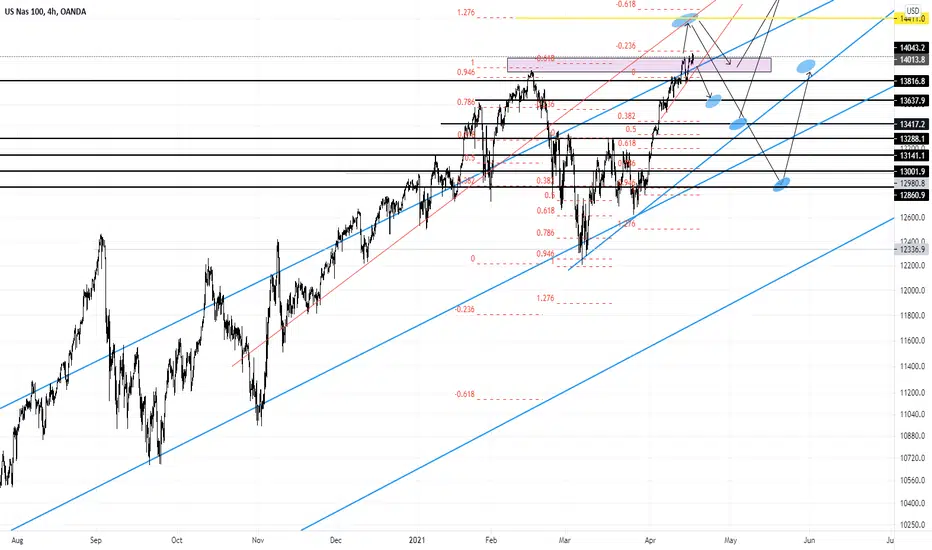
#Nasdaq - Be careful #NDX #NDX100The month of March and the first quarter of 2021 are coming to an end and there is a possibility of an April correction. Not in every market, but at least for the Nasdaq100, I can't argue it away at the moment.
The RSI has a double divergence and signals weakening momentum.
Therefore, in my opinion, we should wait for the end of the month and the end of the quarter before making further purchases. Not that someone gets angry because in 4 weeks there is a discount on the same Stocks of over 16 percent.
Therefore - be careful and watch out.
Greetings from Hanover
Stefan Bode

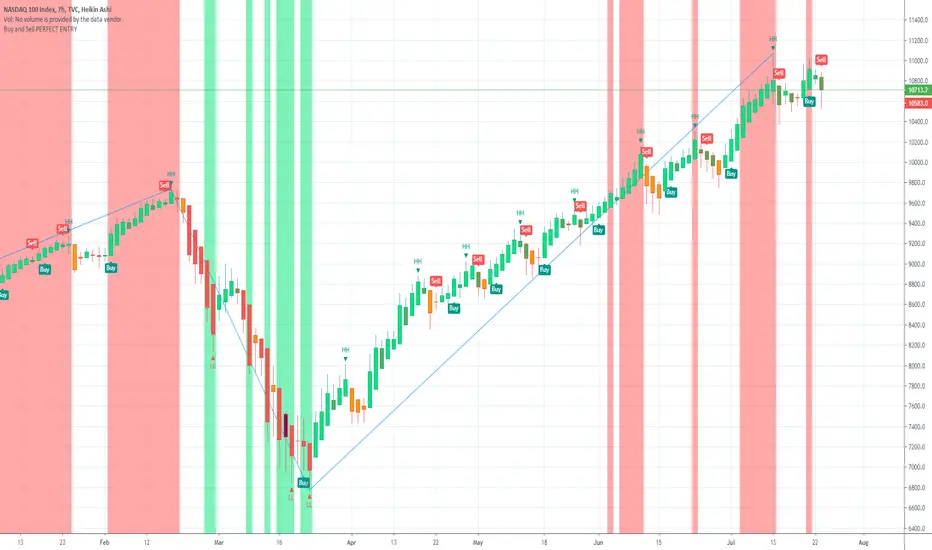
NDX Nasdaq100 Head and Shoulders PatternThis is a great example of how a Head and Shoulders pattern looks like!
$12100 is my first target!
If you are interested to test some amazing BUY and SELL INDICATORS which give the signal at the beginning of the candle, not at the end of it, just leave me a message.

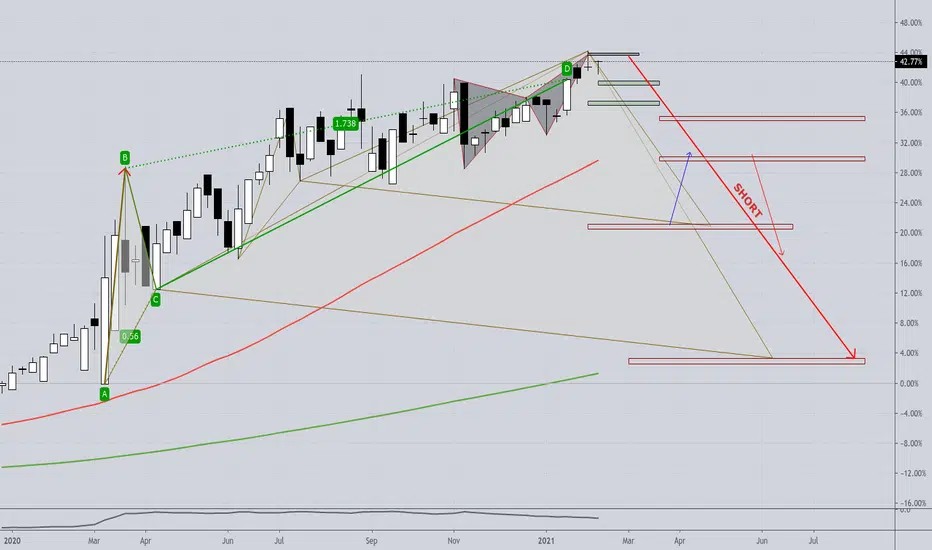
NDX/US30 - SHORT; SELL this extreme "rotation" in US equities!!Most likely a Crash.
Here is the Nasdaq100
from this post
Here is the DJIA
Dip Round Two Yup guys, it's soon there. Probobly a last squeese up to about 13.600-14.000 area.
Then get set for a new dip. Get ready :)

USA in Dangeras i said in my SPX post America is doing the worst job at managing the economy thanks to trump wanting to win on how " great the economy looks"
good luck trading
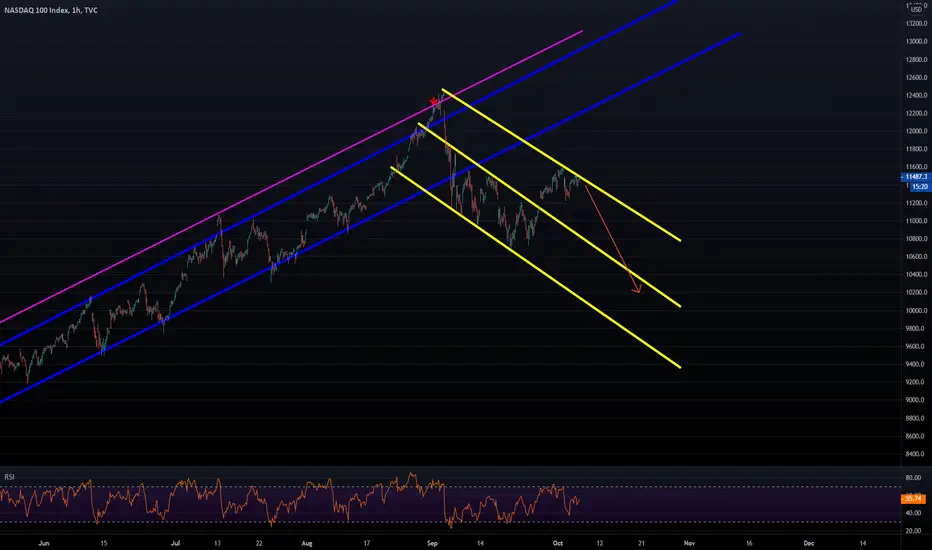
NDX - Downward channel setupHi guys, we've had a great run upwards since the double bottom at approximately ~10700 levels.
I've drawn some new lines that could show us the way forward. However, this idea is going downwards.
If the fiscal stimulus goes through congress and gets accepted, i believe this channel will be invalid.
However, if it fails the coming week, we will be ready for a new selloff.
Good luck with the trading the coming weeks!

US jobless claims increased 1.42 million in the last weekAbout 30 Million Workers Are Collecting Jobless Benefits.
The number of new claims for unemployment benefit jumped last month to 1.4m. That’s worse than expected and the first week-on-week rise for four months.
We can expect a reflection of today`s news in the overvalued stock market.
Sell-off accelerates also because of escalating US-China tensions and faltering economic recovery.
The indicators show a sell recommendation. We are also in an overbought area.
If you are interested to test some amazing buy and sell indicators, which give the signal at the beginning of the candle, not at the end of it, just leave me a message.
EXIT ALL STOCK MARKETSBefore the end of 2020 the mega crash of stock markets will be imminent.(If Tom Demark counts 9(max))
In 2000 bubble crash was 83%. This time MMA200 will be broken if the same percentage loss happens.
Jump on to limited assets: XAU, XAG, BTC
Further reading & watching:
www.cnbc.com
www.youtube.com
I'm calling the top of NASDAQ around 11337! This just lines up so damn perfectly, one more rally from where we are and that's it, MAYBE a throw over to fakeout but I don't think so, I think it will stop there and I'm going all in on shorts.

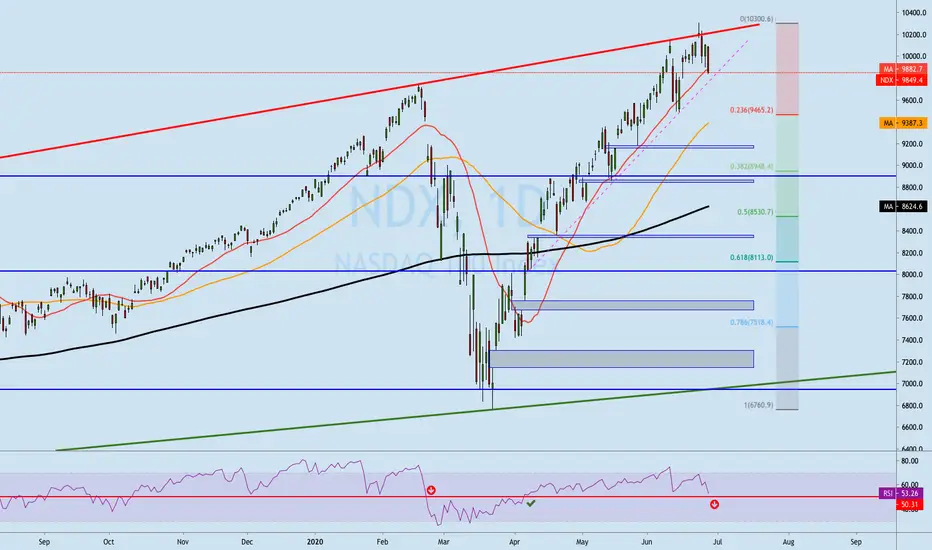
NASDAQ at the end of its bull run ? WATCH OUT FOR 9.730$Here is my thought, we might be seeing a trend reversal on the nasdaq, to be confirmed on monday by :
- An opening much lower than friday's close creating a weekly gap,
- The definite crossing of the MA20 (which has been struck on friday),
- Crossing of 1H MA200 and 4H MA50,
- Crossing of daily RSI 50 value,
- Breaking the dotted pink support line.
Next supports are
- 9500$ (Fib .236 + daily MA50)
- 8900$ (Fib .382)
- 8500$ (Fib .5 + daily MA200).
8.500$ is my objective for now.
Stop loss : 10.150$
Nasdaq 100 CFD (4H) / Two Bullish Counts Remember that SPX and VIX decide what NDX does. NDX will need the green light from those instruments.

NDX WeeklyPotential, "last" short opportunity i NDX,
- Gap closed
- Supply zone on weekly
- Resistance, trend channel

RFC : NDX bullish until Oct. 2020 ?Looking at NDX vs. inflation.
Looks like in a better shape than SPX (higher highs, higher lows) with - if it breaks current level - a continuation of the bull trend until end of September / beginning of October.
My interpretation of the chart is that a "double top" might be found at this point (0.5 fib from tech bubble in this chart, around 10.000/11.000 pts level on the NDX chart depending on printing), then retracing and starting a new trend.
Of course the future is not written yet.
Please share your thoughts since I am still beginner for both TA and FA.

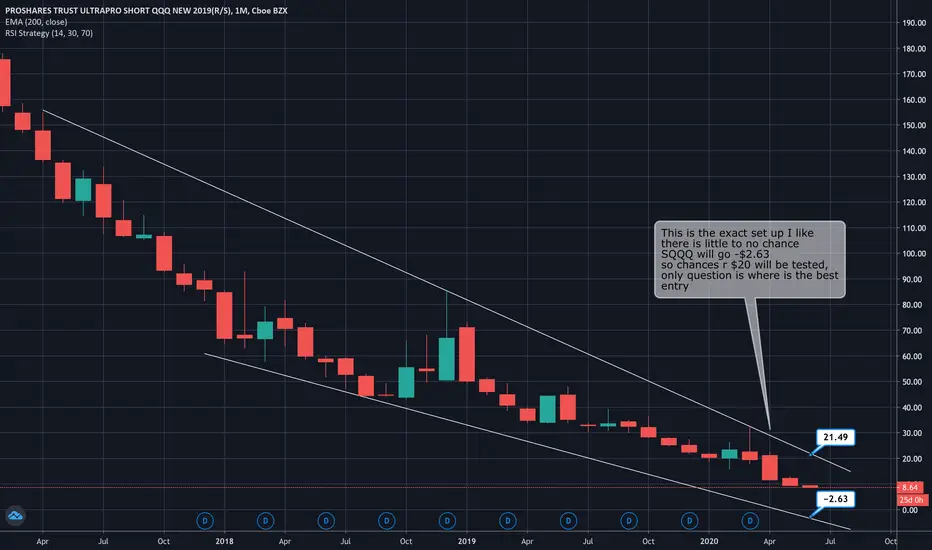
NDXstill in my NDX short via SQQQ . PA has fallen from the ascending triangle and now its only a matter of when IMO. I think once we reopen the economy in June then it will be time for the bulls to sell as all the online order hype will be ending and store's will start reopening.
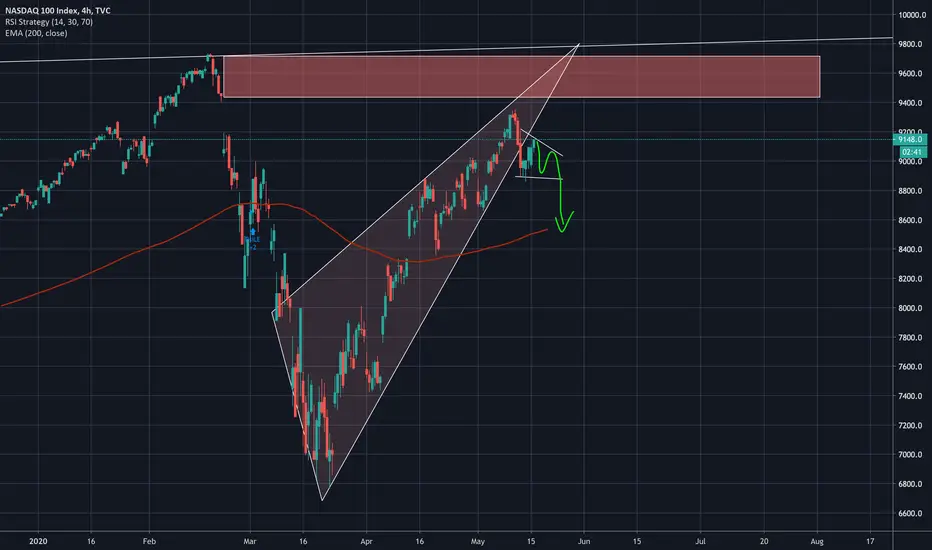
Nasdaq 100 CFD (4H) / Bullish Elliott Wave CountThe bullish count could be slammed if the S&P follows its red path. The relationship between NDX and SPX has been a bit strange since the bottom with NDX seemingly leading the SPX. In case of a systemic risk or market event, everything follows the VIX and SPX so beware.
