Closing NDX Shorts, Opening Small LongThis last decline has been beautiful, but time to get realistic. heavy shot profits I am taking off the table, nibbling at longs here with the deviation. Small size, tight stop. Not advice.
Ndxlong
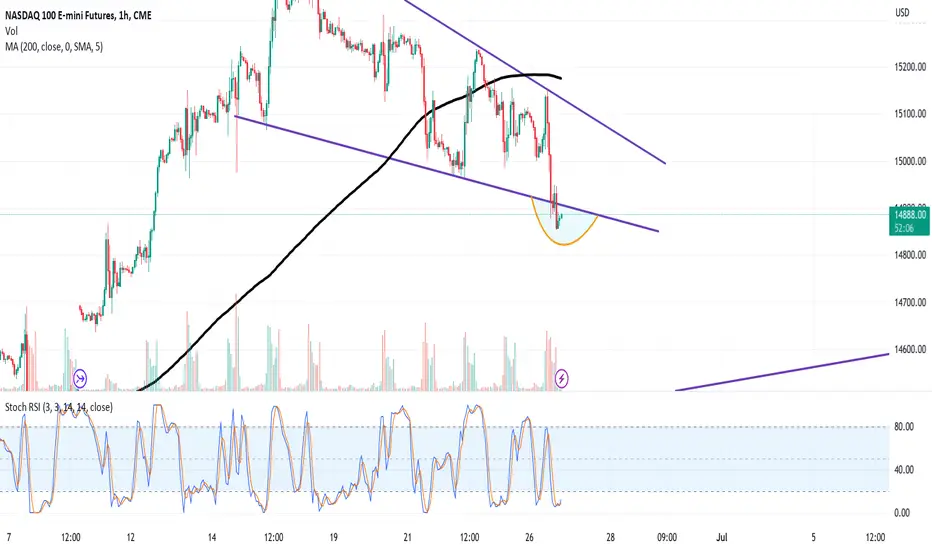
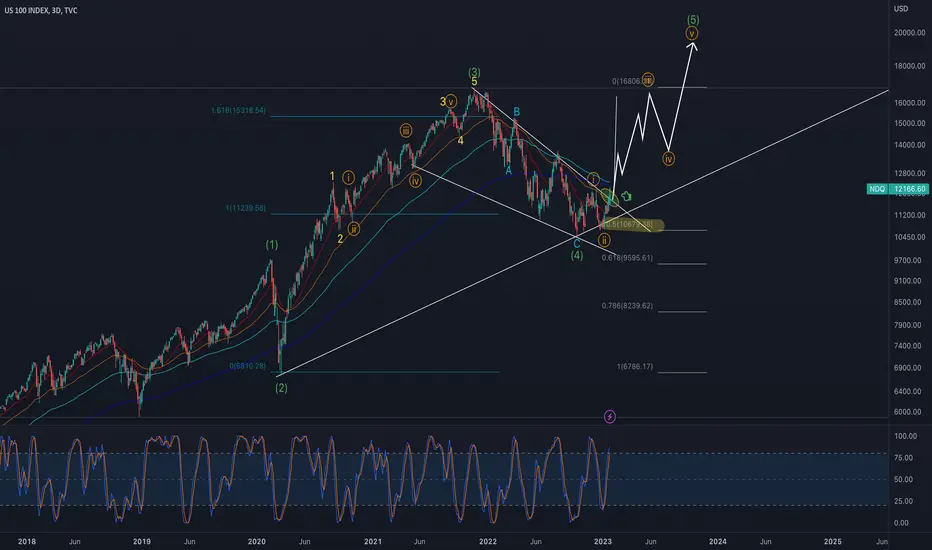
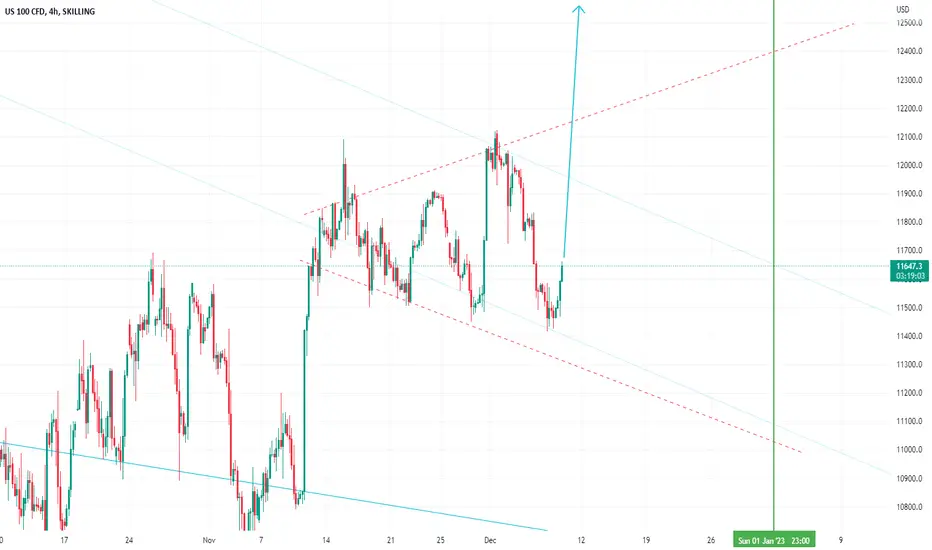
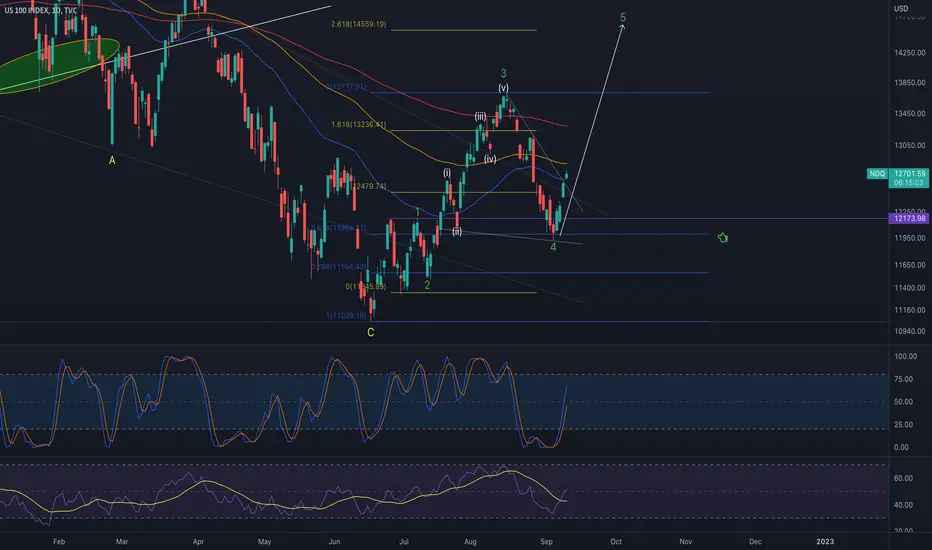
US 100Stoch RSI getting very overbought. But the diagonal is missing the 5th. I think we have a push above 14,000-14,300 in some mini parabolic pump move then roll over into either Wave b or wave 2

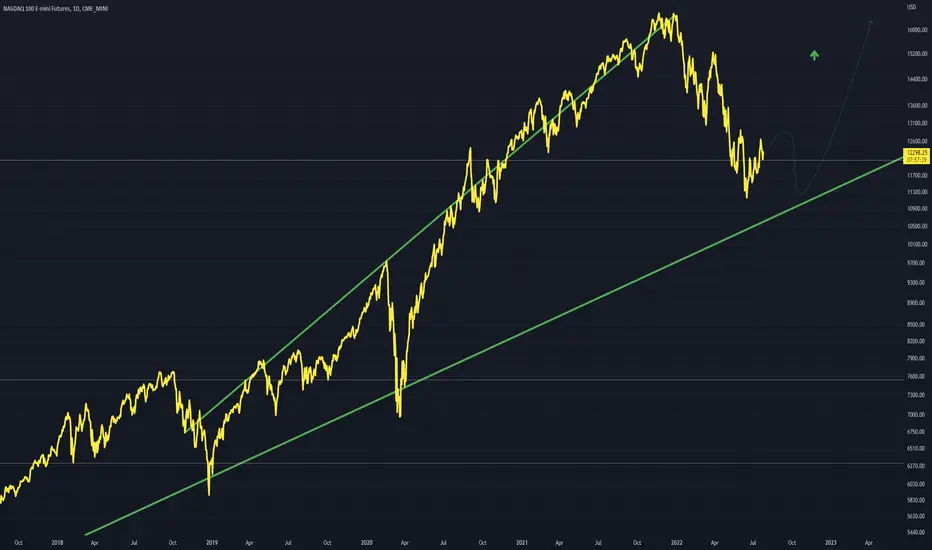
NDX are you rdy for long ?🧨🧨👌Nasdaq index, did you know that this index has an upward trend in the past two weeks? Well, interestingly, Bitcoin also has and I announced this in my analysis.
Well, how far the index should go up, you should be careful, I won't say here if it goes up.
Two more targets will not be seen, the first target is 15265.42, the index will go up to this price.
Our second target is 16607.19. I am giving you this information based on the method of dirty banks, so don't forget that this index is bullish to see these targets.

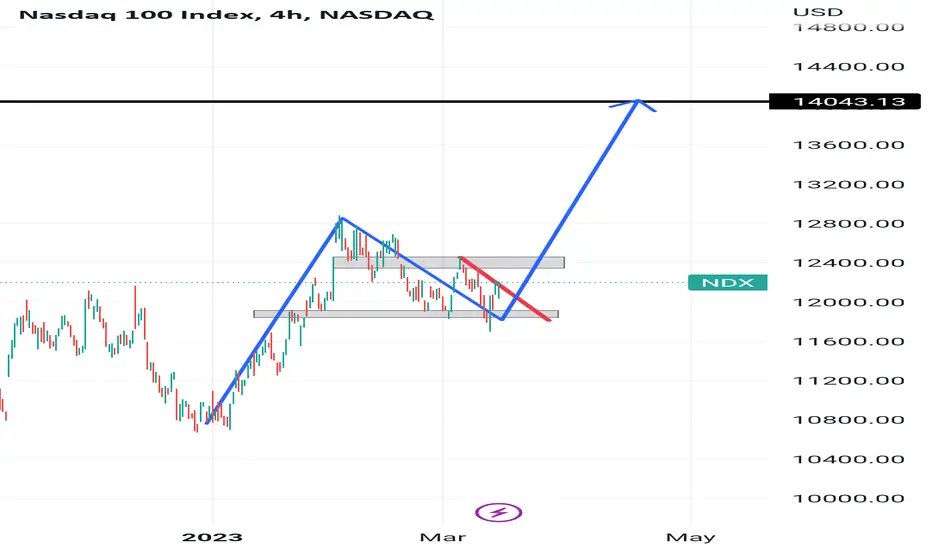
Potential bull flag on the Nasdaq 100 (NDX)The Nasdaq is holding above the February high and forming a potential bull flag pattern, which projects an approximate target around 13,500. A larger flag pattern also remains in play with a target just below 14,000, although the October high and monthly R1 around 13700 provide a likely resistance area. The daily trend is respecting the 10 and 20-day EMA's and the structure favours a break of last week's high.
- Bulls could seek bullish setups around current levels in anticipation of a break higher, or around the monthly pivot point should we see a deeper pullback and invalidation of the smaller flag.
- The bias remains bullish above the monthly pivot
- Targets include the resistance clusters around 13,500 and 14,000

Nasdaq Breakdown Analysis 05/04/2023Dear traders Nasdaq had moved up after that it start to pushing Down so you may be confused but when you see a strong candle moving to fast just wait to don’t have to execute on this so I expect Nasdaq if he breaks below 13045 and price close bearish you should start looking for sell and if he breaks above 13110 and candle was bulish you should start looking for buy good luck and trade safe !

IXIC - Realistic Target The strong trendline in white shows that IXIC is looking for another touch.
I see 10k as a strong psychological support and the spot for price to be tested.
Drawn a little dotted trend line to show downward movement.
To 10K !

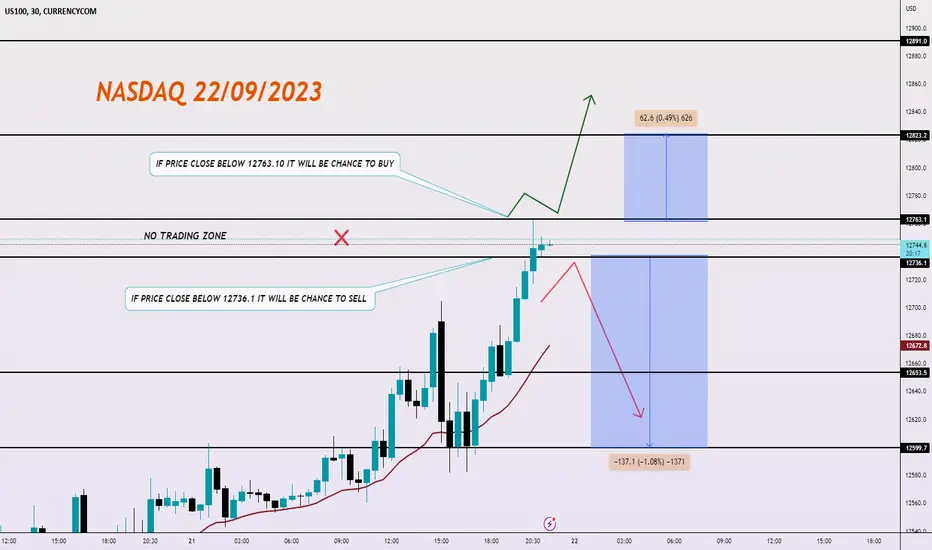
Breakdown analysis Nasdaq 22/03/2023Dear traders Nasdaq still in bullish trend he retest the wick of daily previous candle and it may rejected this area so as I said in my instructions we should look for sell under 12736 and we should look for buy above 12763 trade safe and good luck
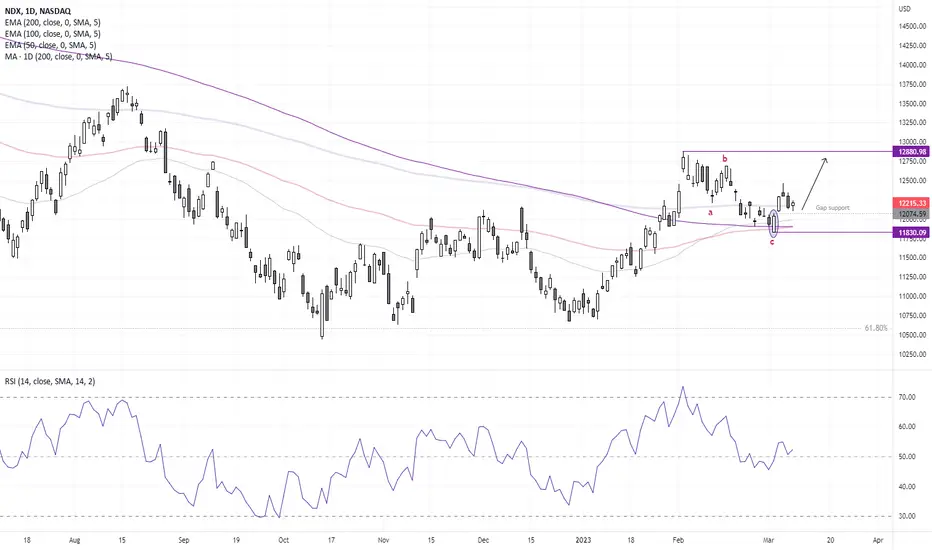
A bullish case for the Nasdaq 100The weekly timeframe has been slowly developing a bullish structure. The retracement from the all-time high stalled at a 61.8% Fibonacci ratio (from the pandemic low), and prices have since rallied to trade above the previous cycle high. OBV (on balance volume) is also confirming price action high. A recent pullback from the March high has stabilised above the 200-week MA and a small bullish candle formed last week.
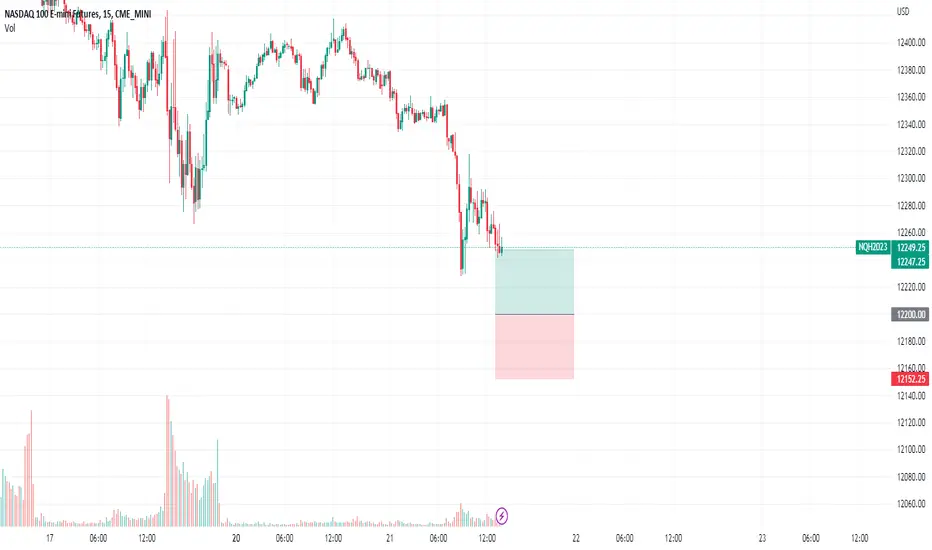
The daily chart shows an ABC correction which was completed with a bullish engulfing candle. Prices rose above the 20, 50, 100 and 200-EMA's and now pulled back to gap support. Given the Nasdaq has only fallen -0.6% this week despite the negative sentiment from potential Fed Hikes, it is holding up pretty well. SO if sentiment improves, the Nasdaq may go on to outperform its Wall Street peers.
- The remains bullish above the 11,830 low and for a retest of the 12,880 highs
- If prices can hold above gap support, bulls could consider tighter risk management
NQ1! Nasdaq Ustec 100 ndx buy Limit !According to my chart analysis , NQ1! Nasdaq Ustec 100 ndx buy limit ! Show strong signal to buy , buy max as you can .
NDQIf S/R flip 12,170-12,200 then we should head turbo back to ATH 16,800. Could be in the most hated melt up the stock market ever seen.
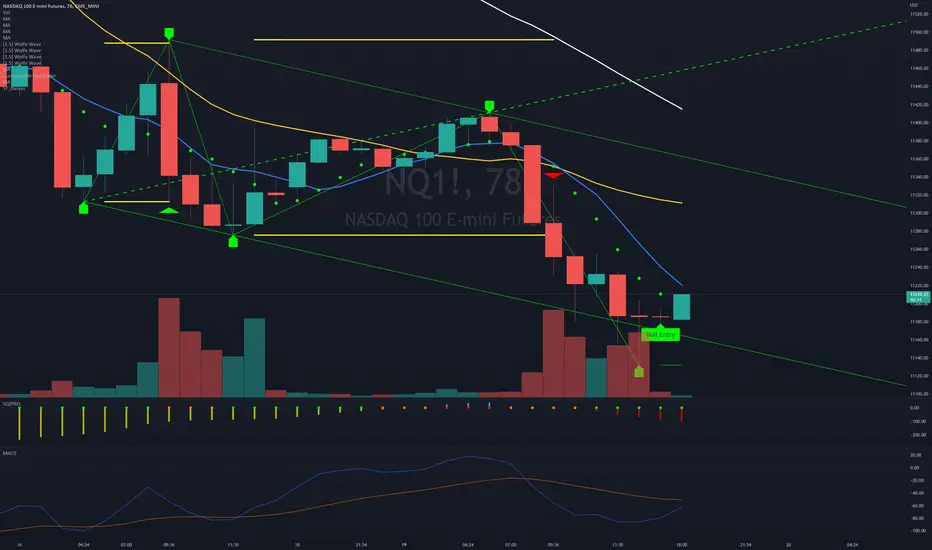
NQ short term bounce wolfe wave setup identifiedThere is a wolfe wave setup on the 78 min time frame. The projected target is calculated by extending a linear line between pivot 1 and 4 and projecting the line. This is represented as the green perforated line, as shown in the chart. The projected target is 11500 which coincides with the 6 day ma. The ETA is defined by identifying the apex of the wolfe wave and projecting a vertical line toward the green perforated projection line which is the line that extends from left to right.
Will the bulls return? NDX Strong trend line in green
I believe this is just a little bump in the road along a long bullrun for the Nasdaq
We are still along the trend line
Much higher we must go
Happy holidays friends

NDX Bull Idea - Third Touch Third touch along the lower trend line
Suggesting this third touch will act as a support point and led to another run higher than the previous high we have seen
Curved up channel drawn with the thick white line
Attaching another analysis further showing this bull theory
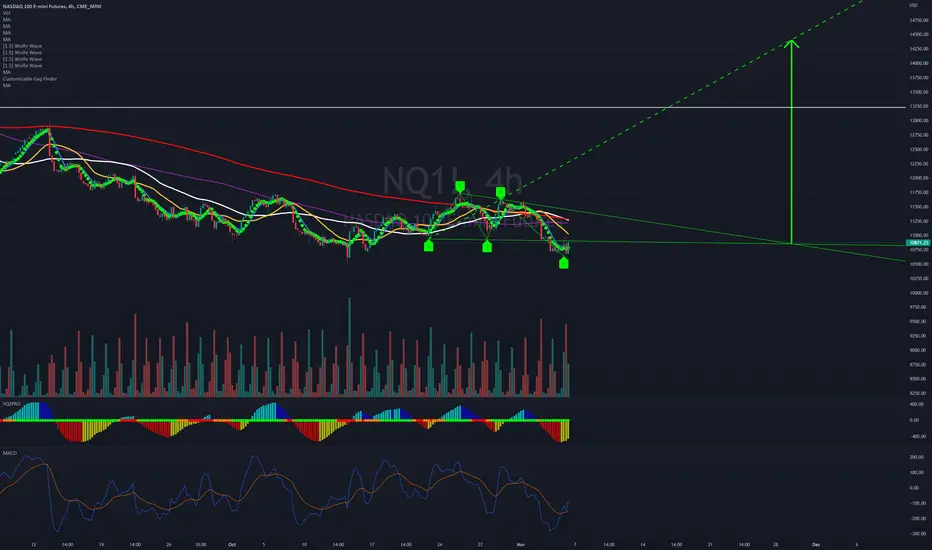
Bullish NASDAQ WOLFE WAVE SETUPThere is also a bullish wolfe wave setting up on the 4hr and 3D time-frames which all can be used for supporting evidence that a strong rally is nearing. The projected target is calculated by extending a linear line between pivot 1 and 4 and projecting the line. This is represented as the line perforated line, as shown in the chart. If we extend a vertical line from the apex to the perforated target line, the time and price meet on Nov 29, 2022 at 14400. This is a very aggressive time and price target; however, there is a gap open at $13225 and it will most likely fill this year, so I expect the midterm elections along with tax loss selling and christmas rally into january effect will all contribute to a strong rally. I hope the analysis serves you well and you remain on the right side of the market.
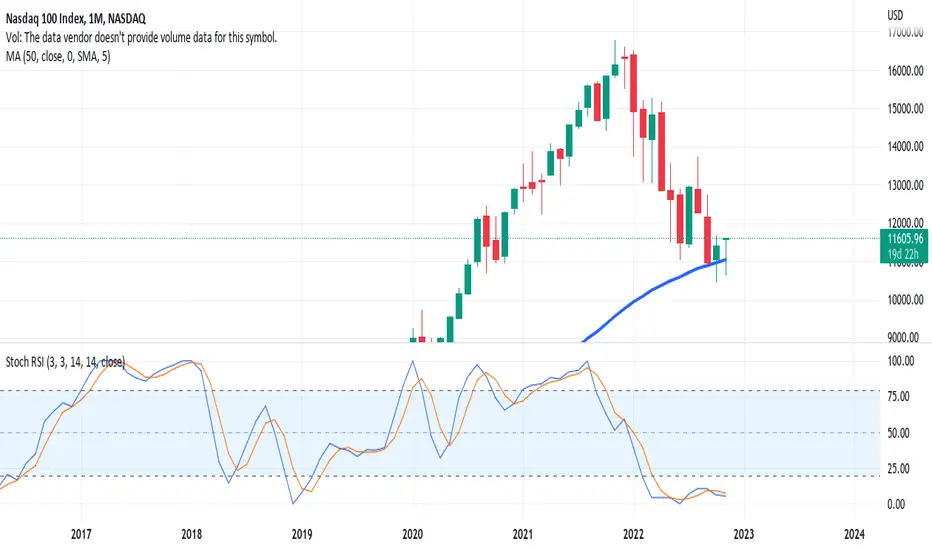
Bear Market Is Over - NDXCharts rarely get cleaner on a high-time frame. 50 day Monthly which has been a long term support is holding, beautiful monthly candle forming, maybe we get a doji. Stoch RSI scraping the bottom, only a matter of time before we trend higher. Not advise.
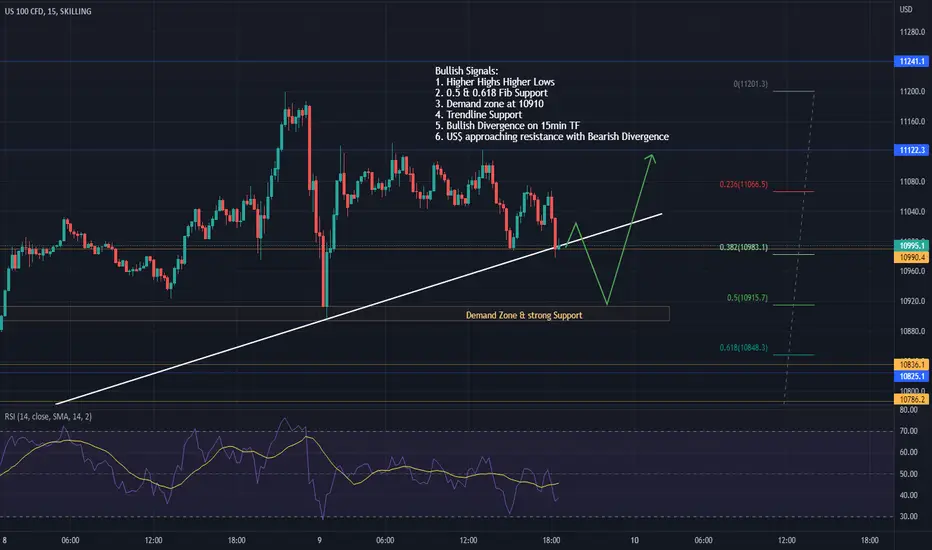
NASDAQ / US100 AnalysisNASDAQ is approaching the support level & demand zone with bullish divergence, & looks bullish for today.!!
Bullish Signals:
1. HH & HL - Bullish Trend
2. 0.5 & 0.618 Fib Support
3. Demand zone at 10910
4. Trendline Support
5. Bullish Divergence on 15min TF
6. US$ approaching resistance with Bearish Divergence
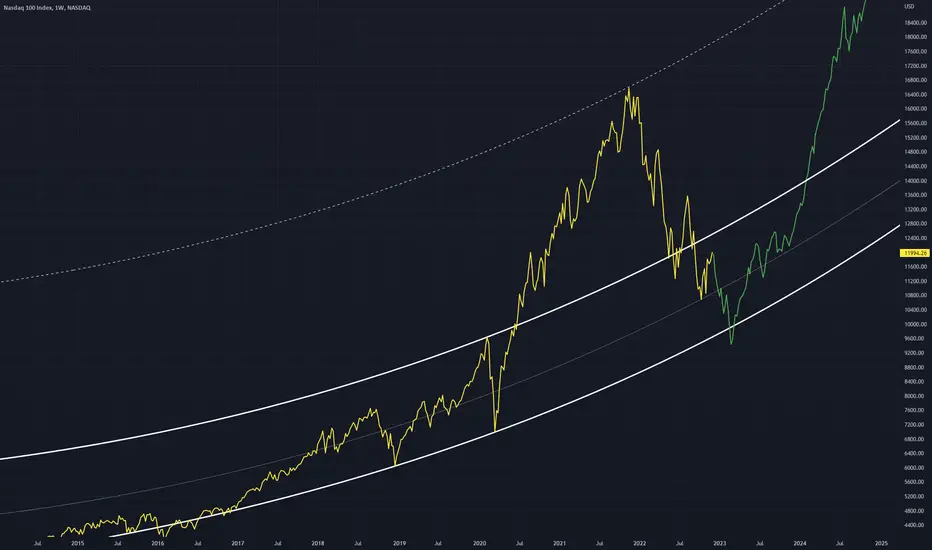
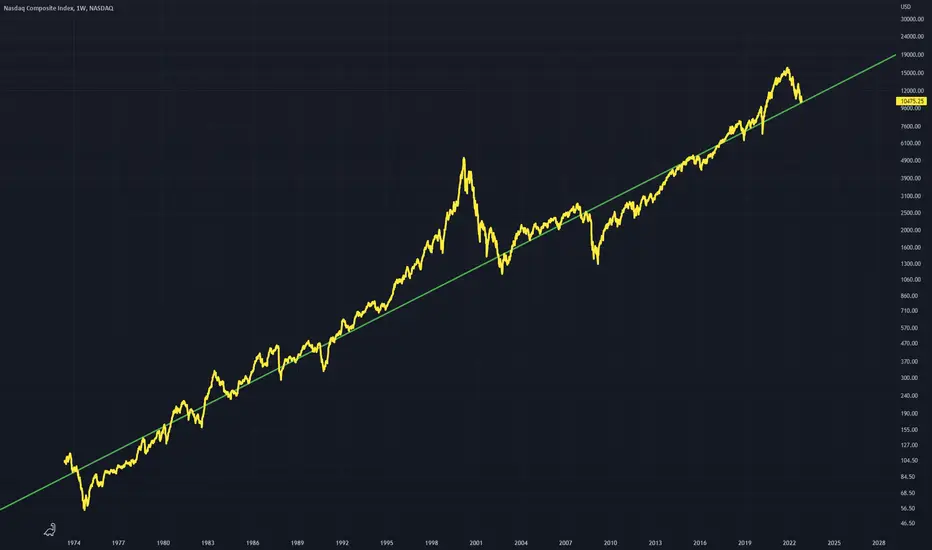
IXIC (NDX) Logarithmic Long Term Trend Line A long term trend line has been touched on the Nasdaq Composite
This has been seen as a point of great support extending all the way back to the 1980's
Price will likely bounce off this line and continue upwards
This is an addition to chart below, providing support
NASDAQ Bullish IdeaIn a bullish trend, US100 is about to test a support area before an anticipated bullish rally, so S&R areas are marked for entry & exit plans.

NDXWe have real momentum here on the NDX100. With the 3D sitting right on the 200 ema a break above that will likely confirm my count and send Tech sector (most likely crypto as well) up into higher targets on the HTF.

Nasdaq Daily OutlookBig Megaphone Structure
A double bottom is allowed to form within this structure
Once double bottom is formed continuation upward within the wedge is likely