NDX The Nasdaq reached a good correctional areas for buying, in addition to touching the bottom of the descending corrective channel.
Follow us for more ideas
Ndxlong

Nasdaq possibly could move up by 6-8% in coming days***CME_MINI:NQ1!
Nasdaq hit weekly support around 11100 $ . *** denotes the following conditions, following its completion, we can expect a rally back to 12100$. ..
- Completion of head and shoulders pattern.
- We also see positive RSI divergence on the charts along with tag of a weekly demand level, so the probabilities of short term reversal are high.
To enter this trade, I would wait for :
- Nasdaq to break out and confirm above our neckline trendline (green flag).
- SL is the breakdown of the neckline.

Has BTCUSD Already Told Us How Nasdaq Will Move? With similar double bottoms along the 200MA in both cases
A raging bull run in both cases (~580%) however BTC's rise was a lot more rapid.
As BTCUSD finishes its second top formation the NDX enters its second.
This could be interpreted as BTC being "ahead" of the Nasdaq.

Did NASDAQ potentially hit bottom?!NDX just hit and bounced off a major support level.
Over the last 18 years, as shown in the chart, this support level has proven to be a historical pivot point for the Nasdaq index. As per the attached chart image, every time the index hit this support level (150 MA on weekly candles), it has bounced off the moving average, and reversed into either short term or long term bullish trend. You can watch our full video explaining this by clicking on the link below.
In addition the Stochastic indicator is telling us that the NDX is oversold and overstretched, and is due for a rebound rally at minimum, or potential change to a bullish momentum.

NDX / BTC Comparison The Nasdaq can also be seen to possibly form the same current structure on BTC
Similar bottoms on NDX can be seen along the 200MA which correlate well with BTC's 200MA
Again with a Broadening Wedge formation
Heres my prior post comparing S&P and BTC
Another view for the Nasdaq with a more bearish side

NDX Collapse ScenarioUsing Fib circles to plot how price falls
Both corrections are around -80%
A fall like this allows for a third touch on the up channel that is apparent
Bars pattern placed (red) is just my thoughts of how price could act if this scenario occurs

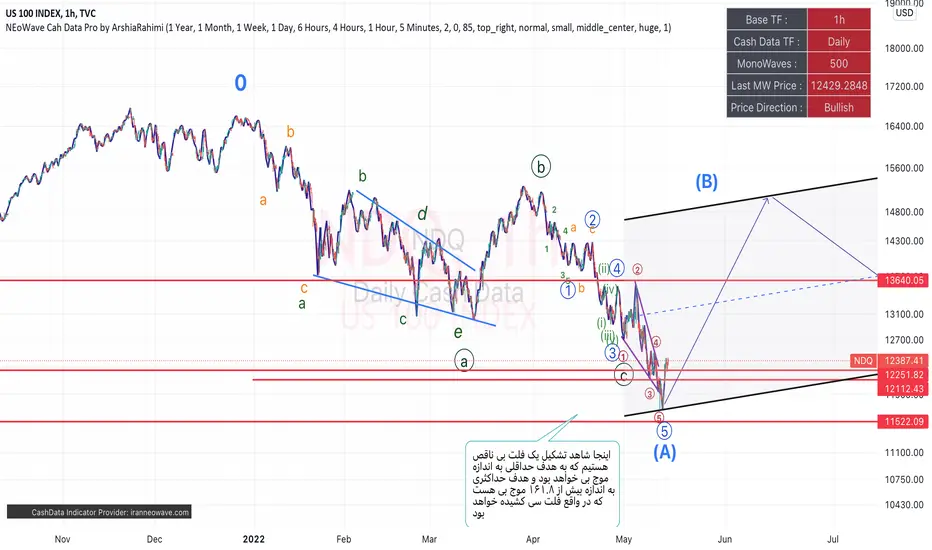
Crash is over !flat pattern is over on Friday and now it gonna make B branch triangle , After completing this branch, it will be clear exactly what kind of 18 types of triangles we are in and we can see where the exact target is.
But we can say that in the next 3 months we will be around the previous ceiling
USD 100 INDEXIs usd index going up??
Judging by what I see,it looks like usd index is gaining some momentum,just not sure but a long is what I see coming forth. Leave your comment or analysis in the comments below😊

Mean reversion Nasdaq LongIt hit the 618 of an important retracement. Whats better is it hit it when going down on monday, which is a day where panic is usually best taken advantage of.
stop: 12162

NASDAQ 100: We Have Found the Bottom!NASDAQ 100 has been in a downtrend for the last couple of weeks. This has caused a lot of stock to retrace.
As of now we are at the bottom of the Ichimoku Cloud on the Weekly chart. We have perfectly formed a bottom on the Ichimoku Cloud and respscted it as support for three weeks. This level is what is holding up the NASDAQ 100. We have also formed a resistance confirmed by the EMA Ribbons. I am currently looking out for a daily close above 14080 to confirm any bullish price action. As long as we are under 14080 the NASDAQ has a tendency of breaking below the major support of the Ichimoku Cloud. This scenario is highly unlikely due to the fact that we have a red 9 on the TD-Sequential which indicates that we are at or near the bottom. We also have a bullish divergence on the CM_Ult_RSI which is a good signal of reversal.
Look for a breakout of the 1st EMA Ribbon (14370) and a short term rejection of the second EMA Ribbon (14750). If the 1st EMA Ribbon gets mounted as support the NASDAQ will be looking extremely bullish.
*WARNING* This thread is not financial advice. I am not a financial advisor.
Thank you for reading.

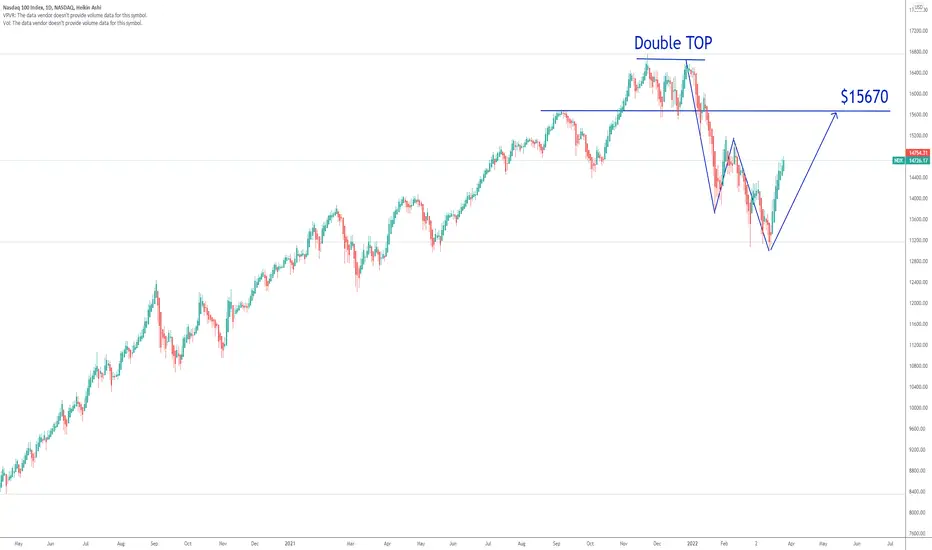
Nasdaq 100 closer to a double bottomIf you haven`t seen my last post about NDX:
Then you should know that Nasdaq 100 is closer to a double bottom chart pattern, with an upside potential reversal to $15670 this year.
Looking forward to read your opinion about it.

NDX Nasdaq double bottom ?NDX Nasdaq100 is looking bearish for now.
I think we might see a double bottom before closing higher this year.
Looking forward to read your opinion about it.

NDX W-Shaped RecoveryI think we might see the end of the war soon.
Russia says the first phase of its “military operation” in Ukraine is mostly complete.
I am considering a W-Shaped Recovery on NDX and a price target of $15670.
Looking forward to read your opinion about it.
NASDAQRecounted NDQ and find it hard to imagine we fo not at least test the weekly ema 100, with the fact that yeilds are still heading to 2.1% USD is heading to $98-$99 & TA patterns show a failed bottom ST TL.. So probably we have a bearish Feb to start and bottom around 13,000
bullish nasdaqas you see we have channel & fork .
in place Where I marked with arrow the market reacted with doji (bull sign)
in midline of channel we have a level (blue rectangle ) in this point save profit .
p.s : We may not have pullback to level
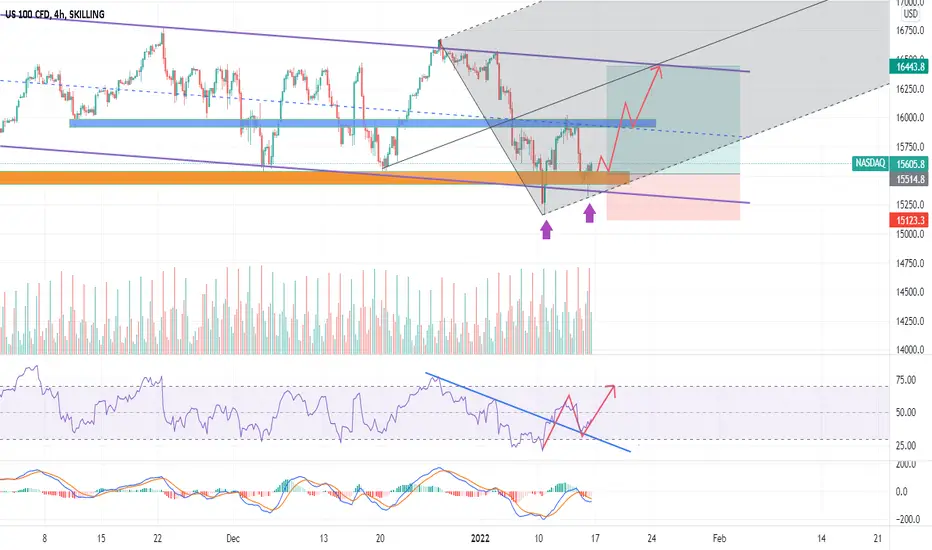
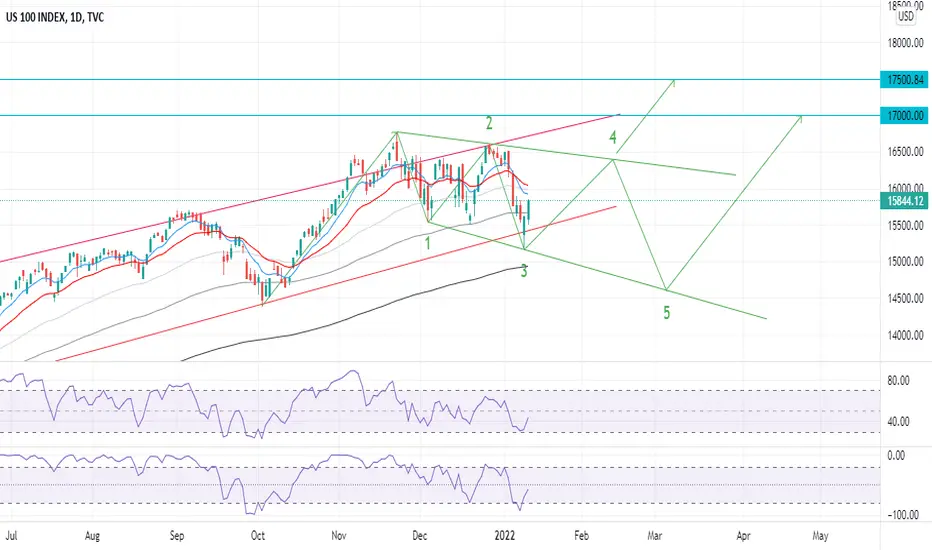
17500 on The CardsThe bottom trendline of the major weekly channel held with the most recent push to the downside. This indicates the presence of institutional demand and the chances of new all time highs is good. There is also the formation of a bullish corrective structure as indicated by the green flag. This does not mean that there is no longer downside risk and I will be keeping a close eye on the low of the recent daily spike. A close below that may indicate a more significant correction.
I am currently long and remain bullish but will be watching the resistance of the structure. The upside target will depend on if and whether the flag breaks after 3 or 5 downward moves.
Happy trading!
Linton
Nasdaq 100 Potential Buy Zones1st buy zone at about 15250 (S/R and 61.8 Fibonacci)
2nd buy zone at about 14900 (S/R and 78.6 Fibonacci)

NDQTech sec looks good and bottomed, crypto as well looking bottomed. Think we are fully reloaded for 17k NDQ. Yeet

NDX Nasdaq 100 Santa Rally?The Santa Rally is set to start on Monday, Dec. 27.
This period gave positive return for the S&P 500 78.9% of the time.
Since 1950, the average return of the Santa rally was 1.33%.
How do you think this will be reflected in the Nasdaq 100 index?
The reasons could be optimism over the new year ahead or holiday spending.

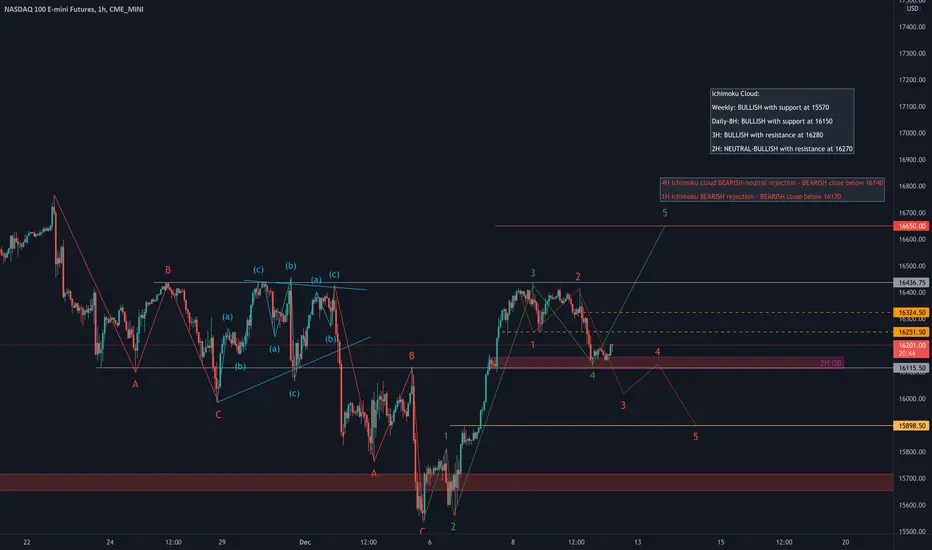
NASDAQ Futures Trend Analysis - EWBreaking down the Ichimoku cloud & Elliott Waves for the current PA.
Seeing confluent support in this region, though R/R is better on the put (short) side.
On the road to the next psychological level!Hello Everyone!
Small trade on NDX!
Small retracement and looking for a buy to the next psychological level (16k).
''That's it? '' ... That's it!
Enjoy !

NAS100 Further upside expected.We are expecting further upside after a continuation in wave {v} followed by a triangle.
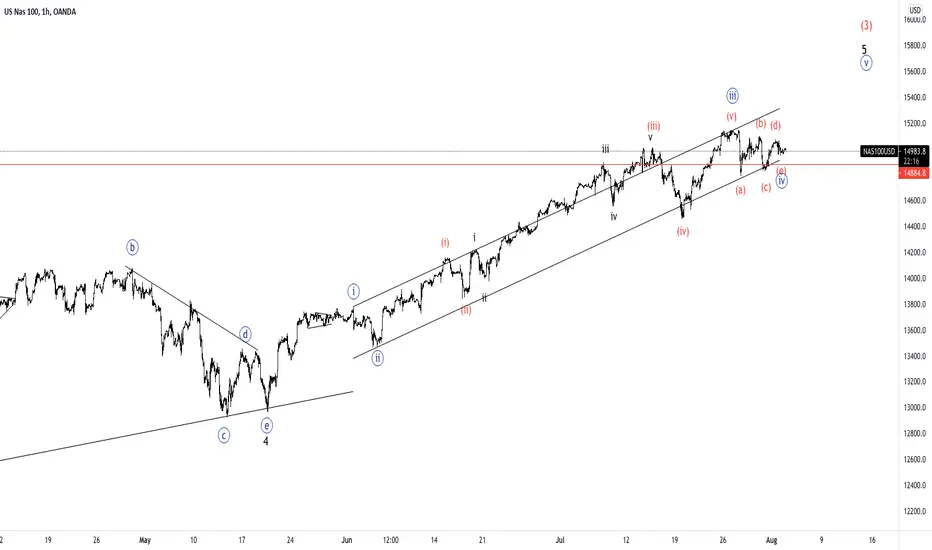
NDX
15300 is the target, now is into target zone between 14800 - 15300, so be careful like always, meanwhile bullish!
