NEAR USDT Idea [More Details in Description]On a daily timeFrame, 50ema held strong as support since mid-December so if the price close below that we can expect a drop in price
also, the 5.58 level that was ath in past, now acting as resistance if daily candle close above it can back to previous ath and even higher like what I show in the possible targets
-----------------
Looking for Buy setup after this breakout confirmed otherwise it can go lower in this Trend
NEAR
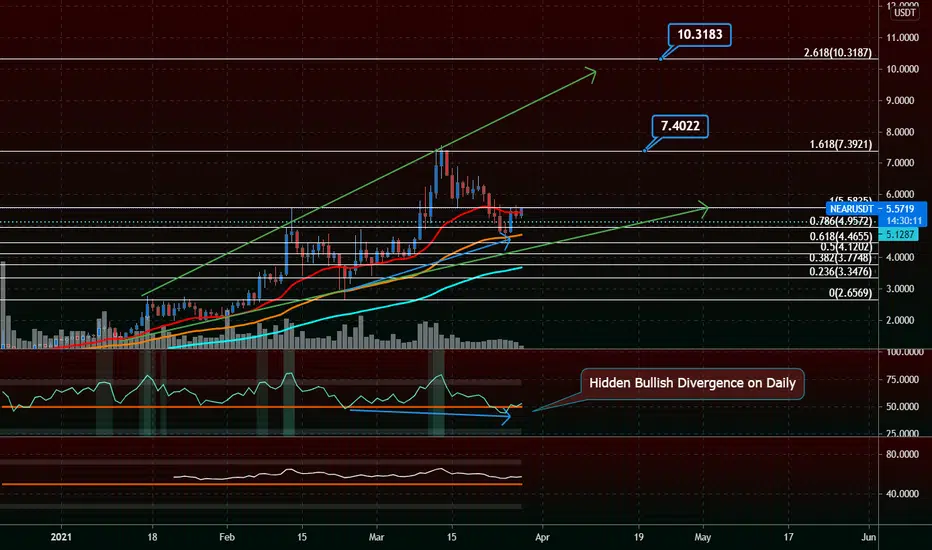
NEARUSD: INVERSE H&S PATTERNAwaiting for NEAR's Inverse H&S Pattern to potentially form. If 4H or 1D candle break above the blue line, our next target is likely to teach 9.8.
Pay attention and put this in your watchlist as this has a potential to grow 32-33% from here.
--
Trade wisely folks.

NearNear looks to be making it's next leg up also, already on a great uptrend and printing very bullish market structure here, I am an ICO holder so not adding to position just holding and watching here. They have also released "The Rainbow Bridge' which can now bridge ERC20 tokens to near blockchain and back to Ethereum which is extremely bullish.
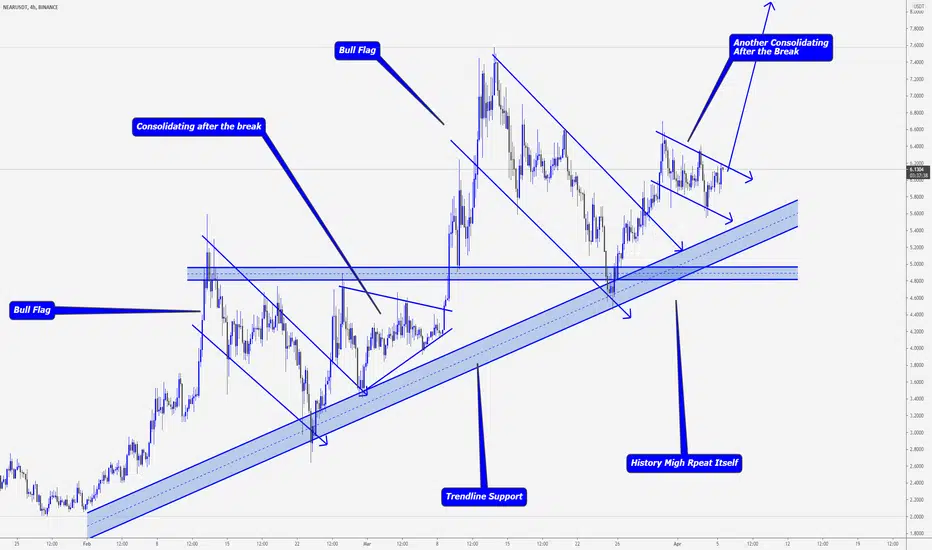
NEARUSDT > History Can Repeats Itself !!I hope you are feeling generous and loving today to give me a like and leave a comment it will really support the creation of new free ideas for you.
Analysis up on #NEARUSDT
Hello friends.
here I share with you another one of my investments, which I really like and also in from well below, but I saw something interesting and i thought I share it with everyone.
Look how the chart I just repeating itself, each market has it is unique followers and traders that have a certain behavior especially when it comes to cryptocurrencies.
Look left and see how we had a bull flag then breakout consolidating for a while and boom 100% move, can it happen again?
well my answer is yes, but hey I only invested 2% of my crypto portfolio in this market and I can be patient with it, so please please make your decisions upon your circumstances.
Safe trading everyone
Check today analysis below⠀
>> you must know what is your risk before you get in a trade, many traders will only look at how much they will get
_____________________________________________________________________________⠀
-Disclaimer: This information is not a recommendation to BUY or SELL. It is to be used for educational purposes only⠀
-Please note this is just a PREDICTION and I have no reason to act on it and neither should you
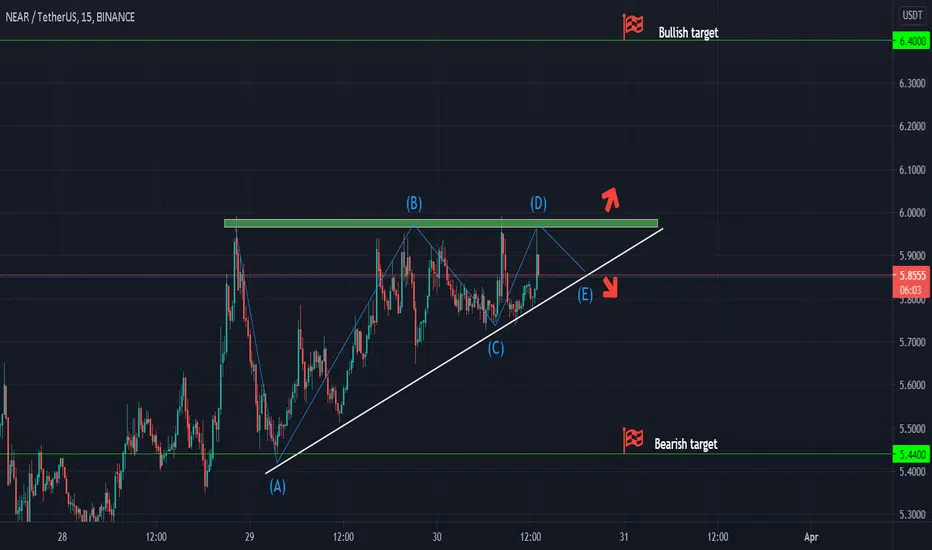
Great triangle⚖️Get ready, wolves🔥
There is an Ascending triangle pattern formation on NEARUSDT.
Previous bearish trend was broken and now the price started to rise.
According to Elliott Waves theory Wave D is done and now the price is heading to Wave E.
Follow the chart and look for the breakout carefully.
_____________________________________________________
If you enjoy my FREE Technical Analysis , support the idea with a big LIKE👍 and don't forget to SUBSCRIBE my channel, you won't miss anything!
Feel free to leave comments✉️
And always remember: "we don't predict, we react".
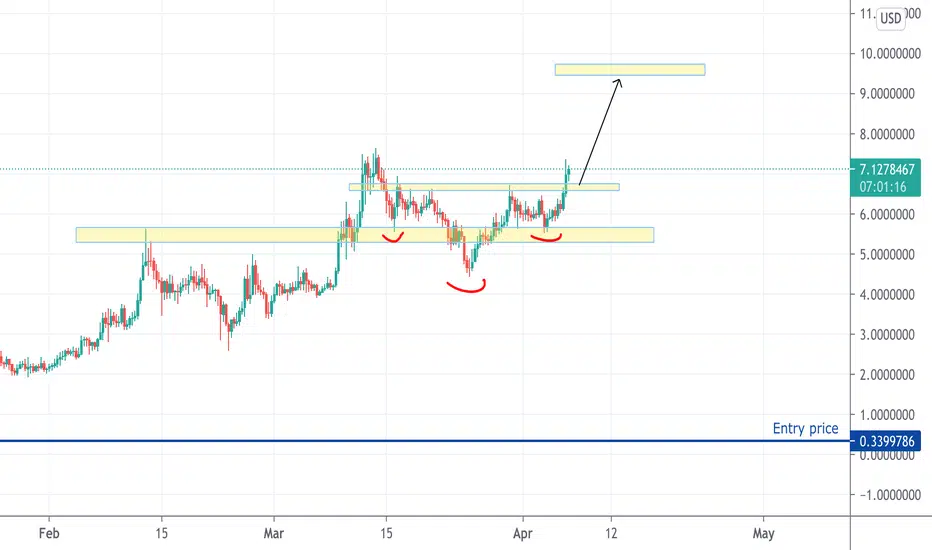
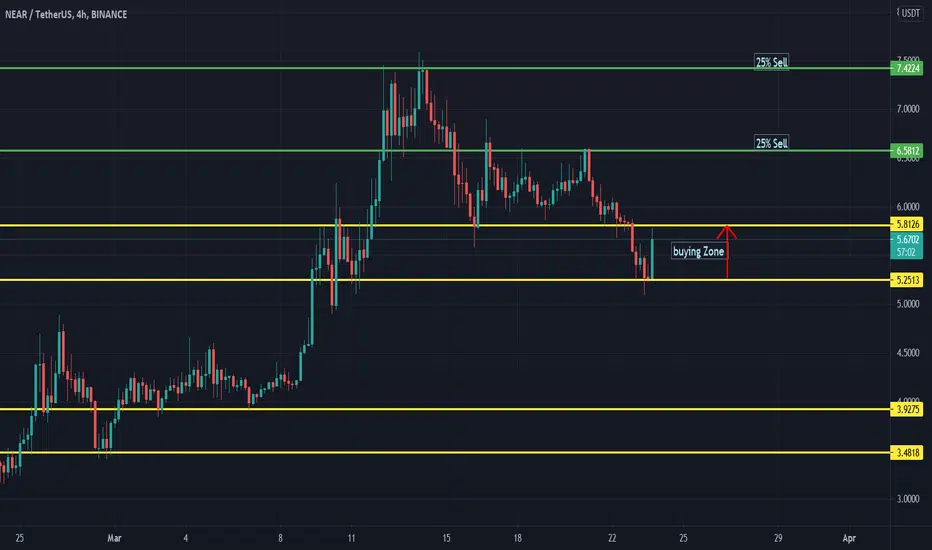
NEAR COIN | May increase 3 - 5 times in the future.NEAR COIN | May increase 3 - 5 times in the future.
The price has a very nice uptrend, is currently correcting to a good support zone. We can buy some here, if we drop to the support zone below according to the previous price screen, we can buy more to hold long.
Good luck!

NEAR USDT Buy/Sellafter creating all time high previous week, we see a huge sell in RSI and MA. But now indicator are turning NEAR high as buying started again to touch all time high again.
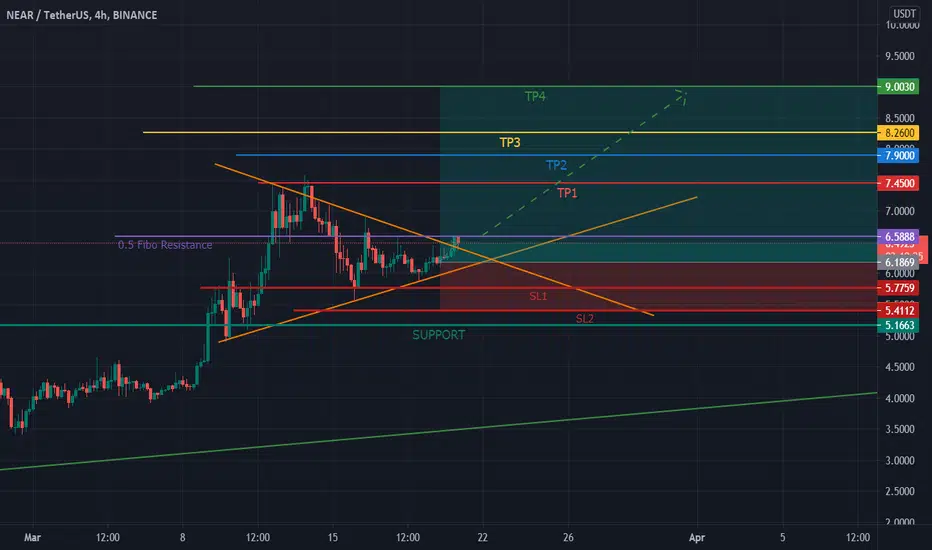
Don't miss the great buy at NEARUSDTHi guys !
First of all happy new year to my Persian friends ❤️ !
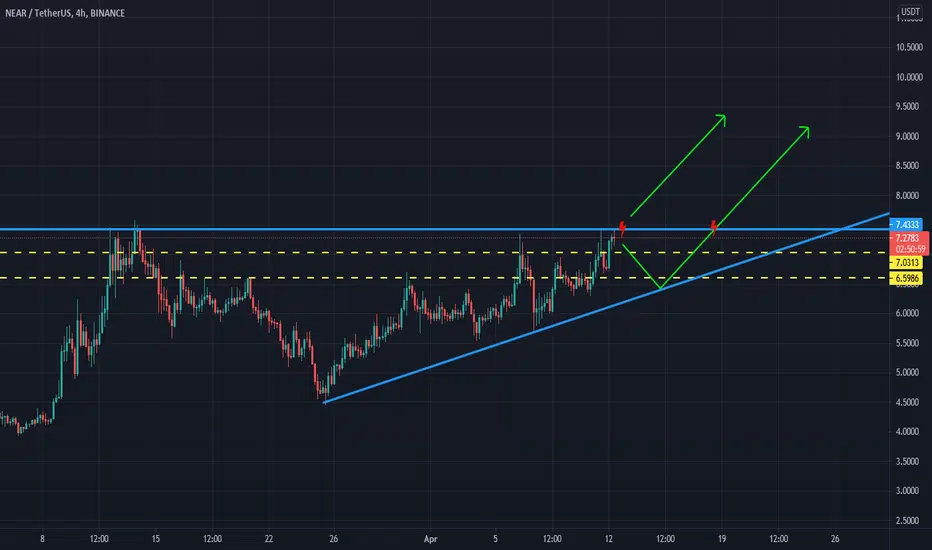
I buy it on 6.3 in the triangle but for publishing, I'm waiting to break the bearish trend of the triangle and then publish it for you!
Although the next retracement at 6.6 doesn't break yet, you can buy it in pullbacks of the triangle in the first step and then buy again after braked the 6.6 in the second step!
Entry price :
1: 6.38-6.40
2: 6.60 ( after a sure break )
TAKE PROFITS :
Short term
TP1: 7.45
TP2: 7.90
Long term
TP3: 8.26
TP4: 9
STOP LOSS :
Short term
SL1 : 5.77 OR below the bullish trend of a triangle
Long term
SL2 : 5.41 OR below the support line that I determined
Happy New Year again and hope to take a lot of profit on everything and be healthy whit your family ❤️❤️❤️
🔥 NEAR Triangle Break-OutLots of triangle break-outs recently! NEAR is one of them. Yesterday the price broke out of said triangle, but that didn't last for long. After a few hours of consolidation it appears that NEAR is trying for a second time. Wait for the price to confirm the trend before trading this break-out.
Happy trading!

NEAR Protocol coin formed Gartley for upto 14% moveHi dear friends, hope you are well and welcome to the new update on NEAR Protocol coin.
On a 4-hour time period chart, the price action of the NEAR coin has completed the formation of another bullish harmonic Gartley pattern .
This trade has a profit possibility up to 14% and the loss possibility is 4%.
Note: Above idea is for educational purpose only. It is advised to diversify and strictly follow the stop loss, and don't get stuck with trade.

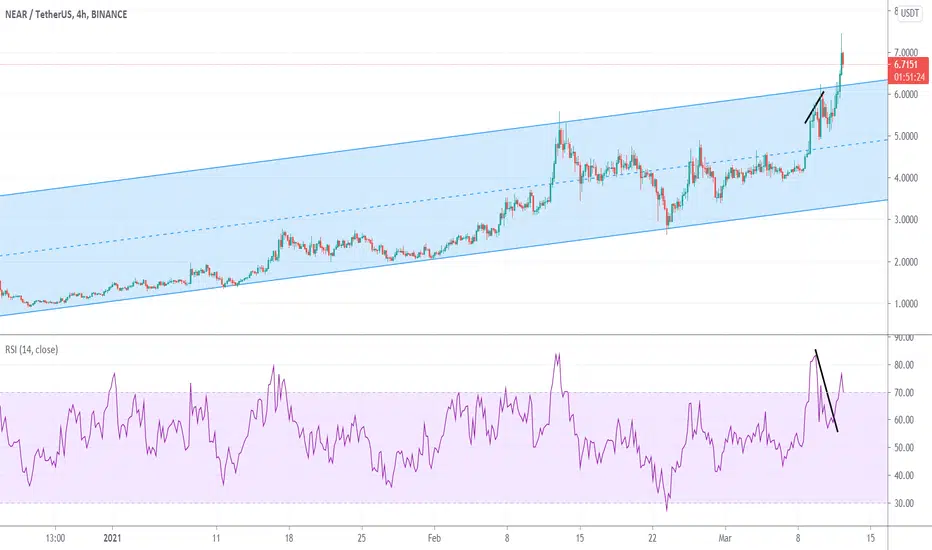
NEAR Caught in a Strong UptrendNEAR is one of the newest cryptocurrencies on the market, and it is already making a name for itself after an almost 1,000% increase over the past three months.
Fundamentals
NEAR Protocol (NEAR) is a decentralized application platform created to help developers design their apps. The network runs on a Proof-of-Stake (PoS) consensus mechanism and aims to offer scalability and stable fees.
NEAR is the native utility token that is used for:
1. Fees for processing transactions and storing data.
2. Running validator nodes on the network.
3. Governance votes to determine how network resources are allocated.
Similar to BTC, NEAR has a controlled supply. Its current supply stands at just over 300,000. The supply is set to increase by 250,000 annually and reach a total of 1,250,000 after 5 years. Economics tells us that when supply increases, price decreases. Thus this is not a positive aspect at the moment, but it will be so in five years.
NEAR on the Chart
NEAR is currently in an uptrending channel. It has recently hit the upper limit of the channel and now even broken through, indicating that a short-term pullback is imminent.
There is also a bearish RSI divergence indicating a pullback. The Relative Strength Index (RSI) is a momentum indicator that oscillates between overbought and oversold. When RSI has a value greater than 70, it is said to be overbought (indicating that it is a suitable place to sell), and when it is below 30, it is oversold (a suitable place to buy). A bearish RSI divergence occurs when the RSI is moving lower while the price is moving higher. This is precisely what happened between the 9th and 10th of March, thus further indicating a short-term reversal.
Looking Ahead: NEAR appears to be in a solid uptrend for the past three months, mostly respecting the channel drawn on the chart. However, due to the price breaching the upper limit and the bearish RSI divergence, it may see a short-term reversal before pushing higher.
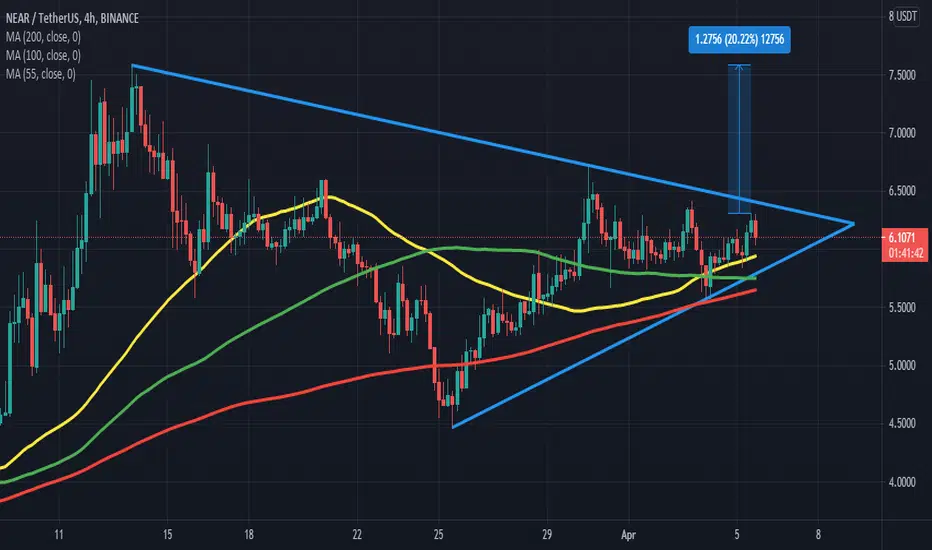
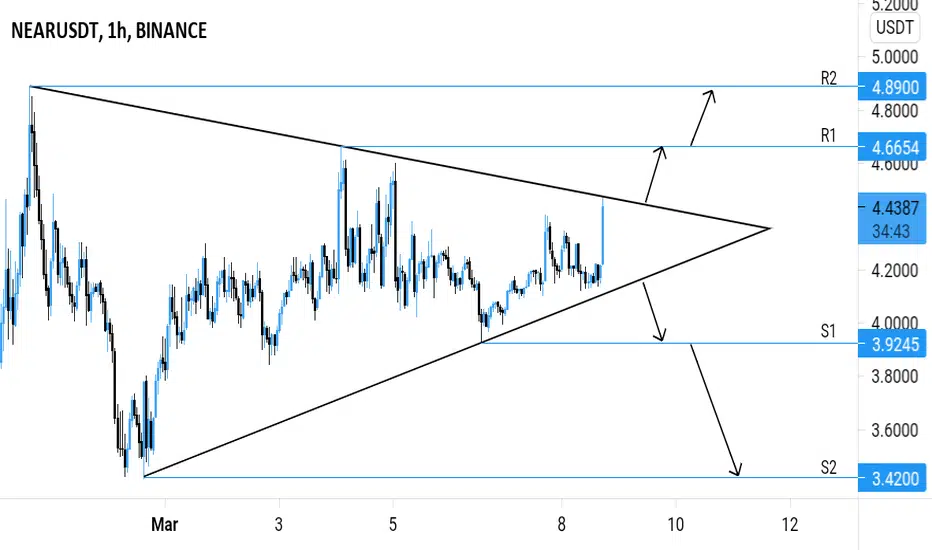
NEARUSDT (NEAR) - BIG MOVE ANALYSIS 🔎
- NEARUSDT is consolidating in a symmetrical triangle pattern .
- A relatively big move is imminent.
POSSIBLE PRICE ACTIONS
- Uptrend ⬆️: breakout above the symmetrical triangle's inclined resistance.
- Downtrend ⬇️: breakdown below the symmetrical triangle's inclined support.
TARGETS 🎯
- Uptrend ⬆️: Horizontal resistance levels (R1, R2).
- Downtrend ⬇️: Horizontal support levels (S1, S2).
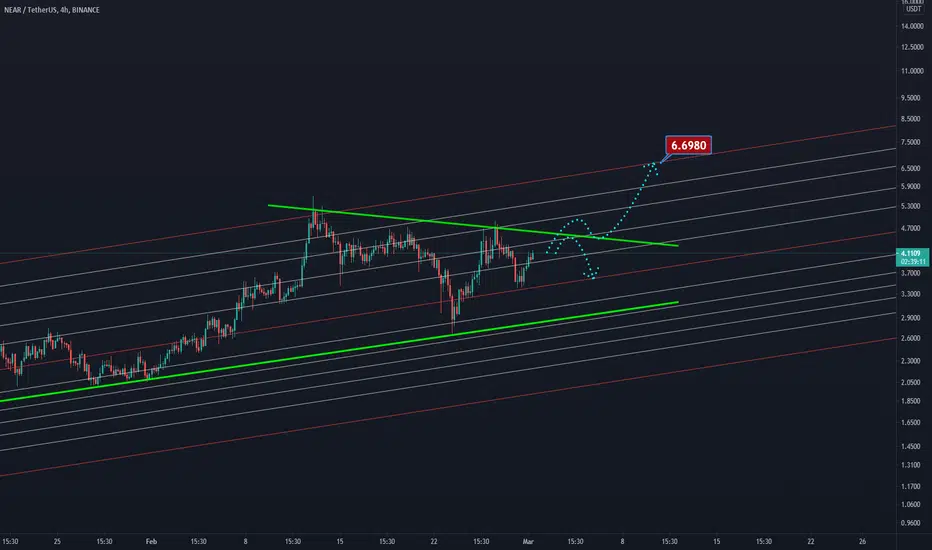
NEAR / USDT - 4HHello Guys 😉
I think There is 2 scenario for ` Near ` in Few Days ..
✅ the first one is Breaking out the triangle and Pullback to its Top and Rising to the TP .
✅ the second one is Reacting to Dynamic Resistance and Go Downward . BINANCE:NEARUSDT
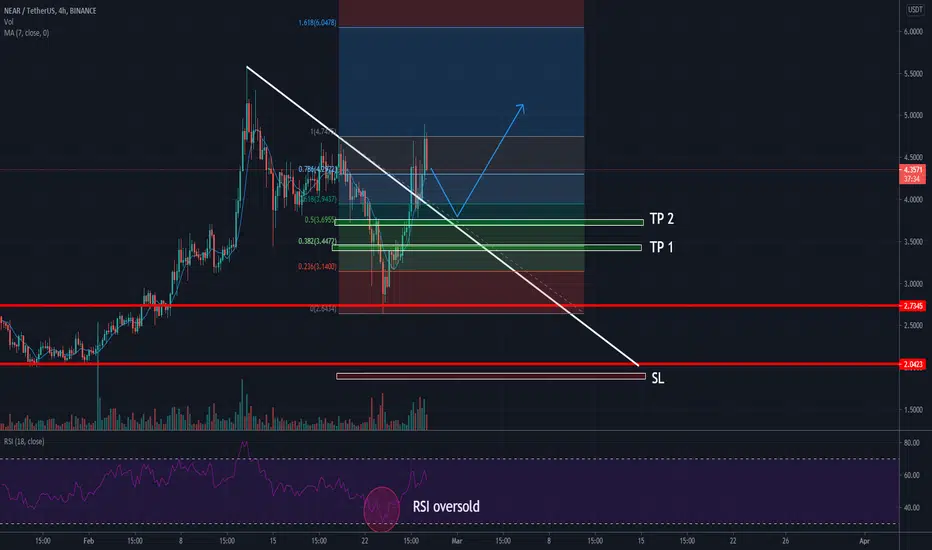
NEAR/USDT — A Dump After Bitcoin’s DropNEAR, like almost any top 100 altcoin by market cap, reacted very sharply to the recent fall of Bitcoin. Such a strong drop of the first cryptocurrency may well lead to another market correction, and as such, one should be very careful with long positions. Nevertheless, in this situation it makes sense to buy back the dip and open a long position to benefit from a bounce of NEAR in the short term.
Two major support levels are currently marked with red lines on the chart. Locally the coin is likely to continue moving in the downtrend marked by the white line. After the last downtrend, NEAR corrected to the 0.236 Fibonacci level. Given the fact that the RSI indicator has entered the oversold zone it makes sense to expect NEAR to bounce soon to at least one of the profit taking zones. Presumable trajectories of the asset's price movement are marked with blue lines. We also recommend placing a stop loss in the area below the last support level.
Use the GRID Bot by 3Commas to benefit from this strategy. Simply follow the steps below:
Head over to the GRID Bot by choosing it from the main menu in your 3Commas account;
Select the USD Market and the NEAR/USD pair;
In the GRID Bot tab, go to the Manual strategy settings;
Set the upper limit price to $3.73 and the lower limit price to $2.05;
Number of grid lines: 10;
Click the Create button.
Best of luck, and happy trading!
-The 3Commas Team